
☰ All tutorials
Start here
Tool tutorialsHow to trade with ChartMineStocks
Stock monitorMy watchlistStock scores & checklistMarket & sectors
Nifty 50Bank NiftySensexFin NiftyDaily market reportMarket breadthSector rotationSector heatmapStock screenerRelative strength (RS)MCX commodity pricesFear & Greed IndexWhat happens after…Scanners
Top gainers & losersStocks to watch tomorrowNR7 stocks scannerInside bar stocks52-week high stocksGap up & gap down stocksRSI oversold stocksGolden cross stocksSuperTrend buy stocksScan builderEMA 9/21 crossoverMACD crossoverADX strong trendBollinger breakout / squeezeVolume spike stocksOpen = high / open = lowCandlestick pattern scannerNarrow CPR scannerF&O data
F&O ban listOI build-upOption chainPCR & max painExpiry calendarF&O lot sizesOI build-up heatmapPCR trendMax pain trendFutures basisStock screens
Quarterly growersProfit growth stocksLow P/E stocksMutual fund buyingNear 52-week low, growingDebt-free companiesHigh ROE & ROCEMagic Formula stocksLow price-to-bookSmart money
FII / DII dataShareholding changesBig-money footprintShort selling dataF&O positions by participantBulk & block dealsPromoter buyingDelivery percentageCalendars
Results calendarQuarterly results trackerBoard meetingsCorporate actionsIPO calendarIPO performanceResearch & planning
Strategy testerCompare stocksDividend yield stocksASM / GSM listExpiry-day movesSeasonality & stock historyNSE holidays 2026Position size calculatorOption payoff calculatorPivot point calculatorMore
Stock scanners hubStock screensHow to use the debt-free companies screen
A plain-language tutorial on debt-free companies: what borrowings, equity and ROE mean, the exact rules behind the list, why lease-heavy companies are removed, how to read the screen and stock page, and real examples from November 2026.
What “debt-free” means, in plain words
A company can pay for its business in two ways. It can use its owners’ money (the capital shareholders put in plus the profits it kept over the years), or it can borrow from banks and bond investors. Borrowed money must be repaid with interest, whether the year is good or bad.
A debt-free company runs almost entirely on its owners’ money. It has little or nothing to repay, no interest bill eating into profit, and no lender who can demand money back in a crisis.
The Debt-free companies screen lists NSE companies whose borrowings are under 10% of shareholders’ equity at the latest balance sheet, and which still earn a decent return: a return on equity (ROE) of 12% or more over the last four quarters. The second rule matters. A company with no debt and no profit is not interesting; one that earns well without borrowing usually is.
Three words you need, explained once:
- Shareholders’ equity (also “net worth” or “book value”): what the company owns minus what it owes. In plain words, the owners’ share of the business according to the accounts.
- Borrowings: loans and bonds the company has to repay, short-term and long-term.
- ROE: yearly profit ÷ shareholders’ equity, in %. How many rupees of profit the company makes on every ₹100 of the owners’ money.
One line to remember: debt-free shows a company is safe from its lenders. ROE shows it is good at using its owners’ money. The screen asks for both. Neither tells you whether the share price is reasonable.
The exact rules, and a worked example
These are the rules in ChartMine’s screen code. The balance sheet figures come from the half-yearly (September) and annual (March) results each company files with NSE, consolidated where the company reports consolidated results.
| Rule | What it means |
|---|---|
| Debt / equity under 0.1 | Borrowings (long-term plus short-term) ÷ shareholders’ equity at the latest balance sheet is below 0.1. In other words, borrowings are less than ₹10 for every ₹100 of equity. |
| ROE 12% or more | Profit belonging to shareholders over the last four quarters ÷ average shareholders’ equity (the latest balance sheet and the one about 12 months earlier; the latest alone if the older one is not on file). |
| Regular companies only | Banks, NBFCs and other finance companies are left out. Borrowing is their raw material, so “debt-free” means nothing for them. |
| Leases are not counted, so lease-heavy companies are removed | NSE’s filings do not report lease liabilities (rent commitments for shops, offices, aircraft) separately, so borrowings exclude them. When a company’s finance costs are more than 20% of its reported borrowings and more than 10% of its operating profit, the interest must be coming from somewhere else, usually leases. Such companies are kept off the list. |
| No one-off quarters | If the median of the last four quarterly profits is positive and one quarter is more than three times that median, the ROE is probably inflated by a one-time gain, and the stock is left out. When most of the four quarters are losses the median is negative and this check does not apply (see case 5). |
| Size and liquidity | Market cap of at least ₹500 crore, enough trading history and turnover. |
| Sort | Highest ROE first. The table shows the top 150; when more match (266 on 13 Nov 2026) a note under it links to the stock screener for the rest. |
Worked example: Tata Consultancy Services (TCS)
From TCS’s consolidated filings, with the balance sheet as at 30 Sep 2026:
- Borrowings: ₹0. Shareholders’ equity: ₹1,18,986 crore. Debt / equity = 0 ÷ 1,18,986 = 0.00. Passes.
- Profit of the last four quarters (Oct 2025 to Sep 2026): 10,657 + 13,718 + 13,349 + 13,884 = ₹51,608 crore.
- Equity a year earlier (30 Sep 2025): ₹1,06,415 crore. Average equity: (1,18,986 + 1,06,415) ÷ 2 = ₹1,12,700 crore.
- ROE = 51,608 ÷ 1,12,700 = 45.8%. Passes the 12% rule easily.
- TCS also held ₹54,640 crore of cash, bank balances and current investments. It is not just debt-free; it has a large cash pile.
Types of debt, and types of “debt-free”
“Debt” means different things in different conversations. Knowing the types prevents most misunderstandings.
| Item | Counted as borrowings here? | Why it matters |
|---|---|---|
| Bank loans, bonds, debentures, commercial paper | Yes | Must be repaid with interest. This is what “debt” normally means. |
| Lease liabilities (rent for stores, offices, aircraft, cinema screens) | No (not reported separately) | Behaves like debt: a fixed payment every month. That is why lease-heavy companies are removed. |
| Trade payables (money owed to suppliers) | No | Part of normal business, usually interest-free. |
| Customer advances | No | Money customers paid upfront. Often a sign of a strong business. |
Three ways a company can be “debt-free”
- Zero debt: no borrowings at all. TCS, Infosys and Colgate-Palmolive reported ₹0 borrowings at 30 Sep 2026.
- Low debt: some borrowings, but under 10% of equity. Still on this list.
- Net cash: borrowings exist but cash is larger. Hindustan Zinc had ₹6,171 crore of borrowings and ₹17,258 crore of cash and investments at 30 Sep 2026: net cash, but its debt / equity of 0.21 keeps it off this list, because the screen uses gross borrowings, not borrowings minus cash.
The screen is deliberately strict: it uses gross borrowings, because cash can be spent, moved to a subsidiary or tied up, while loans still have to be repaid.
Advantages and limits (with a short test)
✅ Survives bad times
No interest bill and nothing to refinance when rates rise or a slowdown hits. Debt is the most common reason companies go bust.
✅ Profits belong to shareholders
Without interest costs, more of the operating profit is left for owners, as dividends or growth.
✅ Freedom to act
A debt-free company can invest, buy a rival or buy back shares without asking lenders.
✅ High ROE without leverage
Because borrowings are tiny, a high ROE here comes from the business itself, not from borrowed money.
The limits
- No growth rule. The list does not ask for growing profits. Castrol India was on it on 13 Nov 2026 with a 53.0% ROE while its latest quarterly profit was 23% lower than a year earlier.
- Price is ignored. Debt-free, high-ROE companies are popular, so many trade at high P/Es (Nestle India at 59.8 on 13 Nov 2026).
- Too little debt can be a choice, not a virtue. A business that could borrow cheaply to grow faster may be leaving returns on the table.
- Balance sheets are old. Companies file them only twice a year, so the figure can be up to about eight months old.
- One huge quarter can slip through. The one-off check needs a positive median profit, so a mostly loss-making company with one giant quarter can top the list (case 5).
- Leases are invisible in the borrowings figure; the lease filter catches the obvious cases, not every one.
What happened in a five-month test
We rebuilt the list on 1 Jun 2026 using only data filed before that day (March 2026 balance sheets) and checked prices on 6 Nov 2026 (price change only, dividends not included):
| Group | Stocks | Median change | Average | Share that rose |
|---|---|---|---|---|
| Debt-free list | 223 | −2.6% | 0.0% | 46% |
| All eligible stocks | 1,238 | −2.6% | +1.5% | 45% |
In plain words: over these five months the debt-free list did about the same as the market, no better. That is not surprising: safety shows up mainly in bad times, and five months is far too short to judge. We could not test a longer period because ChartMine’s balance-sheet history starts in 2025.
A tour of the screen
Open the Debt-free companies page. At the top are the rule and three summary chips. On 13 Nov 2026, 266 companies matched.
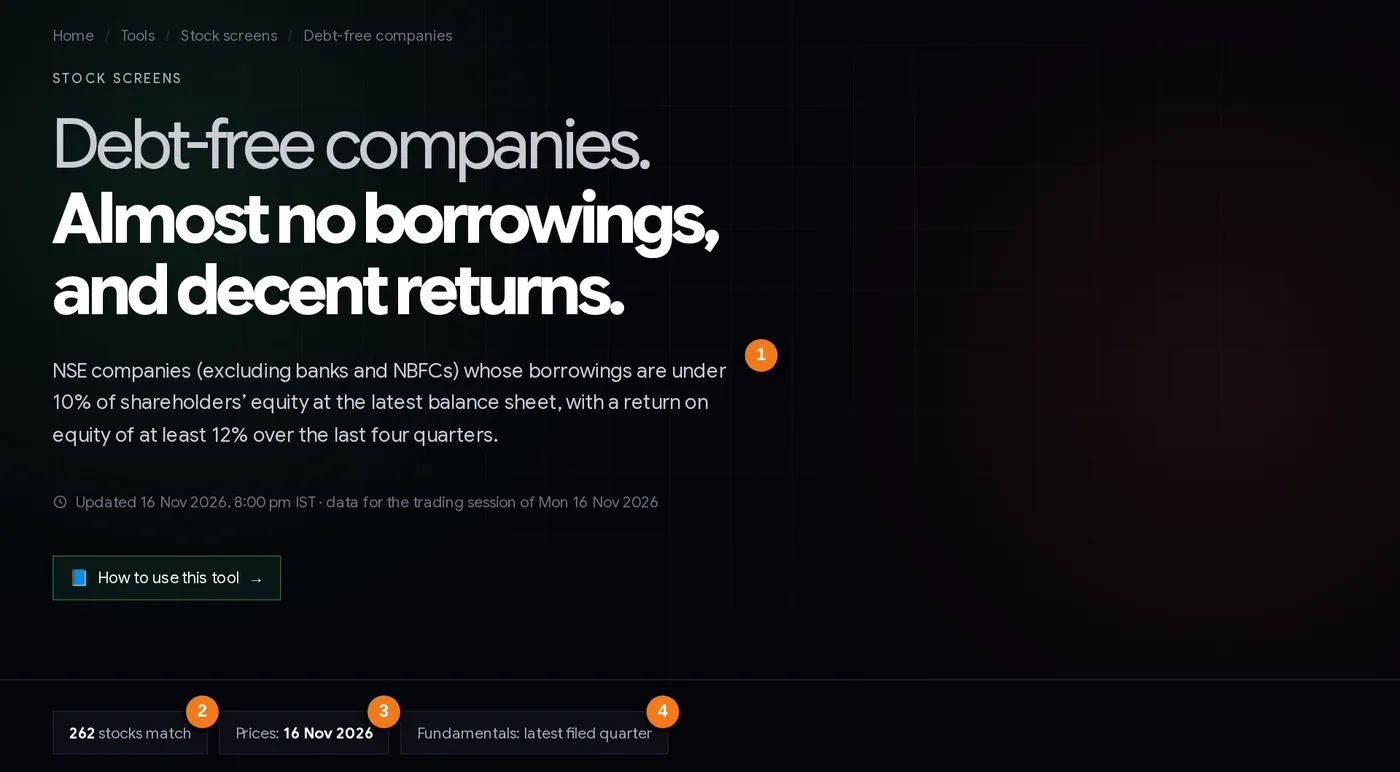
- 1The rule: borrowings under 10% of equity, ROE 12%+, banks and NBFCs excluded.
- 2How many companies match.
- 3Date of the prices used.
- 4Fundamentals are from each company’s latest filings.
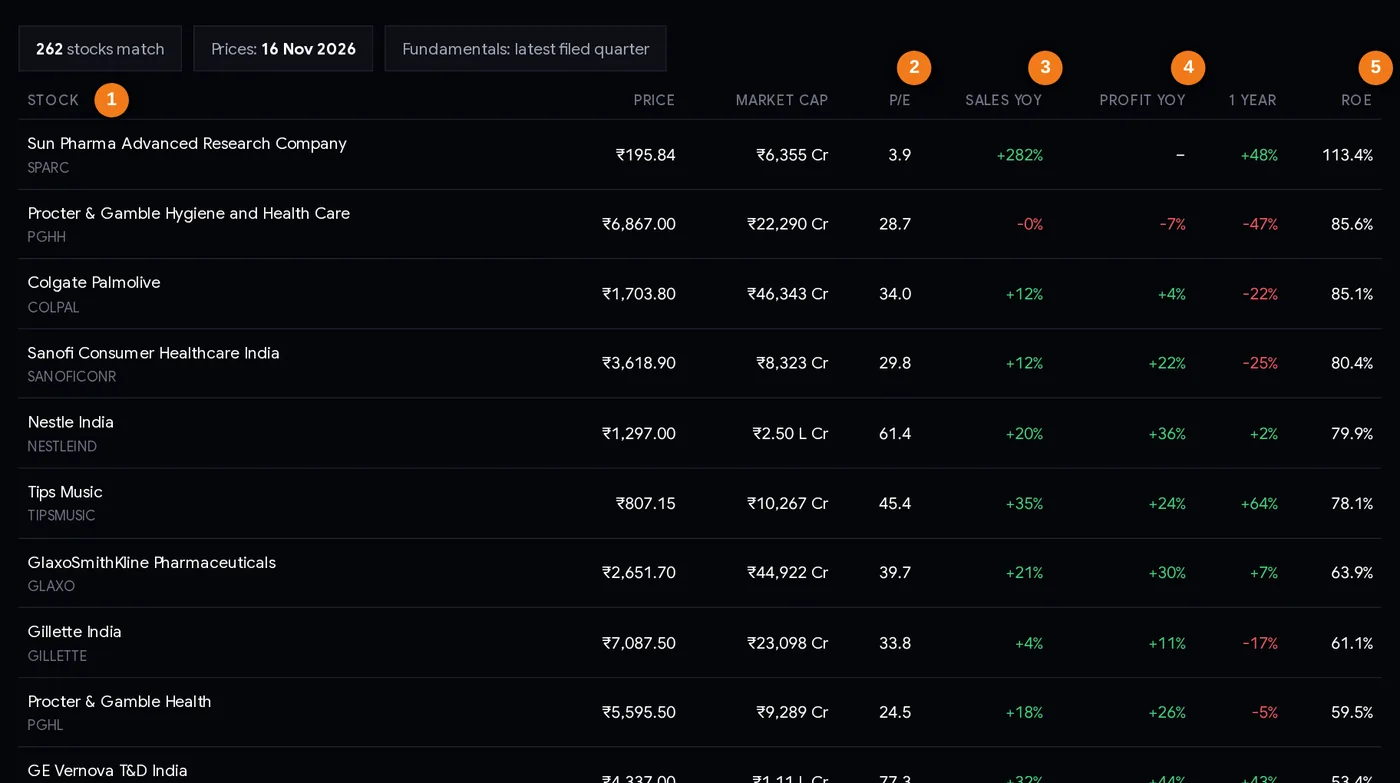
- 1Company and symbol (click for the stock page)
- 2P/E, last four quarters
- 3Sales growth on a year ago
- 4Profit growth on a year ago
- 5ROE, last four quarters
Every column explained
| Column | What it tells you |
|---|---|
| Stock | Company and NSE symbol. Click to open the stock page with the full balance sheet. |
| Price | Last closing price. |
| Market cap | Market value in ₹ crore; “L Cr” = lakh crore. |
| P/E | Price ÷ earnings per share of the last four quarters. Compare it with the company’s sector before calling it cheap or expensive. |
| Sales YoY / Profit YoY | Latest quarter against the same quarter last year. Red means lower. The screen does not require growth, so check these. |
| 1 year | Price change over the last year. |
| ROE | Return on equity, last four quarters. The list is sorted by it, highest first. |
Only the top 150 by ROE are shown in the table; the note below it links to the stock screener for the full list. Click any name and scroll to Balance sheet, returns and cash flow on its stock page to see the numbers behind the screen. The boxes also show interest cover, free cash flow, EV/EBITDA, dividend payout and the net margin trend; the table gives equity, borrowings, cash, operating cash flow and capex at the last three balance sheet dates:
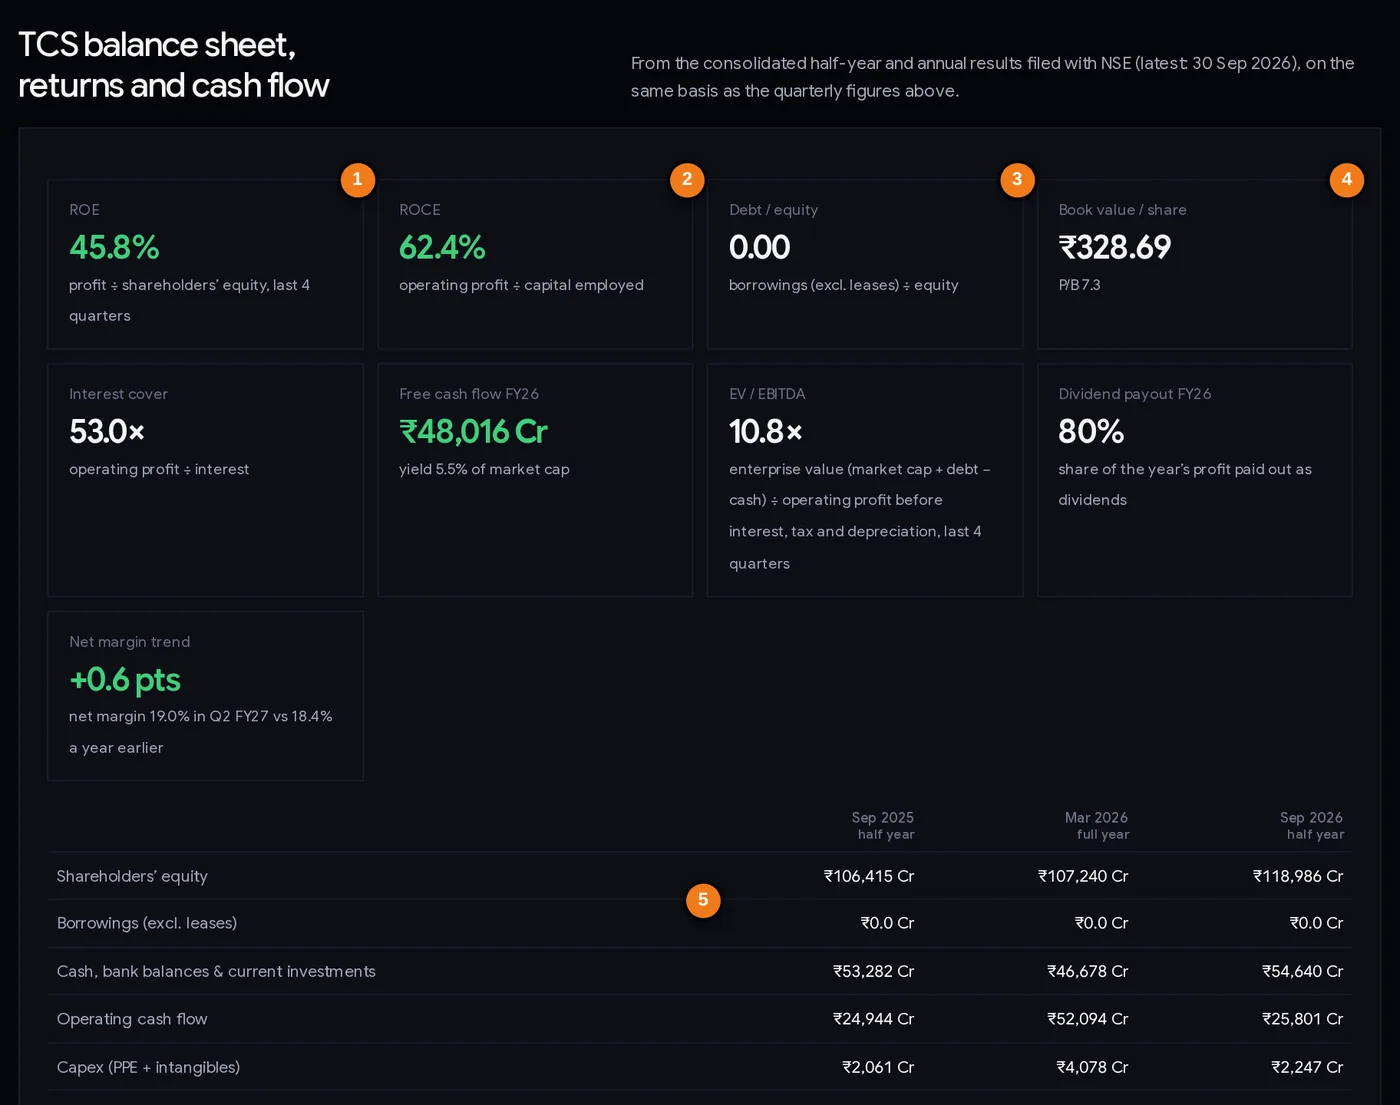
- 1ROE: profit ÷ average equity, last four quarters
- 2ROCE: operating profit ÷ capital employed
- 3Debt / equity, borrowings excluding leases
- 4Book value per share and P/B
- 5Borrowings at each balance sheet date
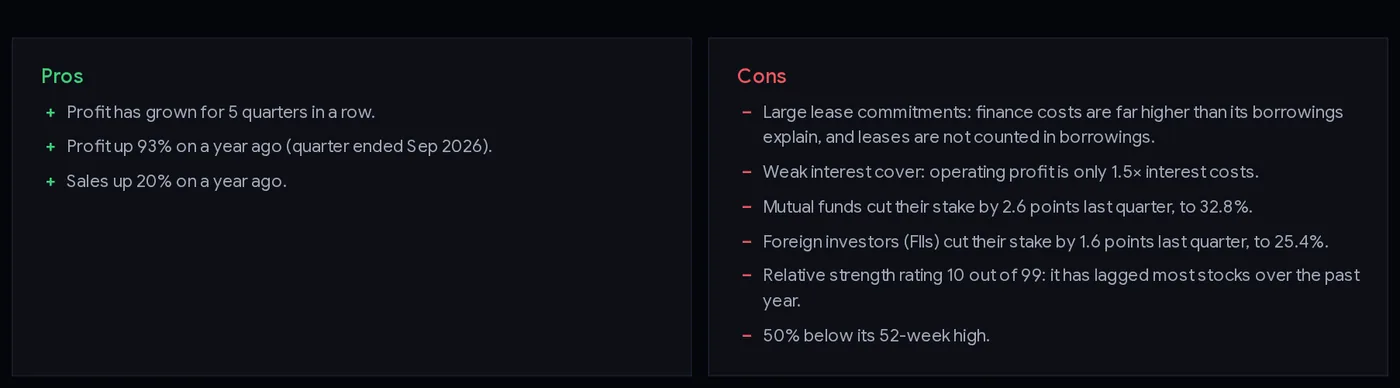
When a company is lease-heavy, its stock page says so in the Pros and cons box, and its ROCE is shown as a dash:
Step by step: how to research a name (20 minutes each)
- Open the list and note the count and the price date.
- Skim the ROE column. ROE above 50% is usually a sign of a company that pays out most of its profit as dividends (small equity) or of an unusual year. Read the stock page before assuming it is “the best”.
- Check growth. Red in Sales YoY or Profit YoY is a question: a slow quarter or a trend?
- Check the price. Compare the P/E with its sector median on the stock page. A great business at a very high price can still be a poor investment for years.
- Open the balance sheet section. Look at equity, borrowings and cash over the three dates. Is equity rising (profits kept) or falling (big dividends, buybacks or losses)?
- Check free cash flow (cash from operations minus capital spending). Profits that turn into cash are more reliable.
- Read the Pros and cons box for warnings such as lease commitments or a single exceptional quarter.
- Look at who owns it. The shareholding changes page shows whether mutual funds and FIIs are adding or cutting.
Three ways investors use this list
Playbook A: the quality core
Some long-term investors build the stable part of a portfolio from debt-free, high-ROE businesses with steady growth. They combine this list with the quarterly growers or high ROE screens, buy in instalments rather than all at once, and review the company each results season instead of watching the price daily.
Playbook B: the safety filter for other ideas
Use the list as a filter, not a source. When another screen (for example near the 52-week low or low P/E) gives you a name, check whether it is also debt-free. A cheap stock with no debt can wait out a bad patch; a cheap stock with heavy debt may not get the chance.
Playbook C: the reasonable-price hunt
Sort mentally by P/E: look for names on this list whose P/E is at or below their sector median and whose sales are still growing. On 13 Nov 2026, for example, TCS was on the list at a P/E of 16.9 with sales up 11% and profit up 15% on a year earlier. That is not a recommendation; it is how the screen narrows 266 names to a handful worth reading about.
Risk still applies. A debt-free company’s share price can fall 30–50% if growth slows or the market re-rates it (Procter & Gamble Hygiene was 46% lower than a year earlier on 13 Nov 2026 despite an 85.6% ROE). Keep each stock to a size you can afford to see fall, and decide your exit rules before buying.
Case studies from November 2026 data
1. Awfis Space Solutions: why a “debt-free” number was rejected
At 30 Sep 2026, Awfis reported borrowings of just ₹51.4 crore against equity of ₹609 crore: debt / equity 0.08, under the 0.1 limit. Its ROE was 18.0%, above 12%. On these two numbers it would qualify.
But its finance costs over the last four quarters were ₹191 crore, nearly four times its total borrowings, and about 65% of its operating profit of ₹292 crore. Nobody pays ₹191 crore of interest on ₹51 crore of loans. The interest is on leases: Awfis rents the office buildings it sublets as co-working space. The screen marks it lease-heavy and leaves it out, and its stock page warns about large lease commitments. Lesson: “borrowings” in the filings are not the whole story for retailers, airlines, cinemas and co-working companies.
2. IndiGo and PVR INOX: the same pattern, bigger
InterGlobe Aviation (IndiGo) reported borrowings of ₹2,281 crore at 30 Sep 2026 but finance costs of ₹6,253 crore in four quarters, mostly on aircraft leases. PVR INOX showed debt / equity of only 0.07, yet paid ₹675 crore of finance costs on ₹501 crore of borrowings. Both are flagged lease-heavy and kept off the list (both also have ROEs below 12%).
3. Hindustan Zinc: rich in cash, still not on the list
Hindustan Zinc had ₹17,258 crore of cash and investments against ₹6,171 crore of borrowings at 30 Sep 2026, and an ROE of 95%. Because the screen uses gross borrowings, its debt / equity of 0.21 keeps it off. You will find it on the high ROE screen instead. Lesson: if you care about net cash, look at the cash line on the stock page as well.
4. Colgate-Palmolive (India): high ROE from a lean balance sheet
Colgate’s standalone equity at 30 Sep 2026 was only ₹1,618 crore, while its last four quarters’ profit was ₹1,362 crore. ROE: 85%. That is not because it borrows (borrowings: ₹0) but because it pays out most of its profit every year, so equity stays small. On 13 Nov 2026 its P/E was 34.2 and the share price was 21% lower than a year earlier. Lesson: a very high ROE in a debt-free company often reflects generous dividends, which is good for owners, but it does not make the stock cheap.
5. SPARC: one quarter makes the whole ROE
On 13 Nov 2026 the top of the list was Sun Pharma Advanced Research Company (SPARC), with an ROE of 113.4% and a P/E of just 4.1. The quarterly filings explain it. Its last four quarters’ profits were −₹80 crore (Dec 2025), +₹1,761 crore (Mar 2026, on revenue of ₹1,853 crore), −₹21 crore (Jun 2026) and −₹24 crore (Sep 2026). In the other quarters revenue was ₹8–40 crore. One quarter produced all of the profit. Its equity was −₹345 crore a year earlier and ₹1,442 crore at 30 Sep 2026, so the average equity used for ROE is small, which inflates the ratio further. Because three of the four quarters were losses, the median profit is negative and the one-off check does not trigger. Lesson: when a name at the top looks too good (very high ROE, very low P/E), open the quarterly results on its stock page and look at every quarter before reading anything into the ratio.
Common mistakes
- Treating debt-free as “safe to buy at any price”. The balance sheet is safe; the share price is not.
- Ignoring leases in retail, aviation, hospitals, cinemas and co-working. Check finance costs against borrowings.
- Mixing up gross and net debt. This screen uses gross borrowings; a net-cash company can be missing from it.
- Chasing the highest ROE. Very high ROE often comes from a small equity base (big dividends or buybacks) or one unusual quarter, as with SPARC on 13 Nov 2026.
- Forgetting the date of the balance sheet. It may be from March or September; a lot can change in six months.
- Expecting banks on the list. Finance companies are excluded by design; use the low P/B screen for them.
Research checklist
- Borrowings are tiny and finance costs are tiny (no hidden leases).
- ROE is not driven by one exceptional quarter (all four quarters checked, including loss quarters).
- Equity has been stable or rising across the last three balance sheets.
- Sales and profit are growing, or I understand why they are not.
- Free cash flow is positive.
- P/E compared with the sector median and the company’s growth.
- Position size and exit rule decided before any purchase.
Glossary
| Shareholders’ equity | Assets minus liabilities: the owners’ share of the business in the accounts. Also called net worth or book value. |
| Borrowings | Loans, bonds and other debt that must be repaid, long-term plus short-term. |
| Debt / equity (D/E) | Borrowings ÷ equity. Under 0.1 = borrowings below 10% of equity. |
| Net cash | Cash and investments larger than borrowings. |
| ROE | Profit to shareholders over the last four quarters ÷ average equity, in %. |
| ROCE | Operating profit (profit before tax + finance costs) ÷ capital employed (equity + borrowings), in %. |
| Finance costs | Interest and similar charges in the profit and loss statement, including interest on leases. |
| Lease liability | The value of future rent payments a company has committed to. Treated like debt in accounting since 2019 (Ind AS 116). |
| Free cash flow | Cash from operations minus spending on plant, equipment and intangibles. |
| Consolidated | Figures for the company and its subsidiaries together. |
Questions
Which stocks are debt free in India?
ChartMine’s debt-free screen lists NSE companies (excluding banks and NBFCs) whose borrowings are under 10% of shareholders’ equity at their latest balance sheet and whose ROE is 12% or more. On 13 Nov 2026 prices, 266 companies matched, from TCS and Infosys to Colgate-Palmolive and Nestle India.
What is a good debt to equity ratio?
For regular (non-finance) companies, under 0.5 is generally considered comfortable and under 0.1 almost debt-free. It depends on the industry: utilities and infrastructure usually carry more debt. Banks and NBFCs are judged differently.
Are debt-free companies a good investment?
They are financially safer, but the share price can still fall if growth slows or the stock was expensive. In ChartMine’s five-month test (Jun to Nov 2026) the debt-free list did about the same as the market. Use it as a starting point for research.
Why are lease liabilities not counted as debt here?
NSE’s results filings do not report lease liabilities separately, so the borrowings figure excludes them. To avoid misleading results, companies whose finance costs are far higher than their borrowings explain (usually because of leases) are removed from the list.
Why is a company with lots of cash missing from the list?
The screen uses gross borrowings, not borrowings minus cash. A company with large cash but borrowings above 10% of equity, such as Hindustan Zinc in Sep 2026, will not appear.
Why does a company with one huge quarter appear on the debt-free list?
The screen removes a company when one quarter’s profit is more than three times the median of its last four quarters, but only when that median is positive. If most quarters were losses, the check does not apply, so always look at all four quarters on the stock page.
How is ROE calculated on ChartMine?
Profit attributable to shareholders over the last four quarters divided by average shareholders’ equity from the latest balance sheet and the one about a year earlier, on the same consolidated or standalone basis as the results.