
☰ All tutorials
Start here
Tool tutorialsHow to trade with ChartMineStocks
Stock monitorMy watchlistStock scores & checklistMarket & sectors
Nifty 50Bank NiftySensexFin NiftyDaily market reportMarket breadthSector rotationSector heatmapStock screenerRelative strength (RS)MCX commodity pricesFear & Greed IndexWhat happens after…Scanners
Top gainers & losersStocks to watch tomorrowNR7 stocks scannerInside bar stocks52-week high stocksGap up & gap down stocksRSI oversold stocksGolden cross stocksSuperTrend buy stocksScan builderEMA 9/21 crossoverMACD crossoverADX strong trendBollinger breakout / squeezeVolume spike stocksOpen = high / open = lowCandlestick pattern scannerNarrow CPR scannerF&O data
F&O ban listOI build-upOption chainPCR & max painExpiry calendarF&O lot sizesOI build-up heatmapPCR trendMax pain trendFutures basisStock screens
Quarterly growersProfit growth stocksLow P/E stocksMutual fund buyingNear 52-week low, growingDebt-free companiesHigh ROE & ROCEMagic Formula stocksLow price-to-bookSmart money
FII / DII dataShareholding changesBig-money footprintShort selling dataF&O positions by participantBulk & block dealsPromoter buyingDelivery percentageCalendars
Results calendarQuarterly results trackerBoard meetingsCorporate actionsIPO calendarIPO performanceResearch & planning
Strategy testerCompare stocksDividend yield stocksASM / GSM listExpiry-day movesSeasonality & stock historyNSE holidays 2026Position size calculatorOption payoff calculatorPivot point calculatorMore
Stock scanners hubStock screensHow to use the EMA crossover stocks scanner
A plain-language tutorial on the 9/21 EMA crossover: the formula, what a cross does and does not tell you, a two-year test on 1,474 NSE stocks, a tour of the scanner and three playbooks with real case studies.
What an EMA crossover is, in plain words
A moving average is the average closing price over the last few days, worked out again every evening. It smooths away the daily noise so that you can see which way a stock is drifting.
An exponential moving average (EMA) is a moving average that gives more weight to recent days. Yesterday’s close counts more than the close of two weeks ago. Because of that, an EMA reacts faster to a new move than a simple average of the same length.
An EMA crossover uses two EMAs of different lengths:
- The fast EMA (here the 9-day EMA) follows the price closely.
- The slow EMA (here the 21-day EMA) moves more calmly.
When the fast line climbs above the slow line, the short-term trend has turned up: a bullish crossover. When it drops below, the short-term trend has turned down: a bearish crossover.
One line to remember: a 9/21 EMA crossover tells you that the last two weeks have been stronger (or weaker) than the last month. It describes a change that has already happened; it does not forecast the next one.
The EMA crossover stocks scanner checks every actively traded NSE stock (about 1,300 on 13 Nov 2026) after each close and lists those whose 9 EMA crossed the 21 EMA in the last three sessions.
How the 9 and 21 EMA are calculated
You never need to calculate an EMA by hand, but knowing the recipe explains why the lines behave the way they do.
- Pick the length (n). Here n = 9 and n = 21.
- Work out the weight k = 2 ÷ (n + 1). For the 9 EMA, k = 0.2 (20%). For the 21 EMA, k = 2 ÷ 22, about 0.091 (9.1%).
- Today’s EMA = today’s close × k + yesterday’s EMA × (1 − k).
- Repeat every day. Old closes never drop out completely; their weight just keeps shrinking.
So the 9 EMA moves 20% of the way from its old value toward today’s close each day, while the 21 EMA moves only about 9%. On a big day the fast line jumps more than twice as far as the slow one, and that is how crossovers happen.
Real example: Hitachi Energy India, 13 Nov 2026
On 13 Nov 2026 Hitachi Energy India (POWERINDIA) closed at ₹31,595, up 10.68%, on 5.9 times its 20-day average volume. Working the formula backwards from the scanner’s values:
| 12 Nov (day before) | 13 Nov | Change | |
|---|---|---|---|
| 9 EMA | about ₹28,317 | ₹28,972.80 | +₹656 |
| 21 EMA | about ₹28,588 | ₹28,861.22 | +₹273 |
| 9 EMA minus 21 EMA | about −₹271 | +₹111.58 | crossed |
One strong close pulled the 9 EMA up by about ₹656 and the 21 EMA by only about ₹273, so the fast line moved above the slow one. Notice that the close (₹31,595) was already about 9% above both lines. By the time a crossover prints, a good part of the move is usually behind it.
The scanner’s exact rule
- Daily closes from NSE’s own files, adjusted for splits and bonuses.
- A bullish crossover on a day: the day before, the 9 EMA was at or below the 21 EMA; on that day it is above. The stock is listed if this happened today or in either of the two previous sessions and the 9 EMA is still above the 21 EMA today.
- A bearish crossover is the mirror image.
- If the lines crossed and then crossed back within the three days, the stock is not listed.
Types of moving-average crossovers
| Type | Rule | What traders read into it |
|---|---|---|
| Bullish 9/21 crossover | 9 EMA crosses above 21 EMA | Short-term trend turning up. The scanner’s first tab. |
| Fresh crossover | The cross happened on the scan day | The “Crossed today” tab: the earliest look, but no confirmation yet. |
| Bearish 9/21 crossover | 9 EMA crosses below 21 EMA | Short-term trend turning down. Holders often treat it as a warning. |
| Price cross | Close crosses a single EMA (say the 21) | Earlier than a two-line cross, with more false signals. Read it on your chart. |
| Slow crosses | 50-day over 200-day (golden cross) | Long-term trend changes, a few times a year at most. See the golden cross scanner. |
| Triple EMA stack | 9 above 21 above 50 (or 200) | All trends pointing the same way. Approximate it with the scanner’s trend filter. |
Other popular pairs
Traders also use 5/13, 8/21, 12/26, 20/50 and 50/200. Shorter pairs cross more often and earlier; longer pairs cross less often and later. There is no “best” pair: each is a trade-off between speed and false signals. The scanner is fixed at 9/21 on daily candles, so a chart set to 8/21 or to simple averages will show crosses on different days.
EMA or simple average?
A simple moving average (SMA) gives every day the same weight, so a big move from 21 days ago falls out suddenly and can make the line jump for no current reason. An EMA fades old data gradually. That makes EMA crosses a little earlier and smoother, but not more accurate in any proven way.
Why traders use EMA crossovers: advantages and limits
✅ Simple and objective
Either the 9 is above the 21 or it is not. Two traders looking at the same chart agree on the signal.
✅ Fast enough for swing trades
A 9/21 pair reacts within days, which suits trades that last from one to six weeks.
✅ Works as an exit rule too
Many holders use the bearish cross as a mechanical reason to reduce, instead of hoping.
✅ Easy to combine
Adding a 200-day trend filter, volume or RSI turns a raw cross into a short list worth studying.
The limits
- It lags. Both lines are averages of past closes. The Hitachi Energy example shows the close already about 9% above the lines on the crossover day.
- It whipsaws in sideways markets. When a stock drifts in a range, the two lines keep crossing back and forth. In our two-year test below, about 41% of bullish crosses crossed back down within ten sessions.
- It knows nothing about the business. Results, news and the overall market can overrule any line on a chart.
- It does not give a stop loss. Unlike SuperTrend, the EMAs do not mark a natural exit level; you must choose one yourself.
- Volume can mislead. In thinly traded stocks, a small order can look like many times the normal volume.
An honest two-year test of 9/21 EMA crossovers
Before trusting any signal, check what followed it in the past. We rebuilt the scanner’s rule on every stock in ChartMine’s current list that had enough history: 1,474 NSE stocks, adjusted daily prices from NSE files, signals from 15 Jan 2025 to 13 Nov 2026. For each crossover we measured the return from that day’s close and compared it with the average stock over the same days.
Context matters: NIFTY rose from 23,213 (15 Jan 2025) to 25,144 (13 Nov 2026), about 8%, but the typical stock did worse. Across all stock-days in the test, only 46.8% of stocks were higher 20 sessions later. That is the base rate any signal has to beat.
| After the crossover | All bullish | Bullish, above 200-DMA | Bullish, below 200-DMA | Bullish, volume 1.5×+ | All bearish |
|---|---|---|---|---|---|
| Cases | 13,592 | 4,652 | 4,497 | 4,946 | 13,012 |
| Higher after 5 sessions | 47.2% | 45.9% | 48.5% | 45.4% | 48.2% |
| Higher after 20 sessions | 46.8% | 42.4% | 43.5% | 43.9% | 47.7% |
| 20 sessions: versus the average stock | +0.02% | +0.49% | −0.86% | +0.16% | −0.03% |
| 60 sessions: versus the average stock | −0.06% | +1.42% | −1.72% | +0.09% | +0.07% |
The 200-DMA columns start in Aug 2025, when enough history existed to calculate a 200-day average.
What the numbers say
- A bullish crossover on its own had no edge. Stocks were higher after 20 sessions 46.8% of the time, exactly the base rate, and matched the average stock.
- Bearish crossovers did not predict falls either. Stocks after a bearish cross did about as well as everything else.
- The 200-DMA mattered most as a filter to avoid. Bullish crosses below the 200-day average lagged the average stock by 0.86% over 20 sessions and 1.72% over 60. Those above it beat the average by 0.49% and 1.42%, but fewer than half were higher after 20 sessions: a handful of big winners lifted the average.
- High volume added almost nothing (+0.16% over 20 sessions).
- Whipsaws were common: 41% of bullish crosses crossed back within ten sessions.
- F&O stocks only (2,294 bullish crosses): 49.3% higher after 20 sessions, 0.14% behind the average stock. No edge there either.
What this means: treat a 9/21 crossover as a reason to look, not a reason to buy. Any profit comes from your chart reading, entry, stop and position size, and from cutting the many failed crosses quickly. The test uses today’s stock list, so stocks that were delisted earlier are missing; that usually makes results look slightly better than reality.
A tour of the scanner screen
Open the EMA crossover stocks scanner. At the top are the scan date and three tabs. Each tab shows a count that changes as you apply filters.

- 1Scan for: pick a scan date; the latest is first.
- 2Bullish crossover: 9 EMA crossed above the 21 EMA in the last 3 sessions.
- 3Crossed today: fresh bullish crosses on the scan day.
- 4Bearish crossover: 9 EMA crossed below the 21 EMA in the last 3 sessions.
For the scan of 17 Nov 2026, 96 stocks were on the bullish tab, 25 of them had crossed that day, and 86 were on the bearish tab. Out of 1,277 stocks scanned, 737 had the 9 EMA above the 21 EMA, so the short-term picture was mixed, leaning positive. Four sessions earlier, on 13 Nov, the bullish tab had 225 stocks and the bearish tab only 23: the counts can swing a lot in a few days.
The filters
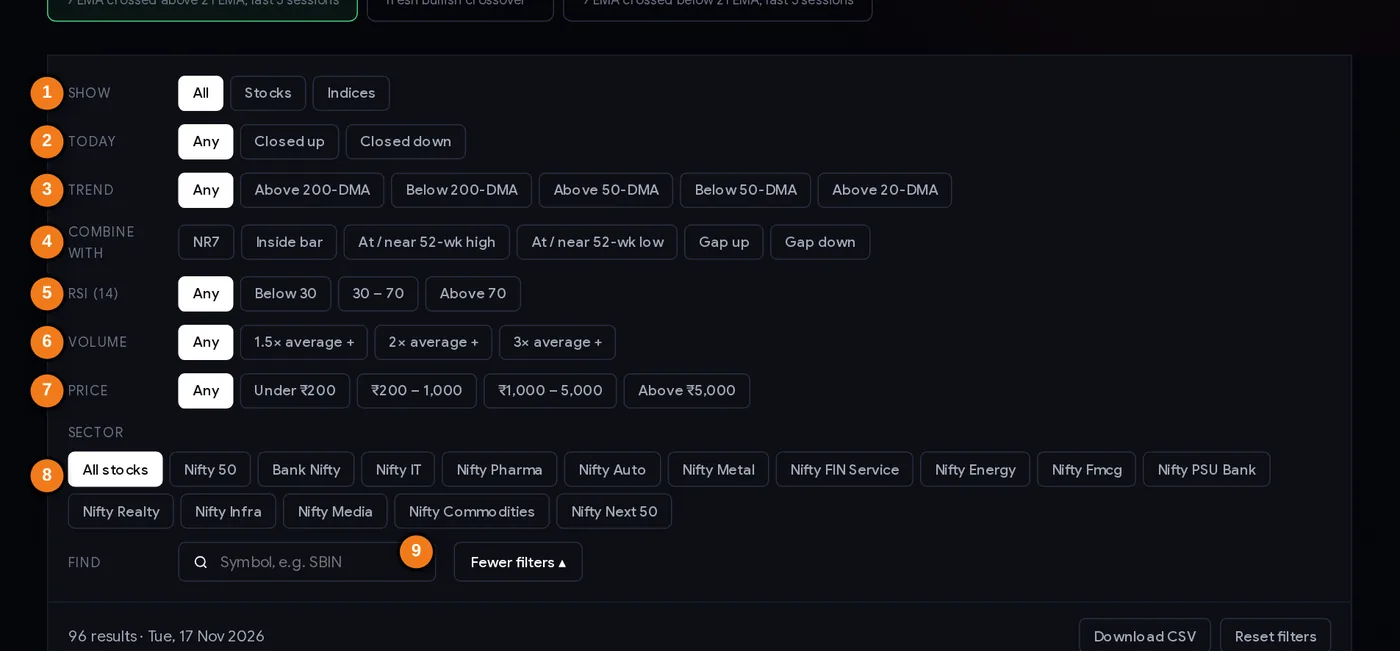
- 1Show: stocks only on this scanner
- 2Today: closed up or down
- 3Trend: versus the 200-, 50- or 20-day average
- 4Combine with another setup
- 5RSI (14) zone
- 6Volume versus the 20-day average
- 7Price band
- 8Sector (NSE index lists)
- 9Find a symbol
- Show: this scanner covers stocks only, so “Indices” gives an empty list.
- Today: keep stocks that closed up or down on the scan day.
- Trend: close above or below the 200-, 50- or 20-day average. Based on the test above, “Above 200-DMA” is the filter most worth using with bullish crosses.
- Combine with: NR7, inside bar, near a 52-week high or low, gap up or down.
- More filters: RSI zone, volume versus the 20-day average, price band and sector. The sector chips are NSE index lists (NIFTY 50, BANK NIFTY, NIFTY IT and so on), so smaller stocks that belong to none of them disappear when you pick a sector.
- Find a symbol. Your filters are saved in the page address, so you can bookmark a setup.
The results table
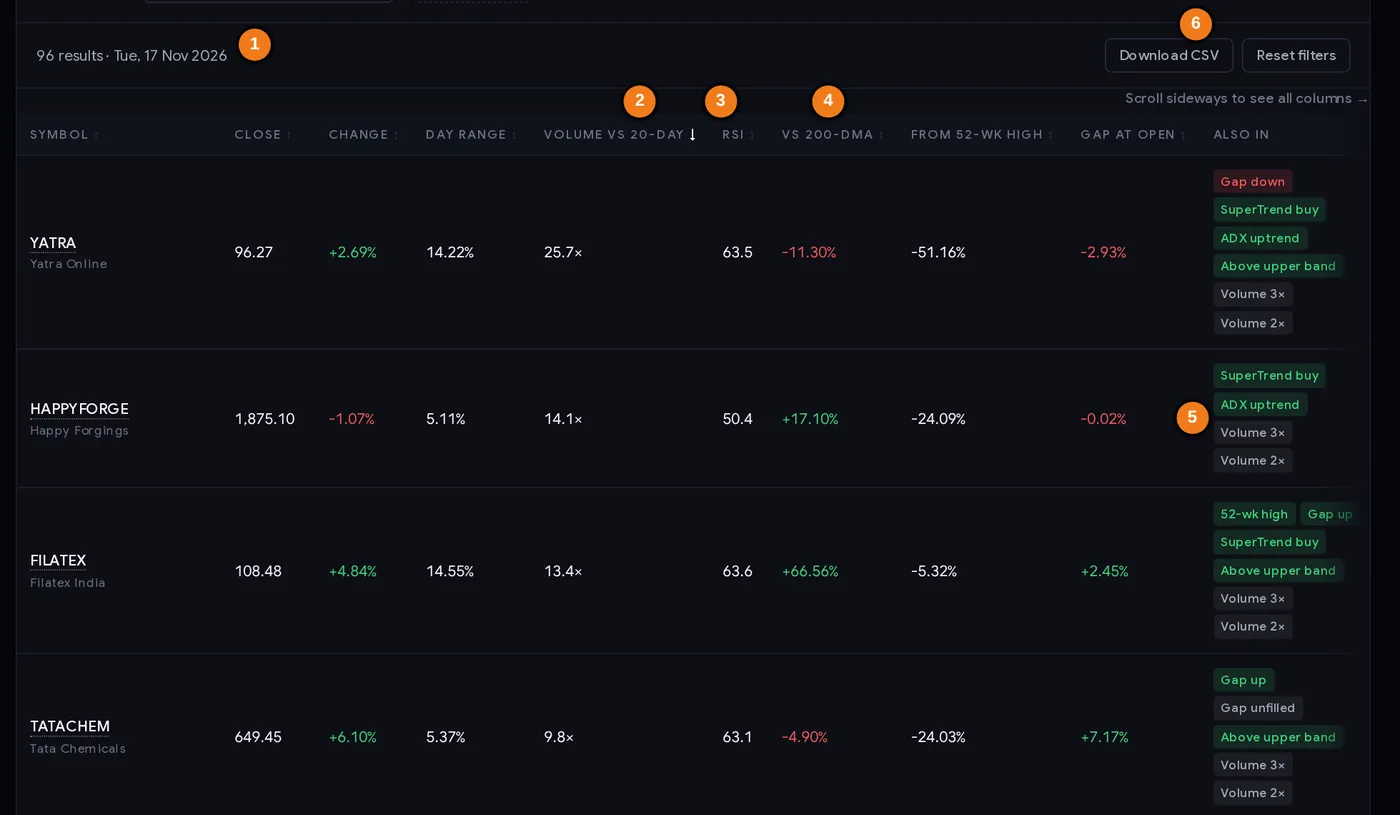
- 1Result count and scan date
- 2Volume versus the 20-day average (default sort)
- 3RSI (14)
- 4Distance from the 200-day average
- 5Other scans the stock matched that day
- 6Download the list as CSV
| Column | What it tells you |
|---|---|
| Symbol | The NSE symbol, with the company name in small text below it. |
| Close / Change | The closing price and % change on the scan day. |
| Day range | (High − Low) ÷ Close: how wide the day was. |
| Volume vs 20-day | The default sort, highest first. 2× means twice the usual shares traded. |
| RSI | 14-day RSI. Above 70 means the stock has already run hard. |
| vs 200-DMA | Distance from the 200-day average. Negative means the cross is happening inside a long-term downtrend. |
| From 52-wk high | How far below its one-year high the stock closed. |
| Gap at open | The opening gap versus the previous close. |
| Also in | Other scans the stock matched that day, such as MACD up, ADX uptrend, SuperTrend buy or Volume 3×. The tags are listed one under another, so a stock that matched many scans has a taller row. On 17 Nov 2026 Yatra Online, top of the bullish list at 25.7× its 20-day volume, also matched six other scans, including SuperTrend buy and ADX uptrend. |
When the hint “Scroll sideways to see all columns” appears above the table, scroll the table to the left to reach the last columns. The table does not show the EMA values themselves, and the Download CSV file does not include them either (it has the table columns, the 20-, 50- and 200-day averages and the flags). To see the lines, add EMA 9 and EMA 21 to your daily chart.
Read the volume column with care. On 13 Nov 2026 the top bullish name by volume was BF Utilities at 219 times its 20-day average, up 10.72%. In a thinly traded stock a modest burst of orders produces a huge multiple. Check the actual turnover and the price chart before reading much into it.
Step by step: an evening routine
- Open the scanner after about 8 PM IST on a trading day and check the scan date in the box.
- Read the tab counts. Hundreds of bullish crosses at once usually means the whole market turned; dozens of bearish ones, the opposite. A market-wide cross tells you more about the market than about any one stock.
- Set Trend to “Above 200-DMA” for bullish crosses (or “Below 200-DMA” if you are reviewing bearish ones). This was the only filter that clearly separated results in our test.
- Skip stocks with RSI above 70 unless you have a plan for a stretched entry, and check the volume against actual turnover.
- Open each chart with EMA 9 and EMA 21. Was the stock in a sideways range for weeks (whipsaw risk) or coming out of a clear decline? How far is the close from the lines?
- Check events on the results calendar and board meetings. A results day can reverse any crossover.
- Choose a stop before you choose a size. Then use the position size calculator so that one failed trade costs only a small, fixed part of your capital.
- Write down the exit rule, for example “exit if the 9 EMA closes back below the 21 EMA or the stop is hit, whichever comes first”.
Three playbooks
Playbook A: the trend-aligned cross
- Bullish crossover in the last three sessions, close above the 200-DMA, RSI under 70.
- Entry only if the next session trades above the crossover day’s high (this filters out crosses that stall at once).
- Stop below the most recent swing low on the chart, not at the EMA, because the EMAs are not support levels by themselves.
- Exit when the 9 EMA closes below the 21 EMA, or at the stop.
Playbook B: the pullback to the 21 EMA
Instead of buying the cross, wait. In a healthy short-term uptrend the price often dips back toward the 21 EMA while the 9 stays above it. A close that bounces off that zone gives an entry with a stop just below the dip, usually much closer than a stop measured from the crossover day. You will miss stocks that never pull back, and that is the price of a smaller risk per share.
Playbook C: the bearish cross as an exit rule
For stocks you already own, a 9/21 bearish crossover can be your signal to reduce or tighten the stop. In the cash market, ordinary investors cannot hold a short position overnight; shorting a stock beyond the day needs futures or options, which carry their own risks. For most readers the bearish tab is a list of holdings to review, not a list of stocks to short.
Risk first: if your stop is 6% away and you accept ₹1,000 of risk per trade, the position can be at most about ₹16,700. Whipsaws are frequent with this signal, so keep each loss small enough that a run of five in a row does not hurt.
Case studies from 2026
Prices in ₹ from NSE’s daily files, adjusted for splits and bonuses. Three come from the 13 Nov 2026 scan; the Infosys and Eternal cases show what followed earlier crosses.
1. Hitachi Energy India, 13 Nov 2026: a strong but stretched cross
The 9 EMA crossed above the 21 EMA on a 10.68% jump to ₹31,595, with 5.9× normal volume and an opening gap that never filled. The close was above the 200-DMA (₹29,954.46), 18.54% below the 52-week high, and SuperTrend also turned up. Everything looks strong, but after a 10% day a sensible stop sits far below the entry. That means a smaller position, or waiting for a pullback (Playbook B).
2. Siemens Energy India, 13 Nov 2026: right on the line
Another fresh cross, up 2.90% to ₹3,125.90 on 3.6× volume. But the close was a few rupees below the 200-DMA (₹3,134.34). The “Above 200-DMA” filter removes it. Borderline cases like this are common; decide your rule in advance rather than bending it for a stock you like.
3. Infosys, 2 Jun 2026: the high-volume cross that failed
Bullish crossover at ₹1,270.80 on 2.4× volume, but below the 200-DMA. The 9 EMA crossed back down within ten sessions, and on 1 Jul Infosys closed at ₹985.30, about 22.5% lower. Big volume did not protect the trade. A stop below the recent swing low would have limited the damage to a few per cent.
4. Eternal, 16 Jun 2026: the quiet cross that worked
Bullish crossover at ₹253.60 on only 0.66× normal volume, also below the 200-DMA. Twenty sessions later, on 15 Jul, it closed at ₹294.80 (+16.2%), and 60 sessions later it was 26.4% above the crossover close. By our filters this was a weak setup, and it worked anyway. Filters tilt the odds a little; they do not sort winners from losers in advance.
5. Bharat Dynamics, 12–13 Nov 2026: a bearish cross in a downtrend
The 9 EMA crossed below the 21 EMA on 12 Nov. On 13 Nov BDL closed at ₹1,030 (−2.38%), below its 200-DMA (₹1,260.34) and 36.94% below its 52-week high. For a holder, the cross added one more sign that the short-term trend had turned down; for everyone else it was a stock to leave alone until the trend changes.
Common mistakes
- Buying every bullish cross. In two years of data, bullish crosses did no better than the average stock.
- Ignoring the 200-DMA. Crosses below it lagged by 1.72% over 60 sessions in our test.
- Trusting a volume multiple without checking turnover. In an illiquid stock, a very high multiple can come from a modest amount of trading.
- Chasing a stretched close. When the close is already far above both lines, a normal pullback can hit your stop.
- Using the EMA as the stop. The lines move every day and are not support levels; pick a price level from the chart.
- Comparing different settings. Your 8/21 or SMA chart will not match a 9/21 EMA scan.
- Holding through results. A results gap can jump straight past your stop.
- Forgetting the market. When hundreds of stocks cross the same day, the market is doing the work, and it can turn back together too.
Pre-trade checklist
- Scan date is the latest trading day; tab counts noted (market-wide or stock-specific?).
- Crossover within three sessions and the 9 EMA still above the 21 EMA.
- Close above the 200-DMA for bullish ideas.
- RSI not already above 70; volume checked against real turnover.
- Chart checked: not a choppy range; close not far above the lines.
- Stop set at a chart level; position size worked out from that stop.
- No results, board meeting or other big event before the planned exit.
- Exit rule written: bearish cross or stop, whichever comes first.
Glossary
| EMA | Exponential moving average: an average of closes that weights recent days more. |
| SMA / DMA | Simple (daily) moving average: every day in the window counts equally. |
| Weight (k) | 2 ÷ (n + 1): the share of today’s close in the new EMA (20% for 9 days). |
| Bullish crossover | The fast EMA moving above the slow EMA. |
| Bearish crossover | The fast EMA moving below the slow EMA. |
| Whipsaw | A signal that reverses within days, typical of sideways markets. |
| 200-DMA | The 200-day simple average of closes, a long-term trend line. |
| Swing low | A recent low on the chart with higher lows on both sides; a common stop reference. |
| Base rate | How often something happens anyway, without any signal (here, 46.8% of stocks higher after 20 sessions). |
Questions
What is a 9/21 EMA crossover?
It is when the 9-day exponential moving average of closing prices crosses the 21-day EMA. Crossing above is called bullish (the short-term trend turned up); crossing below is bearish. ChartMine’s scanner lists NSE stocks with a 9/21 cross in the last three sessions.
Is the 9 and 21 EMA crossover strategy profitable?
Not on its own in our test. Across 13,592 bullish crosses on NSE stocks from Jan 2025 to Nov 2026, the stocks did about as well as the average stock, and 41% crossed back within ten sessions. Results depend on filters, stops and position size.
Which is better, EMA or SMA crossover?
An EMA reacts faster because it weights recent closes more, so its crosses come a little earlier. That is a difference in speed, not proven accuracy. Choose one and use it consistently.
What is the best EMA crossover for swing trading?
There is no single best pair. 9/21 is a common short-term choice; 20/50 is slower with fewer signals. Shorter pairs give earlier but noisier crosses.
Where should the stop loss be on an EMA crossover trade?
The EMAs move every day and are not support levels, so many traders place the stop below a recent swing low on the chart and size the position from that distance.
Does an EMA crossover work for intraday trading?
Traders use 9/21 on 5- or 15-minute charts, but the ChartMine scanner uses daily candles. Intraday crosses are faster and noisier; the same risk rules apply.
Why does my chart show a different crossover date?
Your chart may use other lengths, simple averages, or unadjusted prices. The scanner uses 9 and 21-day EMAs of NSE daily closes adjusted for splits and bonuses.