
☰ All tutorials
Start here
Tool tutorialsHow to trade with ChartMineStocks
Stock monitorMy watchlistStock scores & checklistMarket & sectors
Nifty 50Bank NiftySensexFin NiftyDaily market reportMarket breadthSector rotationSector heatmapStock screenerRelative strength (RS)MCX commodity pricesFear & Greed IndexWhat happens after…Scanners
Top gainers & losersStocks to watch tomorrowNR7 stocks scannerInside bar stocks52-week high stocksGap up & gap down stocksRSI oversold stocksGolden cross stocksSuperTrend buy stocksScan builderEMA 9/21 crossoverMACD crossoverADX strong trendBollinger breakout / squeezeVolume spike stocksOpen = high / open = lowCandlestick pattern scannerNarrow CPR scannerF&O data
F&O ban listOI build-upOption chainPCR & max painExpiry calendarF&O lot sizesOI build-up heatmapPCR trendMax pain trendFutures basisStock screens
Quarterly growersProfit growth stocksLow P/E stocksMutual fund buyingNear 52-week low, growingDebt-free companiesHigh ROE & ROCEMagic Formula stocksLow price-to-bookSmart money
FII / DII dataShareholding changesBig-money footprintShort selling dataF&O positions by participantBulk & block dealsPromoter buyingDelivery percentageCalendars
Results calendarQuarterly results trackerBoard meetingsCorporate actionsIPO calendarIPO performanceResearch & planning
Strategy testerCompare stocksDividend yield stocksASM / GSM listExpiry-day movesSeasonality & stock historyNSE holidays 2026Position size calculatorOption payoff calculatorPivot point calculatorMore
Stock scanners hubStock screensHow to use the Shareholding changes page
A plain-language guide to the quarterly shareholding pattern: who promoters, FIIs, DIIs and retail investors are, how ChartMine computes each change, how to read every part of the page, and what our own test of “follow the funds” found.
What the shareholding changes page shows, in plain words
Every company listed on NSE has owners. Some own a lot (the family or group that started the company), some are giant funds from India and abroad, and lakhs are ordinary people like you. Once every quarter, each company must publish a table that says who owns what percentage of its shares. This table is called the shareholding pattern.
One shareholding pattern on its own is a photo. Two photos, three months apart, tell a story: did foreign funds add to their stake or sell? Did mutual funds buy more? Did the promoters (the owners) reduce their holding? The Shareholding changes page lines up the latest two photos for every NSE company and shows the difference, so you can see in one place where big investors added or cut.
The changes are shown in percentage points (pts) of the company. If foreign investors owned 11.58% of a company in June and 12.04% in September, the page shows +0.46 pts. That is not “0.46% more shares”; it is 0.46 extra slices out of the 100 slices the company is cut into.
One line to remember: this page shows what large holders did over a whole quarter, weeks after it happened. It is a research starting point, not a buy or sell signal.
Who owns a listed company: the four groups you will see
The shareholding pattern splits owners into two big blocks, promoters and public, and the public block is split again. ChartMine reads the company’s filing and groups the owners like this:
| Group | Who they are | Why people watch them |
|---|---|---|
| Promoters and promoter group | The people or companies that control the business: the founding family, the parent company, their relatives and the firms they own. For example, the Kajaria family members and their family trusts are the promoters of Kajaria Ceramics. | They know the business best. A rising stake is read as confidence, a falling stake as a warning, though both have many innocent reasons (see below). |
| FII / FPI (foreign investors) | Foreign Portfolio Investors: overseas pension funds, mutual funds, hedge funds and banks registered with SEBI. ChartMine’s FII figure is the filing’s whole “Institutions (Foreign)” line, so it also includes foreign direct investors, foreign venture capital and sovereign wealth funds where a company has them. | They move large amounts of money and their buying or selling can move prices for weeks. |
| DIIs (domestic institutions) | Indian institutions. The page shows the biggest part separately: mutual funds (your SIP money is invested by them). Insurance companies such as LIC, banks, pension funds and alternative investment funds (AIFs) are the other DIIs; you see them on each stock’s own page. | Mutual funds research companies full time and SIP inflows give them steady money to invest. |
| Retail investors | Resident individuals: ordinary Indians holding shares in their own name. ChartMine adds both retail lines of the filing: holdings up to ₹2 lakh and above ₹2 lakh of nominal share capital. | A big jump in retail holding while institutions sell is often a sign that professionals are handing shares to the public. |
A detail that surprises people. “Nominal share capital” means the face value of the shares (often ₹1, ₹2 or ₹10 each), not their market value. A person holding 10,000 shares of ₹2 face value has ₹20,000 of nominal capital, even if the shares are worth ₹50 lakh in the market. So the “up to ₹2 lakh” line contains many wealthy investors too. ChartMine adds both lines together and calls the total “retail”.
Whatever is left (companies holding shares, NRIs, trusts, the IEPF and so on) is shown as “Others” on the stock page. Promoters in India can usually own at most 75% of a listed company, because the listing rules require at least 25% to be held by the public (newly listed companies, especially very large ones, are given time to get there) (the minimum public shareholding rule).
The quarterly shareholding pattern: where the numbers come from
Under SEBI’s listing rules (LODR Regulation 31), every listed company files its shareholding pattern with the exchanges within 21 days of the end of each quarter: 30 June, 30 September, 31 December and 31 March. Companies also file an extra pattern in between after big events such as a preferential allotment or a merger.
How ChartMine builds the page
- Every night a script reads each company’s filings from NSE (the machine-readable XBRL file behind the shareholding pattern) and stores the last five patterns.
- For each company it takes the latest filing and the previous quarter-end filing. Mid-quarter filings are never used as the base, and a pair more than about 200 days apart is skipped.
- It works out each group’s holding (promoters, FII, mutual funds, insurance, other DIIs, retail) and subtracts: latest minus previous, in percentage points.
- Counts at the top use a tiny threshold (a change of more than 0.005 pts) so rounding noise does not count as buying or selling.
The quarter season matters
On 9 Nov 2026 the page compared Q2 FY27 filings (30 Sep 2026) with 30 Jun 2026. 1,362 companies had filed; the table also kept 31 companies whose latest filing was for another date. One of these is Jio Financial Services, which filed an extra pattern dated 30 Oct 2026 after allotting new shares to two promoter companies: promoter holding went from 49.13% to 50.98%. So read the “Quarter” column before comparing two rows.
Early in a filing season (the first three weeks after a quarter ends) the page is a mix: some companies show the new quarter, others still show the old comparison. The counts at the top grow day by day until about the 21st.
Pledging: what it is and why it is not on this page
Promoters sometimes pledge their shares: they give them to a lender as security for a loan. If the share price falls a lot, the lender can sell the pledged shares, which pushes the price down further. Promoters must disclose pledges (SAST Regulation 31) and the shareholding pattern has a pledged column. ChartMine does not show pledged shares yet; check the company’s shareholding pattern on NSE if pledging matters to you.
Why investors watch shareholding changes: advantages and limits
✅ Every company in one view
Reading 1,300+ filings by hand is impossible. The page ranks the biggest FII, mutual fund, promoter and retail changes and lets you filter the rest.
✅ Who is on the other side
Seeing all four groups together tells you who sold to whom: a promoter sale bought by funds reads very differently from a fund exit bought by retail.
✅ Official data
It comes from the company’s own filing with NSE, not from news or rumours.
✅ Research ideas
A company where both FIIs and mutual funds raised their stake is worth reading about. The page gives you the shortlist; you do the homework.
The limits (please read this part)
We tested the idea directly on ChartMine’s data. For three quarters we took every company’s change (Sep 2025 → Dec 2025, Dec 2025 → Mar 2026, Mar 2026 → Jun 2026), assumed you could act 22 days after quarter end (when nearly all filings are in), and measured the next 63 trading sessions (about three months) of price return. We kept only stocks with at least ₹50 lakh of turnover that day: 1,058 to 1,327 stocks a quarter. Each group is compared with the median return of all those stocks.
| Group (change in the quarter) | Jan–Apr 2026 | Apr–Jul 2026 | Jul–Oct 2026 |
|---|---|---|---|
| All stocks: median 3-month return | +3.6% | +2.1% | −8.6% |
| FII stake up 0.5 pts or more | −0.3 pts vs all (113 stocks) | −4.2 pts (163) | +1.0 pts (230) |
| Mutual fund stake up 0.5 pts or more | −2.4 pts (193) | +0.4 pts (247) | +0.8 pts (257) |
| FIIs and MFs both raised (any amount) | −1.9 pts (130) | −3.0 pts (173) | 0.0 pts (184) |
| Both raised by 0.5 pts or more | −6.4 pts (18) | +1.3 pts (17) | +6.1 pts (47) |
| Promoter stake up 0.5 pts or more | +1.4 pts (22) | +1.1 pts (41) | +2.9 pts (43) |
| Retail stake up 1 pt or more | +2.1 pts (104) | −3.3 pts (112) | −2.7 pts (204) |
What this means in plain words:
- FII or mutual fund buying alone did not lead to better returns in these three quarters. The popular “FIIs and MFs both buying” list did worse than the average stock in two of three quarters and level in the third.
- Large combined buying (both ≥ 0.5 pts) swung from clearly worse to clearly better. With only 17 to 47 stocks a quarter, that is too few and too inconsistent to rely on.
- Promoter increases did slightly better in all three quarters (median 1 to 3 points above the market; 55–60% of them beat the median stock). The groups are small (22 to 43 stocks), so treat it as a hint, not proof.
- Retail piling in was more often a bad sign (two quarters of three), which fits the idea that rising retail ownership often means professionals are selling.
Why the data is late. A pattern dated 30 September describes holdings on that day, built up by trades from July to September, and you see it in October. By then the price may already reflect the buying. Use the page to find companies to study, then judge the business, the price and your risk yourself.
A tour of the page
Open Shareholding changes. From top to bottom: four headline counts, the biggest movers, FIIs and MFs buying together, a sector view, and the full table.

- 1Companies where foreign investors raised / cut their stake.
- 2The same for mutual funds.
- 3The same for promoters.
- 4Companies where FIIs and mutual funds both raised their stake.
- 5Which quarters are compared and how many companies have filed so far.
The counts tell you the mood of the quarter. In Q2 FY27 foreign investors raised their stake in 639 companies and cut it in 697, while mutual funds raised in 498 and cut in 450: domestic funds were slightly net buyers across companies, foreign funds slightly net sellers. Promoters raised in only 120 and cut in 325. Remember these are counts of companies, not rupees.
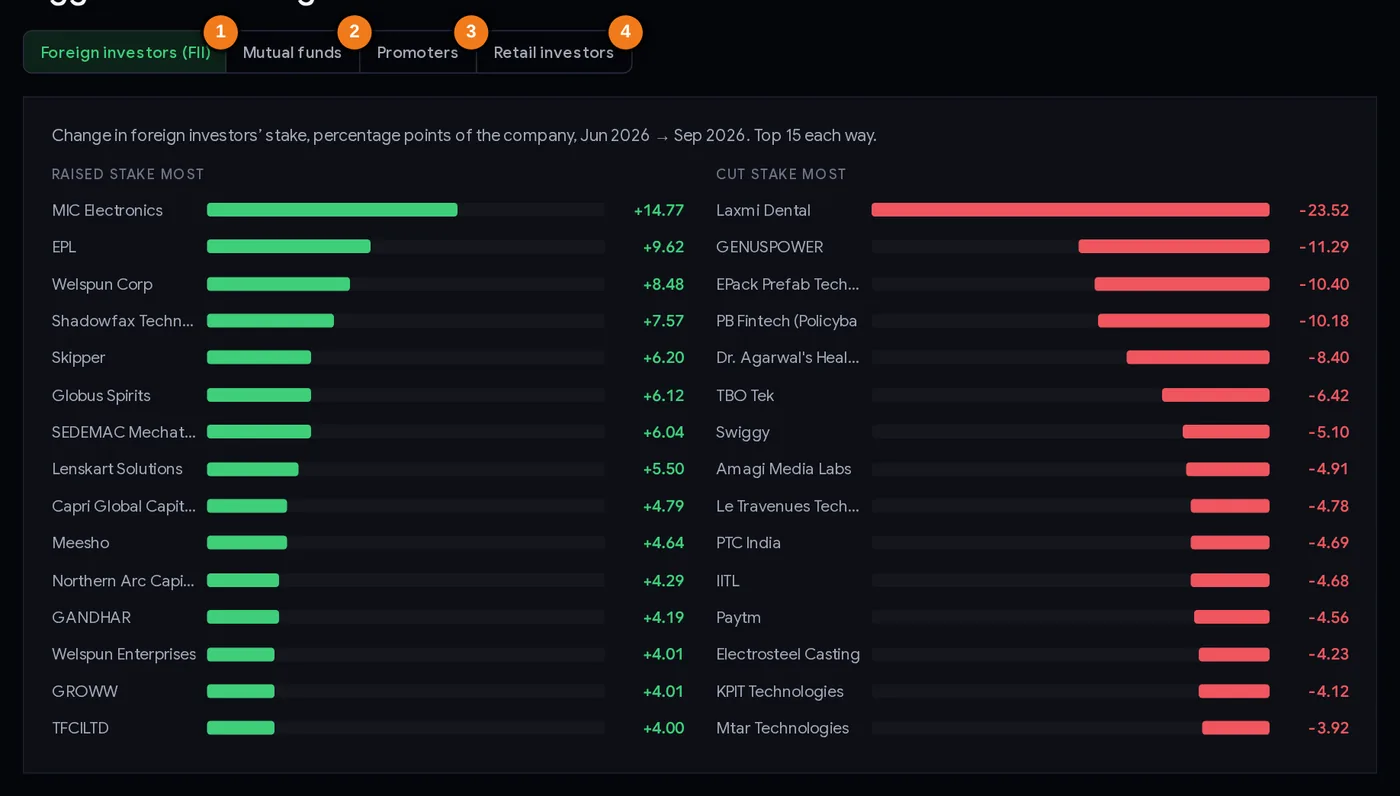
- 1Foreign investors (FII)
- 2Mutual funds
- 3Promoters
- 4Retail investors
Biggest stake changes
Pick a group with the four buttons. The left list shows the 15 companies where that group raised its stake most; the right list shows the 15 biggest cuts. Tap a name to open the stock’s page, where the full holding and the promoter holding over time are shown.
The biggest numbers are almost never ordinary market buying. They come from IPO lock-ins ending, promoters exiting, open offers, mergers and share allotments. Always ask “who was on the other side?” (case studies below).
FIIs and mutual funds buying the same stock
Companies where both foreign investors and mutual funds raised their stake in the same quarter, ranked by the combined increase. 204 companies in Q2 FY27; the page lists the top 24.
By sector
The average change in FII holding per company in each sector, with how many companies saw an increase. In Q2 FY27, pharma and healthcare led (+0.47 pts on average, 38 of 64 companies up) and media was weakest (−0.68 pts, 1 of 6 up). The table under the bars adds mutual fund and promoter averages.
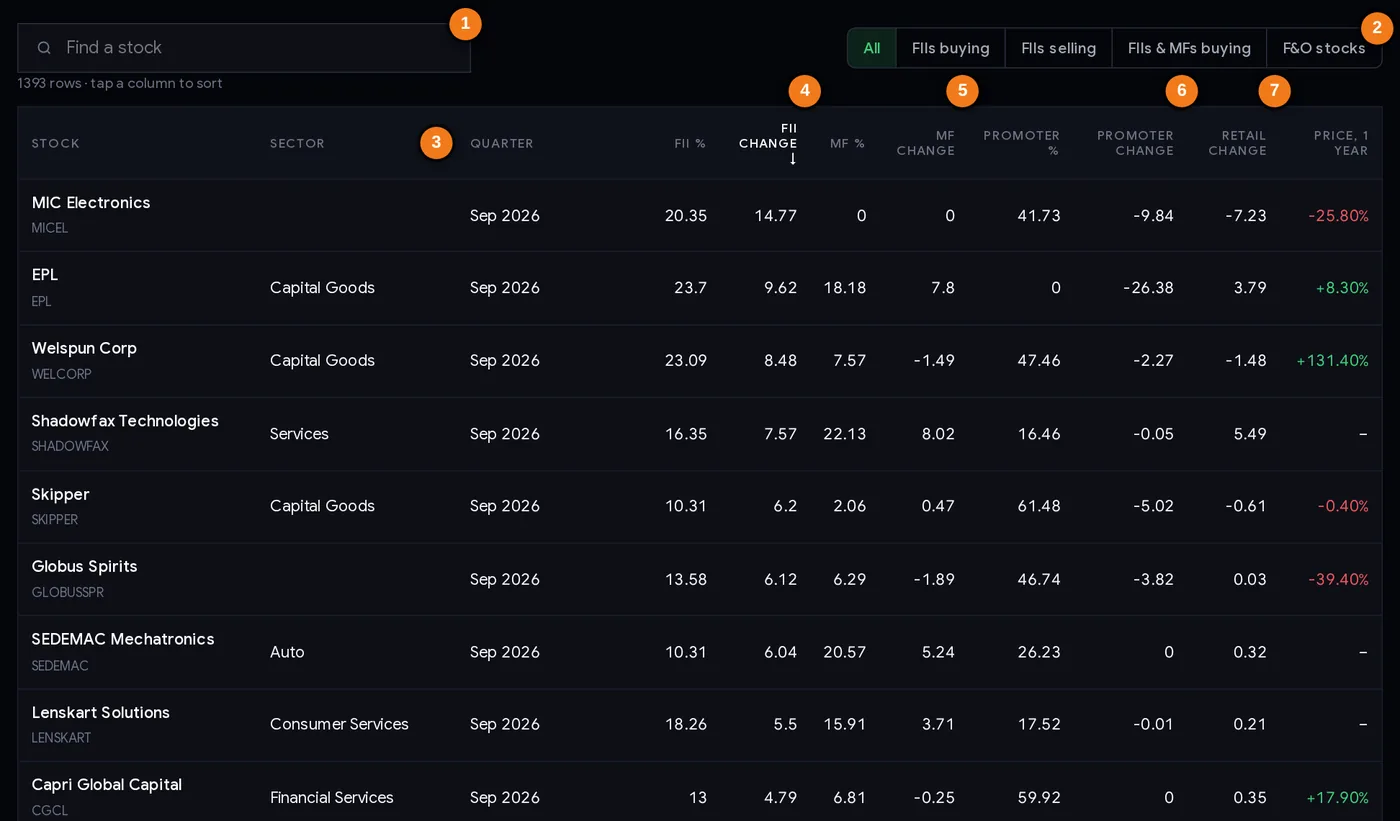
- 1Find a stock
- 2Filters: All, FIIs buying, FIIs selling, FIIs & MFs buying, F&O stocks
- 3Quarter of the latest filing used
- 4FII change (points)
- 5Mutual fund change
- 6Promoter change
- 7Retail change
The full table, column by column
| Column / control | What it tells you |
|---|---|
| Find a stock | Type a name or symbol to jump to it. |
| Filter buttons | All, FIIs buying, FIIs selling, FIIs & MFs buying, F&O stocks only. |
| Stock / Sector | The company and its sector. Click the name for its page. |
| Quarter | The date of the latest filing used (for example Sep 2026, or Oct 2026 for a mid-quarter filing). |
| FII % / FII change | Foreign investors’ holding now and the change in points since the previous quarter end. |
| MF % / MF change | The same for mutual funds. |
| Promoter % / Promoter change | Promoter and promoter-group holding and its change. |
| Retail change | Change in resident individuals’ holding. |
| Price, 1 year | The stock’s return over the last year, so you can see whether the buying came after a big rise or fall. |
Click any column header to sort by it. The table is sorted by FII change, largest first, when you open it.
Step by step: a 20-minute quarterly routine
- Wait for the season to fill in. Check the line under the counts: how many companies have filed and for which quarter. After about the 22nd of January, April, July and October nearly all are in.
- Read the headline counts. Are FIIs and mutual funds net raisers or cutters across companies? It tells you the backdrop, not what to do.
- Scan the four “biggest changes” lists. For each big number, look at the other three groups for the same stock. A +9 pts FII change with −26 pts promoter change is a promoter exit, not FII “conviction”.
- Filter the table to stocks you own or follow. Use Find. Note any company where promoters cut or retail jumped sharply.
- Open the stock page. Check the promoter holding over time, the results trend and the timeline (deals and promoter filings). Many quarterly changes were already visible weeks earlier as bulk and block deals or promoter (SAST) filings.
- Read the company’s announcements for anything big: an open offer, a merger, an allotment, a buyback, an IPO lock-in ending.
- Write down your conclusion in one line per stock (“funds absorbed promoter exit”, “promoter crept up 1 pt via open market”). Next quarter, check whether it continued.
Three ways investors use it
Playbook A: the research shortlist
Filter to FIIs & MFs buying and sort by MF change. From the top 20, keep companies whose profits are growing (see quarterly results) and whose price is not already far above its averages. Read the annual report and results call before you consider anything. Our test shows the list itself has no edge; your homework is what adds value.
Playbook B: the holdings health check
Every quarter, look up each stock you own. Red flags worth a closer look: promoters cutting for two quarters in a row, mutual funds cutting while retail rises, or a sudden FII exit. None of these is a reason to sell by itself; each is a reason to find out why.
Playbook C: follow the promoter
Filter by the Promoters tab and look at the raises that are not explained by an allotment, merger or open offer. Then confirm in the promoter buying (SAST) page whether the promoter actually bought on the open market. In our three-quarter test, promoter raises of 0.5 pts or more did slightly better than the market each time, on small samples.
Risk first. Shareholding data is about investing over months. If you act on it, decide in advance how much of your capital one idea can take, where you would accept you were wrong, and use the position size calculator.
Case studies from the Sep 2026 quarter
Four real examples from the Q2 FY27 filings (30 Jun 2026 → 30 Sep 2026), chosen to show how to read the four groups together. Holdings from the companies’ NSE filings; prices are NSE closing prices in ₹.
1. EPL: the “FII and MF favourite” that was a promoter exit
EPL topped the “FIIs and MFs both buying” list: foreign investors went from 14.08% to 23.70% (+9.62 pts) and mutual funds from 10.38% to 18.18% (+7.80 pts). The same filing shows why: promoter holding fell from 26.38% to 0%. The promoter sold its whole stake and funds bought it. The share price was ₹224.80 on 30 Jun and ₹237.00 on 30 Sep; by 6 Nov 2026 it was ₹221.31. Lesson: the biggest “buying” numbers are often one group handing shares to another. That is a change of owner, not necessarily a vote of confidence.
2. Electrosteel Castings: a quarterly change you could see weeks earlier
Promoters went from 50.13% to 54.53% (+4.40 pts) and foreign investors from 12.80% to 8.57% (−4.23 pts). The SAST filings had already told the story: on 28 Sep 2026 Belgrave Investment Fund sold 2.89 crore shares (4.68%) on the open market, and over 28–29 Sep the promoter company Wilcox Merchants with persons acting in concert bought 3.09 crore shares (5.0%). Volume shows it: 1.97 crore shares on 28 Sep and 2.62 crore on 29 Sep, against 7.57 lakh on 25 Sep. The filings do not name the counterparty, but the numbers fit. The stock closed at ₹76.53 on 29 Sep and ₹68.80 on 6 Nov (−10.1%). Lesson: the quarterly pattern is a summary; the trades show up first in SAST filings and deals. And a promoter buying 5% did not stop the price falling afterwards.
3. Restaurant Brands Asia: a +32 point “promoter raise” that was not market buying
Promoter holding jumped from 9.22% to 41.73% (+32.51 pts), the biggest promoter increase of the quarter. At the same time “bodies corporate” (companies holding shares) fell from 22.70% to 3.88%, mutual funds from 22.23% to 15.36% and insurance companies from 7.26% to 5.32%. A change this large comes from a change in control (an open offer, a share purchase agreement or a reclassification), not from a promoter quietly buying on the exchange. The pattern alone cannot tell you which; the company’s announcements can. Price: ₹79.18 on 30 Jun, ₹91.58 on 30 Sep, ₹88.62 on 6 Nov. Lesson: check the reason before you read a big promoter number as a signal.
4. Kajaria Ceramics: promoter cut while a promoter bought
The page shows promoters cutting by 0.95 pts (47.69% → 46.74%). Yet a promoter, Rishi Kajaria, disclosed buying 1.80 lakh shares on the open market on 29–30 Sep. The filings explain the gap: the company’s total share count fell from 15,92,72,290 to 15,71,43,050, and the promoter group’s shares fell from 7,59,55,231 to 7,34,55,231. The small open-market purchase was outweighed by a 25 lakh share fall elsewhere in the group. Lesson: a percentage can move because the number of shares changed, and one family member’s trade is not the whole group. See the promoter buying tutorial for more on this case.
Common mistakes
- Treating “FII buying” as a buy signal. In our test, the FII-buying group did not beat the market over the next three months.
- Ignoring the other side of the trade. Every share bought was sold by someone. Read all four groups (case 1).
- Reading percentages as rupees. +0.5 pts in a ₹500 crore company and in a ₹5 lakh crore company are very different sums of money.
- Forgetting the date. The holding is as of the quarter end and you see it up to three weeks later. Check the Quarter column too: mid-quarter filings exist.
- Missing corporate events. Allotments, buybacks, mergers, open offers and IPO lock-in expiry all change percentages without anyone “buying” on the market (cases 3 and 4).
- Assuming “retail” means small investors only. The retail line counts face value, so many wealthy individuals sit in it.
- Acting on one quarter. A trend over two or three quarters says more than a single change.
Checklist before you act on a shareholding change
- The latest filing is for the quarter you think (check the Quarter column and the season line at the top).
- You looked at all four groups for the stock and know who sold to whom.
- No allotment, buyback, merger, open offer or IPO lock-in expiry explains the change.
- You checked SAST filings and bulk/block deals for the same company.
- The business itself (results, debt, valuation) supports your idea.
- The price has not already run far ahead (check the 1-year column and the chart).
- Position size and the point where you would exit are decided in advance.
Glossary
| Shareholding pattern | The quarterly table of who owns a listed company, filed with the exchanges within 21 days of quarter end. |
| Promoter / promoter group | The people and companies in control of the business, with their relatives and the firms they control. |
| FII / FPI | Foreign institutional / portfolio investor: an overseas fund registered with SEBI. ChartMine’s FII figure is all foreign institutions. |
| DII | Domestic institutional investor: mutual funds, insurers, banks, pension funds, AIFs. |
| Retail | Resident individuals, both nominal-capital buckets (up to and above ₹2 lakh). |
| Percentage points (pts) | The difference between two percentages: 11.58% to 12.04% is +0.46 pts. |
| Minimum public shareholding | The listing rule that at least 25% of a listed company must be held by the public, so promoters can usually own at most 75% (new listings get time to comply). |
| Pledge | Shares given to a lender as security for a loan; the lender can sell them if the price falls. |
| Preferential allotment | New shares issued to chosen investors (sometimes the promoters) at a set price. It raises their percentage without market buying. |
| SAST filing | A disclosure under SEBI’s takeover rules when a large holder or promoter buys or sells; see the promoter buying page. |
Questions
How can I see which stocks FIIs bought last quarter?
Open ChartMine’s Shareholding changes page and pick ‘Foreign investors (FII)’ in the Biggest stake changes chart, or filter the table to ‘FIIs buying’. It compares each company’s latest quarterly shareholding filing with the previous quarter end.
Does FII or mutual fund buying mean a stock will go up?
No. In ChartMine’s test over three quarters of 2026, stocks where FIIs or mutual funds raised their stake did not beat the average stock over the next three months. The data is also weeks old when published. Use it to find companies to research.
What does a change of +0.50 pts mean?
That the group owns half a percentage point more of the company than at the previous quarter end, for example 10.00% rising to 10.50%. It is a share of the company, not a rupee amount.
Why did promoter holding fall when a promoter bought shares?
Because the percentage depends on the whole promoter group and on the total number of shares. Another member may have sold or tendered shares, or the share count may have changed. Kajaria Ceramics in the Sep 2026 quarter is an example.