
☰ All tutorials
Start here
Tool tutorialsHow to trade with ChartMineStocks
Stock monitorMy watchlistStock scores & checklistMarket & sectors
Nifty 50Bank NiftySensexFin NiftyDaily market reportMarket breadthSector rotationSector heatmapStock screenerRelative strength (RS)MCX commodity pricesFear & Greed IndexWhat happens after…Scanners
Top gainers & losersStocks to watch tomorrowNR7 stocks scannerInside bar stocks52-week high stocksGap up & gap down stocksRSI oversold stocksGolden cross stocksSuperTrend buy stocksScan builderEMA 9/21 crossoverMACD crossoverADX strong trendBollinger breakout / squeezeVolume spike stocksOpen = high / open = lowCandlestick pattern scannerNarrow CPR scannerF&O data
F&O ban listOI build-upOption chainPCR & max painExpiry calendarF&O lot sizesOI build-up heatmapPCR trendMax pain trendFutures basisStock screens
Quarterly growersProfit growth stocksLow P/E stocksMutual fund buyingNear 52-week low, growingDebt-free companiesHigh ROE & ROCEMagic Formula stocksLow price-to-bookSmart money
FII / DII dataShareholding changesBig-money footprintShort selling dataF&O positions by participantBulk & block dealsPromoter buyingDelivery percentageCalendars
Results calendarQuarterly results trackerBoard meetingsCorporate actionsIPO calendarIPO performanceResearch & planning
Strategy testerCompare stocksDividend yield stocksASM / GSM listExpiry-day movesSeasonality & stock historyNSE holidays 2026Position size calculatorOption payoff calculatorPivot point calculatorMore
Stock scanners hubStock screensHow to use the PCR trend tool
A plain-language tutorial on the put-call ratio: how it is calculated, the different ways traders read it, what the history since July 2024 says about extreme readings, how to read every part of the page, and real case studies.
What the PCR is, in plain words
Options come in two kinds. A call option gains when the price goes up. A put option gains when the price goes down. Every open option has two sides: a buyer and a seller (also called a writer).
The put-call ratio (PCR) compares the two. ChartMine uses the open-interest version:
PCR = total open interest of all puts ÷ total open interest of all calls
Open interest (OI) means the number of option contracts that are still open at the end of the day: positions that were opened and not yet closed. So a PCR of 1.47 means that for every 100 calls still open, 147 puts are open.
A single day’s PCR is just a number. What makes it useful is context: is today’s reading high or low compared with the past? Is it rising or falling? How has the index behaved when PCR was this extreme before? The PCR trend page answers those three questions for NIFTY 50, BANK NIFTY, FINNIFTY and MIDCAP NIFTY since July 2024, and ranks every F&O stock by how unusual its own PCR is today.
One line to remember: PCR describes how option traders are positioned. It does not say which way the price will go next, and our own numbers below show why.
How the number is built (a real example)
You never need to calculate PCR yourself, but seeing the arithmetic once makes it feel less mysterious. These are NSE’s end-of-day figures for NIFTY 50 on Friday 6 Nov 2026, the data the page showed on 9 Nov 2026.
| Item | Open interest (units) |
|---|---|
| Put OI, all expiries | 41,40,73,030 |
| Call OI, all expiries | 28,15,71,440 |
| PCR, all expiries | 41,40,73,030 ÷ 28,15,71,440 = 1.47 |
| Put OI, nearest expiry (9 Nov) | 24,02,03,665 |
| Call OI, nearest expiry | 14,53,32,135 |
| PCR, nearest expiry | 1.65 |
That day NIFTY closed at 25,030. The all-expiry PCR of 1.47 was higher than on 99% of days since July 2024; the average over that period is 0.97 and the full range 0.55 to 1.50.
Two versions of PCR on the page
- All expiries (green line): every open put and call, whatever the expiry date. Smoother. Best for the bigger picture.
- Nearest expiry (orange line): only the contracts that expire next. It swings much more, because it is dominated by short-term traders and it resets every week when a new expiry becomes the nearest one.
For stocks, the table uses the all-expiries PCR and compares it with the stock’s own last 250 sessions (about one year).
How traders read PCR: the three common views
Traders disagree about what a high or low PCR means. That disagreement is itself a warning. Here are the three common readings, side by side.
| Reading | High PCR (more puts) | Low PCR (more calls) |
|---|---|---|
| Writer view (common in India) | Big players mostly sell index options. Lots of open puts = lots of put writers who expect the market to stay above their strikes = support below. | Many call writers = a ceiling above. |
| Contrarian view | Everyone has bought protection; the fear is already in the price, so the market can rise. | Everyone is bullish and complacent; risk of a fall. |
| Hedging view | Funds are buying puts to protect their stock portfolios. Says little about direction. | Little hedging demand. |
All three can be true at the same time for different traders, and the OI number alone cannot tell you who bought and who sold. That is why ChartMine shows PCR next to the index and with history, instead of turning it into a buy or sell label.
What counts as “high” or “low”?
There is no fixed number. Each index has its own normal range. On the page, the extremes are defined from the index’s own history since July 2024:
| Index | Average PCR | Top 10% starts at | Bottom 10% ends at | Today (6 Nov 2026) |
|---|---|---|---|---|
| NIFTY 50 | 0.97 | 1.24 | 0.74 | 1.47 (99th percentile) |
| BANK NIFTY | 0.91 | 1.12 | 0.71 | 1.23 (98th) |
| FINNIFTY | 0.81 | 1.08 | 0.58 | 1.05 (87th) |
| MIDCAP NIFTY | 0.98 | 1.20 | 0.75 | 1.07 (72nd) |
Notice that a PCR of 1.05 is “very high” for FINNIFTY but only a little above average for MIDCAP NIFTY. Always compare an index with itself.
Why watch PCR: advantages and limits
✅ A view of positioning
Price shows what happened. PCR shows how option traders are set up for what happens next: heavily hedged, heavily short puts, or call-heavy.
✅ Context in one glance
“Higher than 99% of days” tells you far more than “1.47”. The page does that ranking for you, for the indices and for every F&O stock.
✅ Finds unusual stocks
The stock table ranks 205 F&O stocks by where today’s PCR sits in their own year, so a sudden change in one stock stands out.
✅ Free, daily, from NSE
Built every trading evening from NSE’s end-of-day F&O file, so everyone sees the same numbers.
The limits (please read this part)
The page tests itself. For each index it asks: when PCR was in its top 10% or bottom 10%, what did the index do over the next five sessions? Here is NIFTY 50, July 2024 to November 2026:
| When NIFTY PCR was… | Days | Average move, next 5 sessions | Higher after 5 sessions |
|---|---|---|---|
| In its top 10% (1.24 or more) | 58 | +0.24% | 53% |
| In its bottom 10% (0.74 or less) | 58 | +0.11% | 55% |
| Any day | 575 | +0.01% | 48% |
In plain words:
- Extreme PCR was close to a coin toss. 53% and 55% “higher after five sessions” is barely different from 48% on any day.
- High and low PCR gave almost the same result. If high PCR were bullish and low PCR bearish, the two rows would point in opposite directions. They do not.
- The sample is small. 58 days from one market phase. BANK NIFTY, FINNIFTY and MIDCAP NIFTY show similar, mixed results (for example MIDCAP NIFTY rose 60% of the time after a low PCR).
- PCR is noisy around expiry. In October 2026 the NIFTY all-expiry PCR jumped between about 0.73 and 1.27 from one day to the next as weekly contracts expired and new ones opened.
So how should you use it? As background, not as a trigger. A very high or very low PCR is a reason to look closer (at price, at the option chain, at news), never a reason on its own to buy or sell.
A tour of the PCR trend page
Open the PCR trend page. It has three parts: the index panel (cards and chart), the “what happened after extreme readings” study, and the stock table.
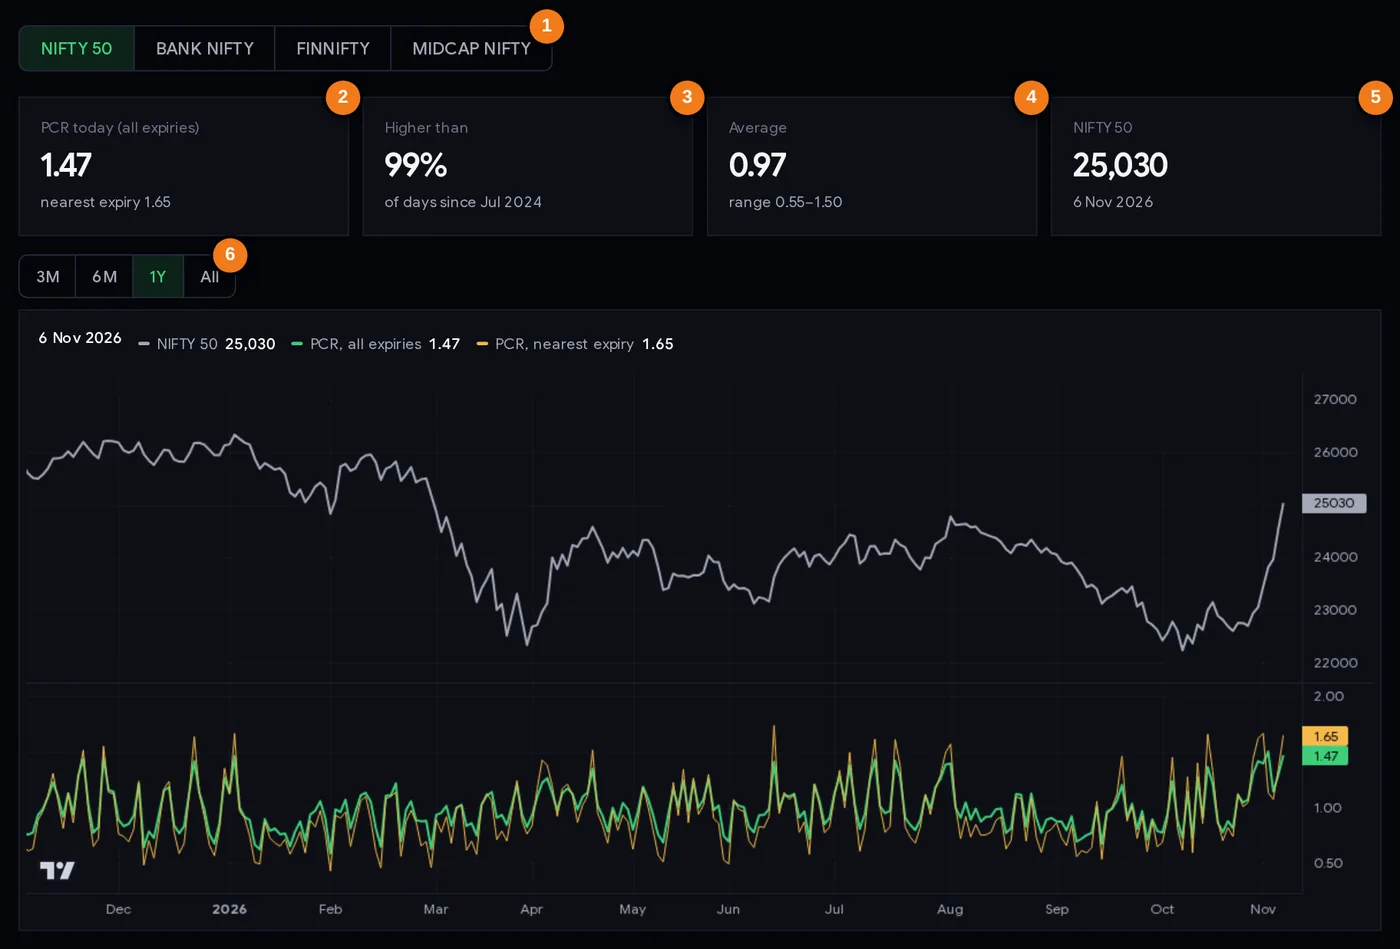
- 1Index tabs: NIFTY 50, BANK NIFTY, FINNIFTY, MIDCAP NIFTY.
- 2Today’s PCR across all expiries, and for the nearest expiry.
- 3How unusual today’s PCR is: higher than this share of days since July 2024.
- 4Average PCR and its full range over the same period.
- 5The index close and the data date.
- 6Chart range: 3 months, 6 months, 1 year or all.
The chart has two panes. The top pane is the index price. The bottom pane is PCR: green for all expiries, orange for the nearest expiry. Move your mouse (or finger) over the chart and the legend at the top shows that day’s values. The range buttons (3M, 6M, 1Y, All) zoom in and out.
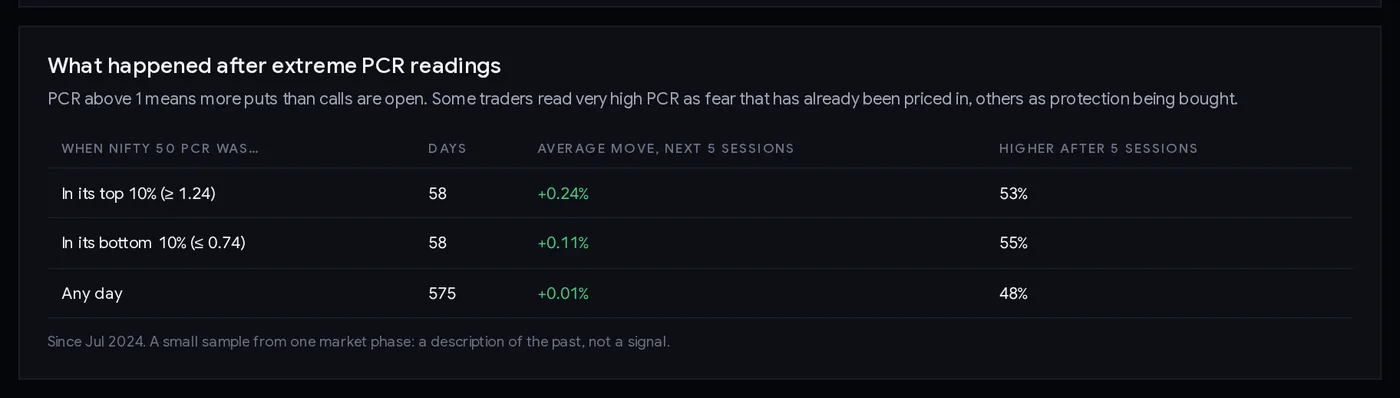
This box is the page’s own honesty check, explained in the section above. Each index tab has its own version.
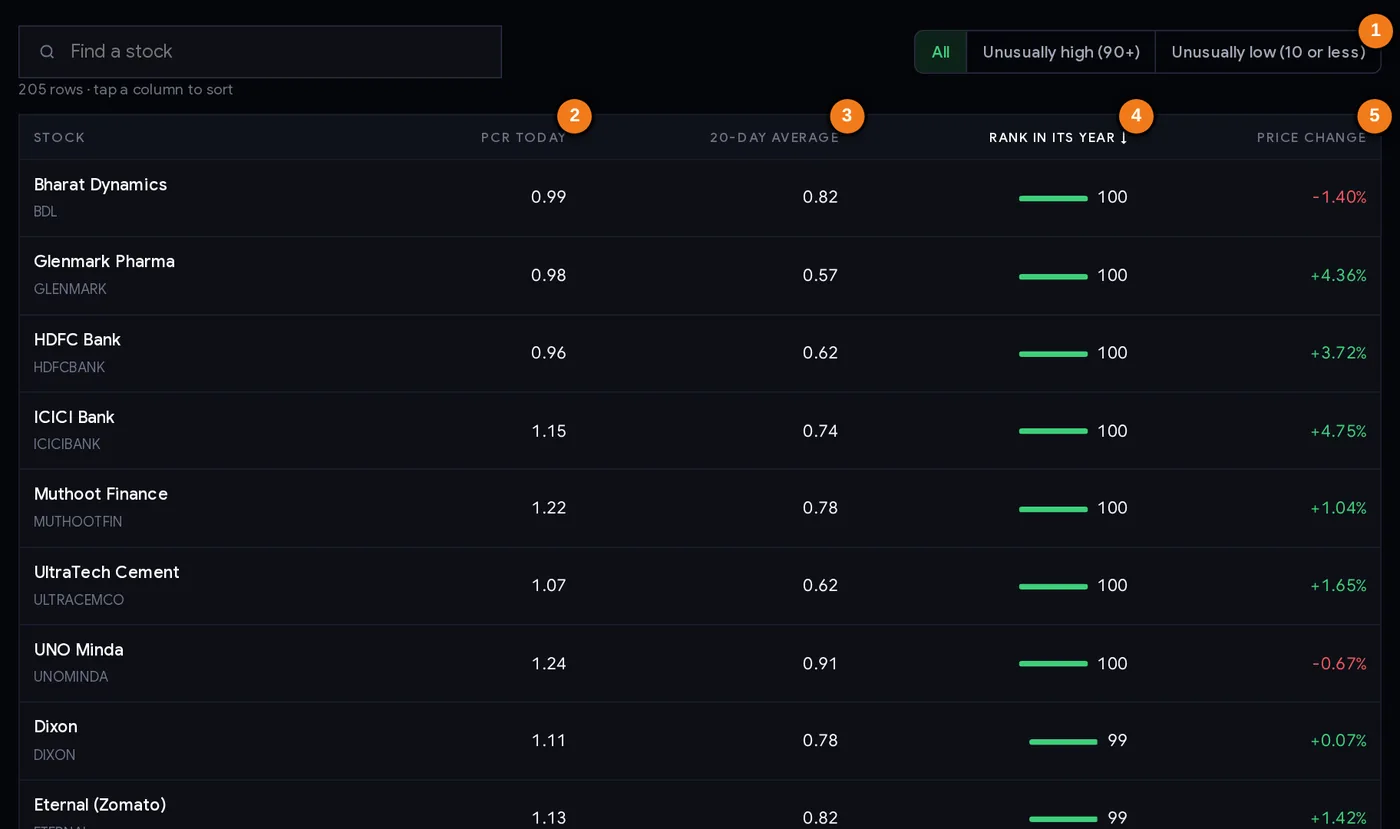
- 1Filters: all stocks, unusually high or unusually low PCR.
- 2PCR today, all expiries.
- 320-day average PCR.
- 4Rank of today’s PCR in the stock’s last year (0 to 100).
- 5Today’s price change.
Every column explained
| Column / control | What it tells you |
|---|---|
| Find a stock | Type a name or symbol to filter the table. |
| All / Unusually high (90+) / Unusually low (10 or less) | Filter buttons. “Unusually high” shows stocks whose PCR rank is 90 or more. |
| PCR today | Put OI ÷ call OI across all expiries for the stock. |
| 20-day average | The stock’s average PCR over the last 20 sessions. Compare it with today to see a sudden change. |
| Rank in its year | Where today’s PCR sits in the stock’s last 250 sessions: 0 = the lowest of the year, 100 = the highest. The table is sorted by this, highest first. |
| Price change | Today’s % change in the stock price, so you can see whether PCR moved with price or against it. |
Click any column header to sort by it; click again to reverse. Click a stock name to open its ChartMine stock page.
Step by step: a 10-minute evening check
- In the evening, open the page. It is rebuilt after NSE publishes its end-of-day F&O file. Check the date under the index card (for example “6 Nov 2026”).
- Read the four cards for NIFTY 50. Today’s PCR, how unusual it is (“higher than …%”), the long-run average and the index close.
- Look at the chart on 3M. Is PCR rising with the index, falling with it, or moving against it? A trend over a week matters more than one day.
- Ignore expiry-day spikes. If today or yesterday was an expiry, expect the nearest-expiry line to jump. Wait a day before drawing conclusions.
- Repeat for BANK NIFTY if you trade it. The two often disagree.
- Scan the stock table. Tap “Unusually high (90+)” and “Unusually low (10 or less)”. Note any stock you follow, and compare “PCR today” with the “20-day average”.
- Cross-check before acting. Open the stock’s option chain to see which strikes the puts or calls are at, and the OI build-up page to see what the futures did.
- Write down what you saw, not what you predict. Over a few months your own notes will show whether PCR helps your trading.
Three ways traders use PCR
Playbook A: a sentiment filter for index trades
Some traders use PCR only to adjust how cautious they are. When NIFTY’s PCR is in its top 10% after a sharp rally, they note that a lot of put positions are open below the market and avoid adding fresh long positions far above support; when it is in its bottom 10% after a fall, they avoid chasing shorts. The trade itself still comes from price: a level, a breakout, a stop loss.
Playbook B: follow the change, not the level
Instead of asking “is 1.3 high?”, watch the direction over several days together with price:
- Price rising and PCR rising: puts are being added as the market climbs, often read as writers moving support up.
- Price rising and PCR falling: calls are being added faster than puts.
- Price falling and PCR falling: puts are being closed or calls added into the fall.
- Price falling and PCR rising: often hedging (put buying) or put writers stepping in.
None of these combinations is a signal on its own; they help you describe what is happening.
Playbook C: stock alerts from the table
Use “Unusually high” and “Unusually low” as an alert list. A stock whose PCR jumped from a 20-day average of 0.6 to 1.0 deserves a look at its option chain and news. Results, dividends, F&O ban and index changes often explain the jump.
Position size first. Whatever idea PCR gives you, decide how much you are willing to lose (for example 0.5–1% of capital) and use the position size calculator with your entry and stop loss.
Case studies from the PCR history
All numbers are NIFTY 50 end-of-day figures from NSE’s F&O files, as used by the page.
1. October–November 2026: a high PCR that did not stop a rally
On 27 Oct 2026 NIFTY closed at 22,750 with an all-expiry PCR of 1.05, near average. NIFTY then rose in seven of the next eight sessions, to 25,030 on 6 Nov (+10.0%). PCR climbed with it: 1.31 on 29 Oct, 1.42 on 30 Oct, 1.50 on 3 Nov, 1.47 on 6 Nov, among the highest readings in the whole history. Lesson: a high PCR can be a result of a rally (put writers moving up behind the price) rather than a warning against it. Anyone who sold because “PCR is extremely high” fought a 10% move.
2. 30 Oct 2026 vs 2 Jan 2026: the same reading, opposite outcomes
On 30 Oct 2026 the PCR was 1.42 (top 10%). Five sessions later NIFTY was 8.6% higher (23,053 to 25,030). On 2 Jan 2026 the PCR was 1.46, even higher. Five sessions later NIFTY was 2.5% lower (26,329 to 25,683). Lesson: an extreme PCR does not tell you the direction. That is exactly what the page’s study table shows on average.
3. February 2026: low PCR, both ways
The low end is just as mixed. On 1 Feb 2026 (a special Sunday session) PCR was 0.59; five sessions later NIFTY was 3.5% higher (24,825 to 25,694). On 27 Feb 2026 PCR was 0.63; five sessions later NIFTY was 4.6% lower (25,179 to 24,028). The lowest reading in the history, 0.55 on 18 Dec 2024, was followed by a 1.9% fall.
4. October 2026: expiry-day noise
Around weekly expiries the PCR can flip in a day. On 12 Oct 2026 the all-expiry PCR was 0.73; on 13 Oct (an expiry day) it was 1.27; on 14 Oct back to 0.91. The index moved only about 1.6% across those days. Lesson: do not read a one-day jump around expiry as a change in sentiment. Look at the 3M chart and the trend over a week.
Common mistakes
- Using a fixed rule like “PCR above 1.3 = buy”. Case 2 shows the same reading followed by a rise and by a fall.
- Comparing different indices. A PCR of 1.05 is extreme for FINNIFTY and ordinary for MIDCAP NIFTY.
- Reading expiry-day spikes as news. The nearest-expiry PCR resets every week.
- Forgetting who is on the other side. Every put that is bought was sold by someone. OI alone does not tell you which side is the “smart” one.
- Ignoring the price chart. PCR is context for price, not a replacement for it.
- Trading without a stop loss because “sentiment is extreme, it must turn”. Case 1 kept going for 10%.
- Treating a small sample as proof. 58 days in one market phase cannot prove a pattern; the page says so under its own table.
Checklist before you use a PCR reading
- The date on the page is the latest trading day.
- I compared today’s PCR with this index’s own history (“higher than …%”), not with a fixed number.
- I checked whether today or yesterday was an expiry day.
- I looked at the trend of PCR over at least a week, together with price.
- For a stock: I compared PCR today with its 20-day average and checked the option chain and news.
- My trade idea comes from price levels; PCR only adjusts my caution.
- Stop loss and position size are decided before entry.
Glossary
| Call option (CE) | A contract that gains value when the price rises above its strike. |
| Put option (PE) | A contract that gains value when the price falls below its strike. |
| Writer / seller | The trader who sells an option and receives the premium, taking on the obligation. |
| Open interest (OI) | Option or futures contracts still open at the end of the day. |
| PCR (put-call ratio) | Put OI ÷ call OI. Above 1 = more puts open than calls. |
| All-expiry PCR | PCR using every expiry date together. Smoother. |
| Nearest-expiry PCR | PCR using only the contracts that expire next. More volatile. |
| Percentile / rank | Where today’s value sits in history: 99 = higher than 99% of past days. |
| Expiry | The day an option contract ends and is settled. |
| Hedging | Buying protection (often puts) against a fall in shares you already own. |
Questions
What is a good PCR for NIFTY?
There is no single good number. Since July 2024 NIFTY’s all-expiry PCR averaged 0.97 and ranged from 0.55 to 1.50. Compare today’s reading with that history: the PCR trend page shows how unusual it is in percent.
Is a high PCR bullish or bearish?
Traders read it both ways: as put writers building support (bullish) or as heavy hedging (cautious). In ChartMine’s data since July 2024, NIFTY was higher five sessions later 53% of the time after a top-10% PCR, against 48% on any day: close to a coin toss.
What is the difference between all-expiry and nearest-expiry PCR?
All-expiry PCR uses every open put and call. Nearest-expiry PCR uses only the contracts that expire next; it moves more and resets each week when a new expiry becomes the nearest.
How is PCR calculated on ChartMine?
Total put open interest divided by total call open interest, from NSE’s end-of-day F&O file. On 6 Nov 2026 NIFTY’s figure was 41,40,73,030 ÷ 28,15,71,440 = 1.47.
When is the PCR trend page updated?
Every trading evening after NSE publishes its F&O end-of-day file.
Can I see the PCR of a stock like HDFC Bank?
Yes. The stock table lists 205 F&O stocks with today’s PCR, its 20-day average and its rank in the stock’s last year. On 6 Nov 2026 HDFC Bank’s PCR was 0.96 against a 20-day average of 0.62, the highest of its year.
Should I trade only on PCR?
No. PCR describes positioning. Use it as context alongside price levels, the option chain and news, and always with a stop loss and a planned position size.