
☰ All tutorials
Start here
Tool tutorialsHow to trade with ChartMineStocks
Stock monitorMy watchlistStock scores & checklistMarket & sectors
Nifty 50Bank NiftySensexFin NiftyDaily market reportMarket breadthSector rotationSector heatmapStock screenerRelative strength (RS)MCX commodity pricesFear & Greed IndexWhat happens after…Scanners
Top gainers & losersStocks to watch tomorrowNR7 stocks scannerInside bar stocks52-week high stocksGap up & gap down stocksRSI oversold stocksGolden cross stocksSuperTrend buy stocksScan builderEMA 9/21 crossoverMACD crossoverADX strong trendBollinger breakout / squeezeVolume spike stocksOpen = high / open = lowCandlestick pattern scannerNarrow CPR scannerF&O data
F&O ban listOI build-upOption chainPCR & max painExpiry calendarF&O lot sizesOI build-up heatmapPCR trendMax pain trendFutures basisStock screens
Quarterly growersProfit growth stocksLow P/E stocksMutual fund buyingNear 52-week low, growingDebt-free companiesHigh ROE & ROCEMagic Formula stocksLow price-to-bookSmart money
FII / DII dataShareholding changesBig-money footprintShort selling dataF&O positions by participantBulk & block dealsPromoter buyingDelivery percentageCalendars
Results calendarQuarterly results trackerBoard meetingsCorporate actionsIPO calendarIPO performanceResearch & planning
Strategy testerCompare stocksDividend yield stocksASM / GSM listExpiry-day movesSeasonality & stock historyNSE holidays 2026Position size calculatorOption payoff calculatorPivot point calculatorMore
Stock scanners hubStock screensHow to use My watchlist
A plain-language guide to ChartMine’s free, no-login stock watchlist: how to add stocks, what every column means, how to get an evening Telegram message about your stocks, a 10-minute review routine, three playbooks, and a real watchlist followed from 30 Oct to 13 Nov 2026, including a stock that stayed stuck at its lower price band.
What the watchlist is, in plain words
A watchlist is a short list of stocks you want to keep an eye on. It is the bridge between “I noticed something interesting” and “I have a plan”. Most good trades and investments start on a watchlist days or weeks before any money goes in.
ChartMine’s My watchlist is a page that shows only the stocks you have starred, in the same sortable table as the Stock monitor: price, RS rating, returns from one day to one year, distance from the 52-week high, delivery and volatility. Every evening the numbers update with NSE’s closing data, so one glance tells you how your shortlist moved.
Three things to know from the start:
- Free and no login. You do not need an account.
- Saved in your browser. The list is stored on your device, in this browser only. It is never sent to ChartMine. That is private, but it also means it does not follow you to another phone or computer, and clearing your browser’s site data deletes it.
- Two ways to add a stock: the ☆ star next to any stock in the Stock monitor, or the ☆ Add to watchlist button at the top of any stock page.
- Optional Telegram alerts (new, 14 Nov 2026). You can send your list to the free ChartMine alerts bot on Telegram. On trading days, at about 8:25 PM, it sends you one message about your stocks, and only if something happened to them that day. This one part does leave your device (details below).
One line to remember: a watchlist is a tool for patience. It lets you wait for the right moment on stocks you have already studied, instead of chasing whatever moved today.
Kinds of watchlists traders keep
The page holds one list, but how you use it is up to you. Most traders keep one of these, or rotate between them.
| Type | What goes on it | Typical size | How often to review |
|---|---|---|---|
| Setup list | Stocks close to a planned entry: near a breakout level, pulling back to support, or with a tight range. | 5–10 | Every evening |
| Leaders list | The strongest stocks in the strongest sectors (high RS, near 52-week highs), waiting for a calm entry. | 10–20 | Weekly |
| Event list | Stocks with results, dividends or other events coming up that you want to watch around the date. | 5–15 | Around each event |
| Holdings list | Stocks you already own, to see at a glance how they behave against the market. | Whatever you hold | Daily or weekly |
| Research list | Companies you want to study properly before deciding anything (long-term investors). | 10–30 | Monthly, after results |
Why small is better
A list of 80 stocks is not a watchlist; it is a second market. You will not have time to know each one, and you will end up reacting to whatever moved most. A list you can review in ten minutes, where you know why every name is there, is far more useful.
A rule for every name
Before you star a stock, be able to finish this sentence: “I am watching this because ___, and I would consider acting if ___.” Write it in the My notes section at the bottom of the stock’s page (also saved only in your browser). If you cannot finish the sentence, the stock probably does not belong on the list.
Why use it: advantages and limits
✅ One screen for your shortlist
All your stocks with returns, RS, distance from high, delivery and volatility, sortable in one click.
✅ Updates itself
Every evening the numbers refresh from NSE’s closing files. No spreadsheets.
✅ Private
No login, nothing sent anywhere. The list lives in your browser.
✅ Evening alerts if you want them
One Telegram message on trading evenings, only about stocks on your list that did something notable.
✅ Connected
Each name opens its full stock page: chart, delivery, results, timeline, F&O and notes.
The limits (please read this part)
- One browser, one device. The list does not sync. A watchlist made on your laptop will not appear on your phone. Private or incognito windows usually forget it when closed.
- Clearing site data deletes it. If you clear cookies and site data for chartmine.ai, the list and your notes are gone. There is no backup on our side.
- End-of-day numbers. The table updates in the evening. It is not a live price ticker. The Telegram alerts are end-of-day too: one message after the close, never during market hours.
- Two separate lists. Your browser list and the Telegram bot’s list are not linked. “Send my watchlist to Telegram” copies your stocks once; later changes need /add and /remove in the bot.
- Only stocks in the monitor. You can star any of the 1,536 stocks the monitor covered on 13 Nov 2026 (every F&O stock, stocks trading ₹1 crore a day or more, and recent IPOs from their 5th trading session), not every listed company.
- A list is not a decision. Being on your watchlist says nothing about whether a stock will rise. Case 2 below shows how fast a watched stock can fall.
Tip: keep a simple copy of your list somewhere else too (a note on your phone, a paper journal), with the reason for each stock. If the browser data is ever cleared, you lose nothing important.
A tour: adding stocks and reading the list
Adding from the Stock monitor
Open the Stock monitor and tap the ☆ star at the left of any row. It turns into a filled ★ and the stock is saved. Tap it again to remove it. The ★ My watchlist button above the table shows only your starred stocks without leaving the monitor.
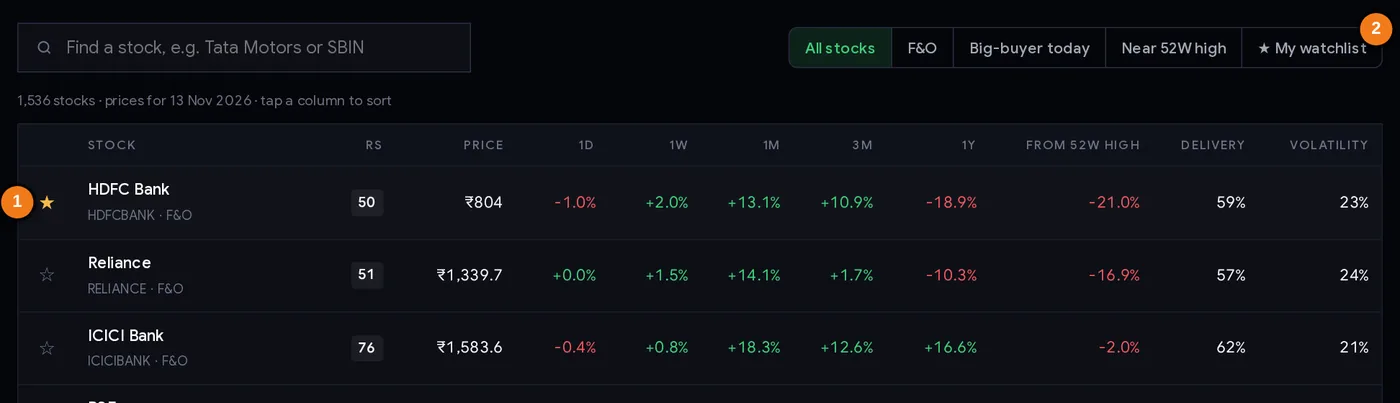
- 1Filled star: the stock is on your watchlist (tap again to remove)
- 2Show only your watchlist inside the monitor
Adding from a stock page
On any stock page, press ☆ Add to watchlist next to the price. The button changes to ★ In your watchlist; press it again to remove the stock. The button next to it, 🔔 Get Telegram alerts, adds just this one stock to your Telegram alerts (see the next section).
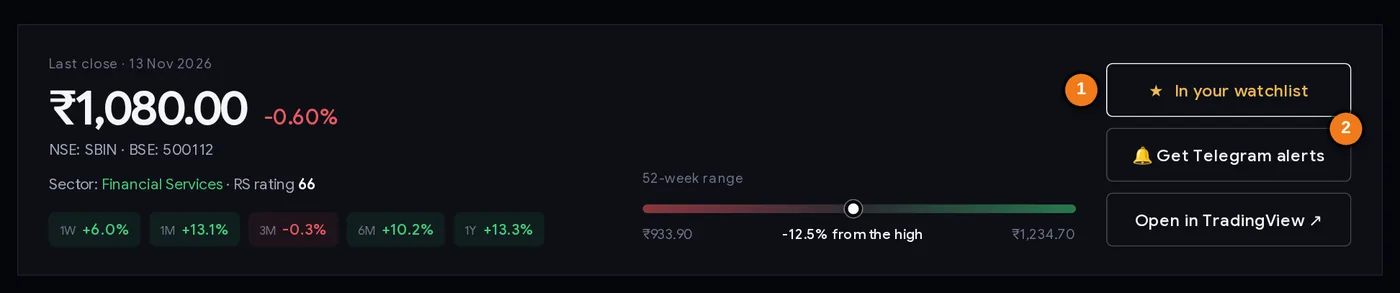
- 1Add to (or remove from) your watchlist
- 2Follow this one stock on Telegram
The watchlist page
Open My watchlist (also reachable from the star icon in the site header once your list has at least one stock). It shows your stocks in the same table as the monitor, sorted by the day’s move (1D, biggest gain first) so you see at once what moved most.

- 1How many stocks and the price date
- 2Sorted by the day’s move (1D) by default; tap any header to sort
- 3Tap the star to remove a stock
| Column | What it tells you |
|---|---|
| ★ | Tap to remove the stock from the list. |
| Stock | Name, symbol, F&O tag, and a big-buyer-day tag if delivery was 3× normal or more in the latest session. Tap to open the stock page. |
| RS | RS rating, 1–99: 12-month strength against all tracked stocks. |
| Price | Latest closing price. |
| 1D, 1W, 1M, 3M, 1Y | Returns over each period. |
| From 52W high | How far below its 52-week high the stock is. |
| Delivery | Average delivery % over the last 60 sessions. |
| Volatility | Typical yearly swing; divide by about 16 for a typical day. |
Click any column header to sort by it; click again to reverse. If the list is empty, the page tells you so and links to the monitor.
The Telegram box under the table
Below the table is a box called Get alerts for your watchlist on Telegram, with two buttons.
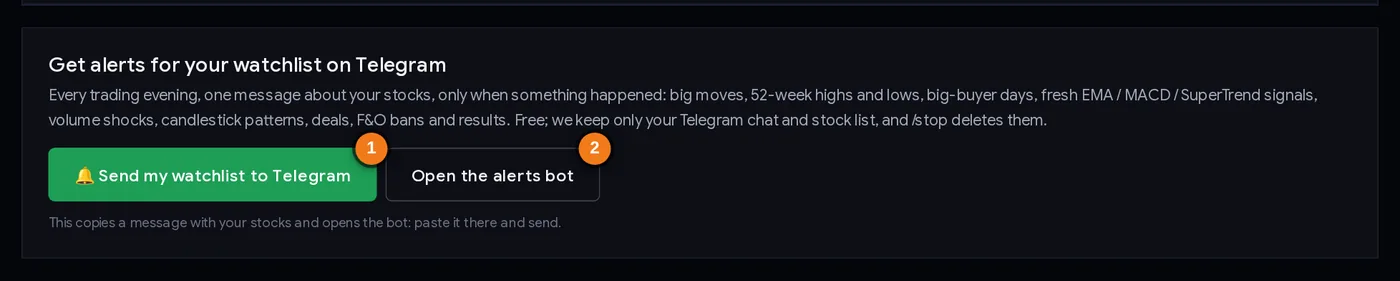
- 1Copy “/add” with your symbols and open the bot
- 2Open the alerts bot without copying
| Button | What it does |
|---|---|
| 🔔 Send my watchlist to Telegram | Copies a ready message, “/add” followed by the symbols on your list (up to 50), and opens the ChartMine alerts bot in Telegram. You paste the message there and send it. If your list is empty, it asks you to star some stocks first. |
| Open the alerts bot | Just opens the bot, if you prefer to type the symbols yourself. |
Telegram alerts: one evening message about your stocks
The ChartMine alerts bot on Telegram does the first glance of your evening review for you: after each trading day it checks every stock on your list and writes only about the ones where something happened. If nothing happened to any of them, you get no message.
How to switch it on (two minutes)
- On My watchlist, press 🔔 Send my watchlist to Telegram. It copies a message like “/add SBIN TCS INFY” and opens the bot (Telegram app or Telegram Web).
- Press Start the first time, then paste and send. The bot replies with the stocks it added and any word it did not recognise.
- For one stock, press 🔔 Get Telegram alerts on its page, then Start in Telegram.
The bot’s commands
| Command | What it does |
|---|---|
| /add SBIN TCS | Adds stocks by NSE symbol (or the start of a company name). Up to 50. |
| /list | Shows the stocks you follow, each linked to its ChartMine stock page. |
| /remove SBIN | Removes a stock. |
| /clear | Empties your list but keeps you subscribed. |
| /stop | Unsubscribes you and deletes your list and details from the bot. |
| /help | Shows what the bot does and these commands. |
The bot knows only the stocks in the Stock monitor; if it says “Not found”, check the symbol there (SBIN, not SBI).
When the message comes, and what can be in it
The message is sent at about 8:25 PM IST, Monday to Friday, only on NSE trading days and only after that day’s data has been processed. No message on weekends or market holidays. It lists each of your stocks that had at least one of these, up to six lines per stock:
| Alert | What it means in plain words |
|---|---|
| Big move | The stock closed 4% or more up or down on the day. |
| 52-week high or low | A new highest or lowest price of the past year. |
| Big-buyer day | Delivered shares 3× the stock’s normal or more (heavy real ownership change, buying or selling). |
| 9/21 EMA, MACD, SuperTrend | A fresh crossover or turn of these trend indicators, up or down. |
| Golden or death cross | The 50-day average crossed above (golden) or below (death) the 200-day average. |
| Bollinger Bands | Closed above the upper band or below the lower band, or a “squeeze” (bands at their tightest in 120 days). |
| RSI | 14-day RSI above 70 or below 30. |
| Volume 3× | Volume at least 3 times its 20-day average. |
| Open = high / open = low | The day’s opening price was also its high (or its low). |
| Candlestick patterns | Bullish or bearish engulfing, hammer, shooting star, morning or evening star, bullish or bearish marubozu. |
| Bulk or block deal | A large deal reported to NSE that day: bought or sold, quantity and price. |
| Results coming | A results or board meeting date within the next few days. |
| F&O ban | The stock is in the F&O ban list for the next session. |
How often will I get a message? (real numbers)
“Only when something happened” sounds rare, but these triggers are many. For Friday 13 Nov 2026 we ran the bot’s own checks on every stock in the monitor: 903 of the 1,536 stocks had at least one alert line. The most common were open = high (245 stocks), a 9/21 EMA bullish crossover (225), SuperTrend turning up (147) and a MACD bullish crossover (119). Rarer ones: 97 stocks moved 4% or more, 81 had volume 3× normal, 66 had a big-buyer day, 46 made a new 52-week high and 10 a new 52-week low; no stock entered the F&O ban for the next session. So with ten or more stocks, expect a message most trading evenings.
Privacy
The website watchlist stays in your browser. To send you messages, the bot keeps only your Telegram chat id and your list of stocks; no name, no phone number, no trades. /stop (or blocking the bot) deletes all of it.
An alert is information, not a signal to trade. “RSI above 70” or “SuperTrend turned up” describes what the price did; it does not say what it will do. Open the stock page and decide with your own plan, stop loss and position size.
Step by step: a 10-minute evening review
- Open My watchlist after the evening update (the site refreshes at about 8 PM and again around 10:15 PM IST). The “Updated” line at the top of the Stock monitor shows the time and the trading session the data is for. If you use the Telegram alerts, start from the 8:25 PM message: it already lists which of your stocks did something.
- Glance at 1D. Which names moved most, up or down? Anything unusual (a big-buyer tag, a large gap)?
- Sort by “From 52W high”. Which stocks are now close to their highs (possible breakouts), and which have slipped far below?
- Open the two or three that changed most. Read the timeline: was there a result, a deal, a dividend? Look at the chart.
- Update your notes. For each stock you opened, adjust the trigger: “consider acting if it closes above ₹X with good volume; idea wrong below ₹Y.”
- Remove at least one stock if it no longer fits your reason (the setup failed, the sector turned, the story changed). Removing is as important as adding. If you use the alerts, remove it from the bot too (/remove SYMBOL).
- Add new names carefully from your scans (the RS ranking, the stocks to watch tomorrow page, the market report), each with its reason in My notes.
- Check the calendar. Look up results and ex-dates for your names on the board meetings and corporate actions pages.
Three ways to run a watchlist
Playbook A: the breakout list (swing traders)
Each weekend, take 5–10 high-RS stocks within about 10% of their 52-week high from the RS ranking. Star them and write the breakout level in My notes. Each evening, check which ones closed above their level. Only those get an order plan for the next session: entry near the breakout, stop below the recent range, position size from the position size calculator. The others wait. Names that fall back more than a set amount (say 8% from the high) come off the list.
Playbook B: the results-season list (investors)
Before results season, star the companies you would like to own or add to. As each reports, read the numbers on its stock page and the results tracker, watch the results-day move and the delivery that week. Write a two-line verdict in My notes. After the season you have a short list of companies whose results and price reaction you understand, which is a much better starting point for a long-term decision than a tip.
Playbook C: the holdings mirror
Star every stock you own. Once a week sort by 1M and by From 52W high. A holding falling steadily while the market rises, or a holding whose RS rating has dropped from 80 to 30, deserves a fresh look at why you own it. This is not a sell signal; it is a reminder to review your stop loss and your thesis.
Every playbook needs the same two numbers before any order: where you are wrong (stop loss) and how much you are willing to lose if you are (position size).
Case studies: a real watchlist, 30 Oct to 13 Nov 2026
To see what a watchlist looks like in practice, we built one from public information only: the ten names highlighted in ChartMine’s market report for 30 Oct 2026. Five were stocks with their RS line at a new high (Laurus Labs, SG Mart, Krishana Phoschem, Acutaas Chemicals, Pashupati Cotspin) and five were the day’s biggest long build-ups in futures (Navin Fluorine, Max Healthcare, Ather Energy, Trent, Divi’s Labs). Then we followed the closing prices to 6 Nov 2026. This is an illustration, not a recommendation or a strategy test.
1. The whole list against NIFTY
Seven of the ten closed higher after one week, but the average change was only +0.31%, while NIFTY 50 rose about 8.6% (23,053 to 25,030) in the same week. Best: Max Healthcare +8.6% (₹860 to ₹934), Krishana Phoschem +6.7%, Divi’s Labs +5.5% (closing at a 52-week high on 6 Nov). Worst: Pashupati Cotspin −19.4%, Acutaas Chemicals −5.4%, Laurus Labs −2.7%. Lesson: a list of “strong” names can badly trail the index in a week when large caps carry the market. Always compare your list with NIFTY and with market breadth.
2. Pashupati Cotspin: the risk a watchlist cannot remove
Pashupati Cotspin was on the 30 Oct list with its RS line at a new high, closing at ₹134.60. It kept rising: ₹141.62 on 2 Nov (a big-buyer day with delivery 44.8× normal) and ₹148.72 on 3 Nov. On 4 Nov it reached ₹155.49 intraday and then closed at ₹133.85, down 10%. On 5 Nov and 6 Nov it was locked at the lower price band all day (₹120.47, then ₹108.43), with only about 1.6 lakh and 1.0 lakh shares traded, against nearly 75 lakh shares on 30 Oct. A holder could barely sell. It did not stop there: it was locked at the lower band again in every session up to 12 Nov (₹97.59 in the Sunday 8 Nov session, then ₹92.72, ₹88.09 and ₹83.69), on as few as 38,341 shares traded on 8 Nov. NSE’s surveillance lists showed it under the long-term ASM framework (Stage I) from 5 Nov. Lesson: small, fast-rising stocks can hit their price band and become impossible to exit; a stop loss does not help when there are no buyers. Check liquidity and volatility on the stock page, and keep such names small.
3. Max Healthcare and Divi’s Labs: the patient winners
Both were long build-ups on 30 Oct. Neither traded below its 30 Oct close during the week (lowest lows ₹863.80 and ₹9,863, both above the starting closes of ₹860 and ₹9,780). Divi’s ended the week at its 52-week high with RS 93. Lesson: the best names on a watchlist often simply hold their ground and grind higher; the evening review is where you notice them.
4. Laurus Labs: strong rating, weak week
Laurus Labs had its RS line at a new high on 30 Oct and was still rated RS 98 on 6 Nov, yet it fell 2.7% in the week and traded as low as ₹2,252.40 (6.4% below the 30 Oct close of ₹2,405.50). Lesson: a strong stock can dip 5–7% inside a week without anything being “wrong”. Your stop loss must leave room for the stock’s normal volatility, or you will be shaken out of good names.
5. The same list on 13 Nov 2026, through the Telegram alerts
If those ten stocks had been on the alerts bot, the message for Friday 13 Nov would have covered six of them (bot checks run on that day’s data). Four had a new 52-week high: SG Mart, Acutaas Chemicals, Navin Fluorine and Ather Energy (three of them also with RSI above 70, and Navin Fluorine also closing above its upper Bollinger Band). Divi’s Labs had RSI above 70. Pashupati Cotspin had five lines, including a 9/21 EMA bearish crossover, a big-buyer day and two bulk deals on the same day (18 lakh shares bought and 18 lakh sold at about the same price). Laurus Labs, Krishana Phoschem, Max Healthcare and Trent were quiet and only counted at the end. Lesson: the message splits your list into “look at these” and “nothing new” in seconds, but a bought-and-sold bulk deal pair says nothing about direction; you still open each page.
Common mistakes
- Too many names. If you cannot review the list in ten minutes, it is too long.
- No reason written down. A month later you will not remember why a stock is there.
- Never removing anything. A watchlist full of broken setups hides the good ones.
- Treating the list as a buy list. Case 2: a watched stock fell 19% in a week and became hard to sell.
- Ignoring the index. Case 1: the list rose 0.3% while NIFTY rose 8.6%.
- Relying on one browser. Clearing site data or switching devices loses the list; keep a copy.
- Stops too tight for the stock. Case 4: a 6% intraweek dip in an RS 98 stock.
- Trading every alert. On 13 Nov 2026, 903 of 1,536 stocks had at least one alert line. An alert is a reason to look, not to act.
- Letting the two lists drift apart. The Telegram bot does not see stars you add later; update it with /add and /remove.
Watchlist checklist
- The list fits in a ten-minute review (about 5–20 names).
- Every stock has a written reason and trigger in My notes.
- Reviewed after the evening update; the date checked.
- Biggest movers opened and their timelines read.
- At least one stale name removed this week.
- Results and ex-dates for listed stocks checked.
- Liquidity and volatility checked before planning any position.
- A copy of the list and reasons kept outside the browser.
- If you use Telegram alerts: /list matches your watchlist.
Glossary
| Watchlist | A short list of stocks you are following closely. |
| Setup | A chart situation you have a plan for (breakout, pullback, range). |
| Trigger | The price or event that would make you act. |
| Local storage | Space in your browser where websites keep small data on your device. |
| Price band (circuit) | The maximum a stock may move in a day; at the limit, trading continues only at that price, often with few buyers or sellers. |
| Long build-up | Futures price and open interest both rising. |
| RS line new high | The stock’s price ÷ NIFTY 50 at a 52-week high. |
| Telegram bot | An automatic Telegram account that answers commands and sends messages; ChartMine’s is @ChartMineAlertsBot. |
| SuperTrend | A trend line drawn from price and volatility; it “turns up” or “turns down” when the price crosses it. |
| Bulk / block deal | A large trade the exchange publishes: a bulk deal is over 0.5% of a company’s shares in a day; a block deal is a large trade in a special window. |
| F&O ban | When open interest in a stock’s futures and options passes 95% of the market-wide limit, no new F&O positions are allowed until it falls. |
| Liquidity | How easily you can buy or sell without moving the price. |
Questions
How do I make a stock watchlist on ChartMine?
Tap the ☆ star next to any stock in the Stock monitor, or press “Add to watchlist” on any stock page. No login is needed. Your starred stocks appear on the My watchlist page with price, RS rating, returns, distance from the 52-week high, delivery and volatility.
How do I get watchlist alerts on Telegram?
Open My watchlist and press “Send my watchlist to Telegram”. It copies “/add” with your symbols and opens @ChartMineAlertsBot; paste and send. Or press “Get Telegram alerts” on a stock page to add that one stock. Messages come at about 8:25 PM on trading days.
When does the ChartMine alerts bot send a message?
Once per trading evening, around 8:25 PM IST, and only if at least one of your stocks had something notable: a 4% move, a 52-week high or low, a big-buyer day, an indicator signal, a candlestick pattern, a deal, an F&O ban or results coming.
What data does the alerts bot keep, and how do I stop it?
Only your Telegram chat id and your list of stocks. Send /stop to unsubscribe and delete all of it; blocking the bot also deletes it. The website watchlist itself stays only in your browser.
Why did my watchlist disappear?
It is stored in your browser only. It will not appear on another device or browser, private windows usually forget it, and clearing site data for chartmine.ai deletes it. Keep a copy of your list elsewhere.
Does the watchlist show live prices?
No. It updates every trading day evening with NSE’s closing data, and the Telegram alerts are sent after the close, not during market hours.
Can I add any NSE stock to the watchlist?
You can add any stock in the Stock monitor: 1,536 on 13 Nov 2026, covering every F&O stock, stocks trading ₹1 crore a day or more, and recent IPOs from their 5th trading session.
Is a watchlist a list of stocks to buy?
No. It is a list of stocks you are studying, and an alert is information, not advice. ChartMine is not a SEBI-registered adviser; every trade needs your own analysis, a stop loss and a sensible position size.