
☰ All tutorials
Start here
Tool tutorialsHow to trade with ChartMineStocks
Stock monitorMy watchlistStock scores & checklistMarket & sectors
Nifty 50Bank NiftySensexFin NiftyDaily market reportMarket breadthSector rotationSector heatmapStock screenerRelative strength (RS)MCX commodity pricesFear & Greed IndexWhat happens after…Scanners
Top gainers & losersStocks to watch tomorrowNR7 stocks scannerInside bar stocks52-week high stocksGap up & gap down stocksRSI oversold stocksGolden cross stocksSuperTrend buy stocksScan builderEMA 9/21 crossoverMACD crossoverADX strong trendBollinger breakout / squeezeVolume spike stocksOpen = high / open = lowCandlestick pattern scannerNarrow CPR scannerF&O data
F&O ban listOI build-upOption chainPCR & max painExpiry calendarF&O lot sizesOI build-up heatmapPCR trendMax pain trendFutures basisStock screens
Quarterly growersProfit growth stocksLow P/E stocksMutual fund buyingNear 52-week low, growingDebt-free companiesHigh ROE & ROCEMagic Formula stocksLow price-to-bookSmart money
FII / DII dataShareholding changesBig-money footprintShort selling dataF&O positions by participantBulk & block dealsPromoter buyingDelivery percentageCalendars
Results calendarQuarterly results trackerBoard meetingsCorporate actionsIPO calendarIPO performanceResearch & planning
Strategy testerCompare stocksDividend yield stocksASM / GSM listExpiry-day movesSeasonality & stock historyNSE holidays 2026Position size calculatorOption payoff calculatorPivot point calculatorMore
Stock scanners hubStock screensHow to use the 52-week high stocks scanner
A plain-language tutorial on 52-week highs and lows: how the scanner finds them, the setups traders look for, an honest one-year test, a tour of every part of the screen, and three playbooks with real case studies.
What a 52-week high is, in plain words
A 52-week high is the highest price a stock has traded at in the last year (52 weeks, roughly 250 trading days). When a stock trades above that level today, it makes a new 52-week high: nobody who bought in the past year is sitting on a loss.
The opposite is a 52-week low: the lowest price of the past year. A stock at a new low means everyone who bought in the past year is losing money on paper.
Why do traders care? Because these levels change behaviour. Near a 52-week high, people who bought at the top last time may sell to “get their money back”. Once the high is crossed, there is no such overhead supply, and many investors look at new highs as a sign of strength (this is called momentum). New lows tell the opposite story.
One line to remember: a 52-week high shows strength that already happened. It tells you where the stock stands, not where it must go next.
The 52-week high stocks scanner lists every F&O stock and main index that made a new 52-week high or low today, or closed within 2% of one, every evening, with volume, RSI and trend next to each name.
How the scanner decides (with a real example)
| Tab | Rule |
|---|---|
| New 52-week high | Today’s high is at or above the highest high of the previous 252 sessions. |
| Near 52-week high | Not a new high, but today’s close is within 2% of the 52-week high. |
| New 52-week low | Today’s low is at or below the lowest low of the previous 252 sessions. |
| Near 52-week low | Not a new low, but the close is within 2% of the 52-week low. |
Two details matter. First, the test uses the day’s high (or low), not the close, so a stock that touched a new high and then fell back still counts. Second, prices are adjusted for splits and bonuses, so a 1:1 bonus does not create a fake “new low”.
Example: Dr. Reddy’s, 29 Jun 2026
Dr. Reddy’s opened 2.8% higher on 29 Jun 2026, touched ₹1,414.90, a new 52-week high, on 5.7 times its usual volume. But it closed at ₹1,375.70, well below the day’s high. The scanner listed it as a new 52-week high because the high crossed the old level. A trader reading the candle would also see that sellers pushed it back almost ₹40 by the close. That ₹1,414.90 was still the stock’s 52-week high in the 6 Nov 2026 scan, when it closed 2.96% below it.
Types of 52-week setups
| Setup | What to look for | How traders read it |
|---|---|---|
| Breakout on volume | New high, volume 1.5–2× the 20-day average or more | Strong participation. Use the volume filter. |
| Quiet new high | New high on normal or low volume | Weaker conviction; often drifts. |
| Failed high (rejection) | New intraday high, but close far below it | Sellers active at the top, as in the Dr. Reddy’s example. |
| Pause under the high | Near-high tab, plus NR7 or inside bar | A tight base just below the level. “Combine with”. |
| New low in a downtrend | New-low tab, below the 200-DMA | Weakness; many investors avoid these. |
| Oversold new low | New low with RSI under 30 | Stretched selling; bounces happen but are not reliable. |
Market-wide highs are a type of their own. On 2 and 5 Jan 2026, 31 and 33 F&O stocks made new highs on the same day: that is the whole market rising, not 33 separate stories. A count like that is useful as a market breadth reading.
Why traders watch 52-week highs: advantages and limits
✅ Strength filter
A stock at a new high is, by definition, in an uptrend. It is a quick way to find leaders.
✅ No overhead sellers
Above the old high, nobody from the past year is waiting to sell at breakeven.
✅ Market health
The number of new highs versus new lows is a simple breadth gauge.
✅ Avoid list
The new-low tabs show which stocks are under the most pressure, useful if you only want to buy strong names.
The limits: what our own data says
We rebuilt the scanner’s list for every session from 27 Oct 2025 to 6 Nov 2026 (256 trading days, 217 F&O stocks, same adjusted data and code) and checked what followed. Because new highs often appear on days when the whole market rises, we compare each stock with the average F&O stock over the same days. Over this period NIFTY fell about 3.6%, from 25,966 to 25,030.
| Setup | Cases | Next day, up | 20 days: vs average stock | Beat the average (20 days) | 60 days: vs average stock |
|---|---|---|---|---|---|
| New 52-week high | 2,310 | 48.7% | +1.22% | 54% | +2.18% |
| New high on 2× volume | 519 | 48.6% | +1.05% | 51% | +3.27% |
| Near 52-week high | 1,759 | 45.7% | +0.53% | 50% | +0.84% |
| New 52-week low | 1,394 | 54.1% | +0.67% | 51% | −1.20% |
- New highs did a little better than the average stock over the following one to three months, which matches the well-known momentum effect. The edge was small: about 1.2% over 20 sessions.
- Nearly half still lagged. Only 54% of new highs beat the average stock over 20 days. Any single stock can fall hard after a new high (see Apollo Hospitals below).
- Next day: a coin toss. Up 48.7% of the time. A new high is not a next-day signal.
- Volume helped a little over 60 days (+3.27% vs +2.18%), not over 20.
- New lows bounced briefly but lagged over 60 days (−1.20% versus the average, and only 41% beat it).
Honest summary: in this one-year test, buying strength (new highs) was mildly better than buying weakness (new lows), but the difference was a few percent over months, with wide variation. It is a filter for where to look, and it needs a stop loss like any other idea.
A tour of the scanner screen
Open the 52-week high stocks scanner. It has four tabs at the top, the filters, and the results table, sorted by volume (highest first) so the most active breakouts appear first.

- 1Scan for: pick a scan date; the latest is first.
- 2New 52-week high today.
- 3Near 52-week high: within 2%.
- 4New 52-week low today.
- 5Near 52-week low: within 2%.
On 6 Nov 2026 there were 15 new 52-week highs, 5 near highs and 3 new lows. Compare the high and low counts over a few days to sense whether the market is broadening or narrowing.
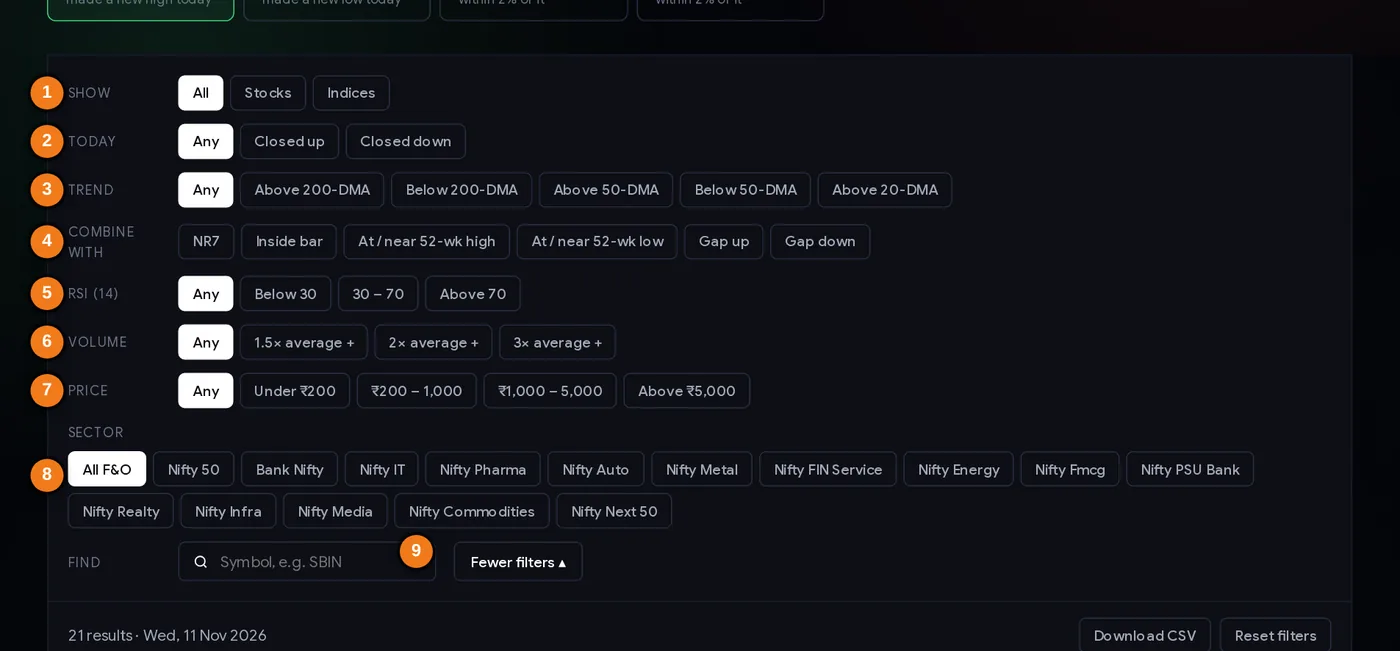
- 1Show: stocks or indices
- 2Today: closed up or down
- 3Trend: versus the 20-, 50- or 200-day average
- 4Combine with another setup
- 5RSI (14)
- 6Volume versus the 20-day average
- 7Price band
- 8Sector (index membership)
- 9Find a symbol
The filters
- Show: stocks, indices or both.
- Today: closed up or down on the day.
- Trend: close versus the 20-, 50- or 200-day average (DMA).
- Combine with: NR7, inside bar, gap up or gap down on the same day.
- More filters: RSI band, volume (1.5×, 2×, 3× the 20-day average), price band and sector.
- Find: jump to a symbol. Filters are kept in the page address for bookmarking.
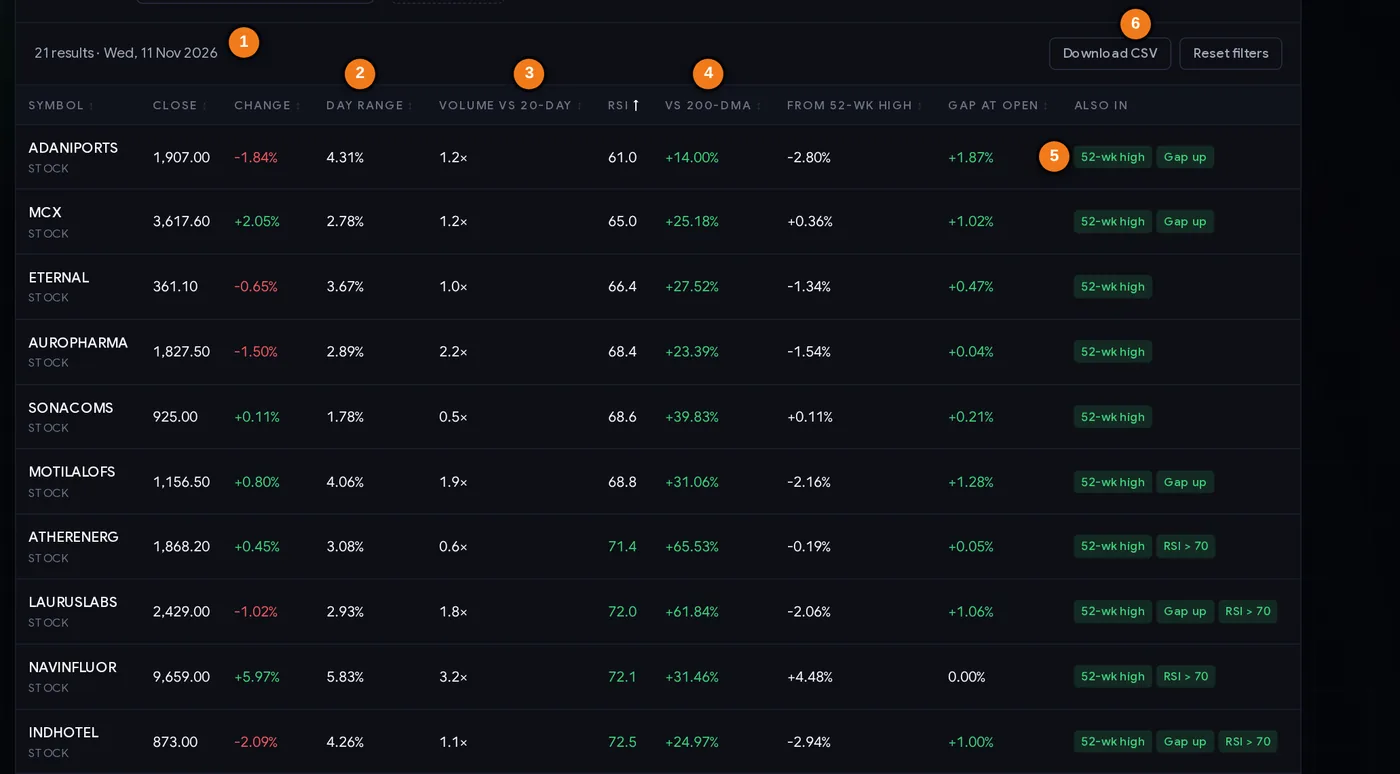
- 1Result count and scan date
- 2Day range %
- 3Volume versus the 20-day average
- 4Distance from the 200-day average
- 5Other scans the stock matched today
- 6Download the list as CSV
Every column explained
| Column | What it tells you |
|---|---|
| Close / Change | Today’s close and % change. |
| Day range | (High − Low) ÷ Close: how wide today’s candle was. |
| Volume vs 20-day | Today’s volume against the 20-day average. The default sort. 2× or more on a new high shows real participation. |
| RSI | 14-day momentum. New highs often carry RSI above 70; that alone is not a reason to sell. |
| vs 200-DMA | How far above the 200-day average. A stock 40% above it is stretched; a fall back is common. |
| From 52-wk high | Close versus the previous 52-week high. For new highs it is often slightly positive (the close is above last year’s high); a negative number on a new high means the stock touched the high but closed below it. Near highs show 0% to −2%. |
| Gap at open | A new high reached on a gap (often news or results) behaves differently from one reached gradually. |
| Also in | Other scans matched today: NR7, inside bar, gap, RSI, golden cross, SuperTrend. |
Step by step: an evening routine
- Open the scanner in the evening (after about 8 PM IST, when NSE’s daily file is processed). Check the scan date.
- Note the counts of new highs and new lows. Many highs and few lows means a broad, healthy market; the reverse is a warning.
- Start with “New 52-week high”, volume 1.5× or more. These are breakouts with participation.
- Look at the candle. Did it close near the day’s high (strong) or far below it (rejection, like Dr. Reddy’s)? Use the Change and Day range columns and your chart.
- Check stretch. “vs 200-DMA” above +30–40% means the stock has run far; risk of a pullback is higher.
- Check events. Was today’s high made on results? See results moves.
- Pick 2–3 names, write down the old 52-week high (now a possible support), your entry idea and your stop.
- Use the near-high tab as a watchlist for the coming days: stocks pausing within 2% of the level.
Three playbooks
Playbook A: the volume breakout
- New 52-week high, volume 2× or more, close in the top part of the day’s range.
- Entry: next day, only if the price holds above the old 52-week high (for example, a 30-minute close above it).
- Stop: below the breakout day’s low, or a fixed % below entry.
- Exit: trail the stop under higher lows. Our data suggests the edge, if any, played out over weeks, not days.
Playbook B: buy the retest
Many breakouts come back to test the old high in the following days. Traders wait for the price to pull back to that level, hold it (a candle that dips and closes above), and enter with a stop just below. This gives a better price than chasing the breakout day, at the cost of missing stocks that never come back.
Playbook C: the investor’s strength filter
Longer-term investors use the new-high list as a starting point for research: strong price plus good fundamentals. They cross-check growth with quarterly growers or high ROE stocks, and simply avoid buying names on the new-low list.
Risk first. New highs often come with big daily swings. Decide your stop, then size the position with the position size calculator.
Case studies from 2026
Four real new 52-week highs. Prices in ₹ from NSE’s daily files, adjusted for corporate actions.
1. Divi’s Laboratories, 14 Jul 2026: the breakout that kept going
New 52-week high (day’s high 7,208.50) on 3.25× its 20-day volume, closing near the top at 7,188.50. The next day it rose another 1.2% to 7,273. It kept making new highs on 29 Jul and 3 Aug, and 20 sessions after the first signal it was 19.3% higher. This is the textbook case: strong close, heavy volume, follow-through.
2. Bajaj Auto, 31 Aug 2026: up first, then a long slide
New high at 12,130 on 1.56× volume, closing at the day’s high. The next day it went higher still, to 12,470 (close 12,361). Twenty sessions after the signal it was 10.9% lower, and by 8 Oct it had fallen to 9,637, with RSI near 18. Lesson: a good breakout day does not protect you; a trailing stop below the breakout low would have exited early in the slide.
3. Apollo Hospitals, 23 Sep 2026: the immediate failure
New high at 9,070.50 on 1.56× volume, closing at 9,069. The next day it opened at 9,069, never traded higher and closed at 8,888.50 (−2.0%). Five sessions later it was 10% below the signal close and 20 sessions later 14.8% below. A stop just under the breakout day’s low (8,865) was hit on 25 Sep, two sessions later (low 8,821.50), for a loss of about 2–3%. Without it, the trader would have been holding on 30 Sep, when the stock fell as low as 8,053.
4. Dr. Reddy’s, 29 Jun 2026: the rejection candle
New intraday high at 1,414.90 on a 2.8% gap and 5.7× volume, but a close of 1,375.70, far below the high. Twenty sessions later the stock was 16.4% lower. Lesson: where the stock closes on the breakout day matters. A new high that cannot hold into the close is a warning, not a confirmation.
Common mistakes
- Buying every new high the next morning. Next-day direction was 50/50 in our data.
- Ignoring the close. A high touched intraday and rejected (Case 4) is weaker than a close at the high (Case 1).
- Ignoring market-wide days. When 30 stocks make highs together, the market is doing the work; individual setups add less.
- No stop because “it’s strong”. Case 3 lost 15% in a month after a new high.
- Treating RSI above 70 as an automatic sell. Strong stocks stay overbought for weeks; Divi’s did.
- Bottom-fishing new lows without a plan. New lows lagged the average stock over 60 days in our test.
- Forgetting results. Highs made on results days can reverse quickly when the excitement fades.
Pre-trade checklist
- Scan date is the latest trading day; note the market-wide count of highs and lows.
- New high on 1.5–2× volume or more.
- Close in the upper part of the day’s range (no big rejection wick).
- Not extremely stretched above the 200-DMA.
- No results or big event before your planned exit (or you accept that risk knowingly).
- Entry only if the price holds above the old high.
- Stop below the breakout day’s low; position size from that stop.
- Plan to trail the stop rather than aim for one fixed exit price.
Glossary
| 52-week high / low | The highest / lowest price of the last 52 weeks (about 252 sessions). |
| Near high / near low | Close within 2% of the 52-week high / low. |
| Momentum | The tendency of recent strong stocks to keep doing relatively well for a while. |
| Overhead supply | Holders waiting to sell at their old buying price. |
| Breakout | Price moving above a key level, here the old 52-week high. |
| Retest | A pullback to the level that was just broken. |
| Volume ratio | Today’s volume divided by the 20-day average. |
| Market breadth | How many stocks take part in a move (e.g. new highs versus new lows). |
| Adjusted prices | Past prices corrected for splits and bonuses so levels stay comparable. |
Questions
Which stocks are at a 52-week high today?
ChartMine’s 52-week high scanner lists every F&O stock and index that made a new 52-week high (or is within 2% of one) after each trading day, with volume, RSI and trend. The latest scan is shown first.
Is buying stocks at a 52-week high a good strategy?
In ChartMine’s test (Oct 2025 to Nov 2026) new 52-week highs beat the average F&O stock by about 1.2% over the next 20 sessions, but only 54% of them did. It is a mild momentum effect, not a reliable signal, so a stop loss is essential.
What does a 52-week low mean for a stock?
The stock traded at its lowest price of the past year. It shows selling pressure. In our test new lows bounced a little in the short term but lagged the average stock over 60 days.
How is the 52-week high calculated?
The highest daily high of the previous 252 trading sessions, using prices adjusted for splits and bonuses. A new high is when today’s high reaches or exceeds it.
Why does volume matter on a 52-week high breakout?
Volume shows participation. A new high on 1.5 to 2 times the normal volume means many buyers joined. In our data, high-volume new highs did slightly better over 60 days, but not over 20.
What is the difference between a 52-week high and an all-time high?
A 52-week high looks back one year; an all-time high looks back over the stock’s whole history. Every all-time high is also a 52-week high, but not the other way round.