
☰ All tutorials
Start here
Tool tutorialsHow to trade with ChartMineStocks
Stock monitorMy watchlistStock scores & checklistMarket & sectors
Nifty 50Bank NiftySensexFin NiftyDaily market reportMarket breadthSector rotationSector heatmapStock screenerRelative strength (RS)MCX commodity pricesFear & Greed IndexWhat happens after…Scanners
Top gainers & losersStocks to watch tomorrowNR7 stocks scannerInside bar stocks52-week high stocksGap up & gap down stocksRSI oversold stocksGolden cross stocksSuperTrend buy stocksScan builderEMA 9/21 crossoverMACD crossoverADX strong trendBollinger breakout / squeezeVolume spike stocksOpen = high / open = lowCandlestick pattern scannerNarrow CPR scannerF&O data
F&O ban listOI build-upOption chainPCR & max painExpiry calendarF&O lot sizesOI build-up heatmapPCR trendMax pain trendFutures basisStock screens
Quarterly growersProfit growth stocksLow P/E stocksMutual fund buyingNear 52-week low, growingDebt-free companiesHigh ROE & ROCEMagic Formula stocksLow price-to-bookSmart money
FII / DII dataShareholding changesBig-money footprintShort selling dataF&O positions by participantBulk & block dealsPromoter buyingDelivery percentageCalendars
Results calendarQuarterly results trackerBoard meetingsCorporate actionsIPO calendarIPO performanceResearch & planning
Strategy testerCompare stocksDividend yield stocksASM / GSM listExpiry-day movesSeasonality & stock historyNSE holidays 2026Position size calculatorOption payoff calculatorPivot point calculatorMore
Stock scanners hubStock screensHow to use the Dividend yield stocks page
A plain-language guide to dividend yield on NSE stocks: how ChartMine calculates it, ex-date and record date, the types of high-yield stock, what our data says about yield traps, how to read every column, and four real case studies.
What dividend yield means, in plain words
When a company makes a profit, it can keep the money to grow the business or pay part of it to shareholders as a dividend: a fixed amount in rupees for every share you own. If a company pays ₹10 a share and you hold 100 shares, ₹1,000 arrives in your bank account (before tax).
A rupee amount on its own does not tell you much. ₹10 on a ₹100 share is a lot; ₹10 on a ₹5,000 share is very little. So investors use the dividend yield:
Dividend yield = dividends paid per share in a year ÷ today’s share price × 100.
₹10 of dividends on a ₹200 share is a 5% yield. It is the dividend part of your return, like the interest rate on a deposit, but not fixed and not promised.
The Dividend yield stocks page calculates this for every actively traded NSE stock that paid a dividend in the last 12 months. For each stock it shows the yield, the rupees paid per share, how many dividends that took, the last ex-date, whether the company also paid in the 12 months before, the next announced ex-date, and how the share price moved over the year.
On 9 Nov 2026 the page listed 997 stocks that paid a dividend in the last 12 months; 75 had a trailing yield of 3% or more; 893 had paid in both of the last two 12-month periods; and 30 had a next ex-date already announced.
The words you need: ex-date, record date, trailing yield
| Term | Meaning |
|---|---|
| Ex-date | The first day the share trades without the right to the coming dividend. To get the dividend you must own the share before the ex-date, that is, buy it on or before the trading day before. |
| Record date | The date on which the company checks who its shareholders are. With India’s T+1 settlement, the ex-date and record date are usually the same day. |
| Interim / final dividend | Interim dividends are paid during the financial year; the final dividend after the annual results, approved at the AGM. |
| Special dividend | A one-off extra payment, often from a large one-time gain or surplus cash. It may not come again. |
| Trailing yield | The yield from dividends already paid in the last 12 months. This is what the page shows. |
| Forward yield | A yield based on dividends expected in the next 12 months. It is a guess, so the page does not use it. |
| Payout ratio | The share of profit paid as dividends. A company paying out more than it earns cannot keep doing so for long. |
How the page calculates the yield
- It takes every dividend with an ex-date in the last 12 months (ending on the latest trading day), from NSE’s corporate-action filings.
- It adds them up per share, adjusting older amounts for any later bonus issue or split so they match today’s share count.
- It divides by the latest closing price.
- For the Both years column it checks whether the company also paid anything in the 12 months before that.
Types of high-yield stock you will meet
| Type | What it looks like | What to check |
|---|---|---|
| Steady payer | Pays every year, often several times, with similar amounts. | Are profits stable enough to keep paying? |
| Special-dividend spike | One big one-off payment makes the yield jump for 12 months. | Read the filing: does it say “special”? Is “Both years” blank? |
| Falling-price yield | The dividend is unchanged but the price fell, so the yield rose. | Why did the price fall? Can the company keep paying? |
| Timing quirk | Two payments that usually fall in different years both land inside the same 12-month window. | Look at the dividend dates and amounts, not just the total. |
Why investors look at dividend yield: advantages and limits
✅ Cash you actually receive
A dividend is money in your account, not a number on a screen. Many long-term investors like that discipline.
✅ A sign of real profits
A company that pays steadily for years usually has real, cash-generating profits. Paper profits cannot pay dividends for long.
✅ Part of total return
Your return is price change plus dividends. Price charts alone understate what holders of high-dividend stocks earned.
✅ A quick screen
The page turns hundreds of filings into one sortable table with the history check already done.
The limits (read this before sorting by yield)
- It looks backwards. A trailing yield tells you what was paid, not what will be paid. Dividends can be cut or stopped.
- A falling price pushes the yield up. We grouped the 997 payers by yield and looked at their share price over the last year (data to 6 Nov 2026):
| Trailing yield | Stocks | Median 1-year price change | Share whose price fell |
|---|---|---|---|
| Below 1% | 628 | −0.6% | 51% |
| 1% to 2% | 178 | −11.4% | 70% |
| 2% to 3% | 77 | −13.1% | 70% |
| 3% to 5% | 47 | −20.0% | 89% |
| 5% and above | 28 | −14.6% | 79% |
This does not prove that high-yield stocks are bad investments; much of it is arithmetic (a lower price means a higher yield for the same dividend). But it does show that the top of a yield list is crowded with shares that have fallen, and you need to know why each one fell.
- One-off payments distort it. Special dividends can double or triple a yield for exactly 12 months (case studies 1 to 3).
- The price usually drops on the ex-date. Across 1,532 dividends of 0.5% or more since mid-2024, the median stock opened about 49% of the dividend lower than the previous close and closed the ex-date about 98% of it lower (from our corporate actions study). Buying just before the ex-date to “collect” the dividend therefore does not create free money.
- Tax. In India dividends are added to your income and taxed at your slab rate, so the after-tax yield is lower than the number shown.
A tour of the page
Open Dividend yield stocks. At the top are four counts, then a chart of the 15 highest yields among steady payers, then the full table.
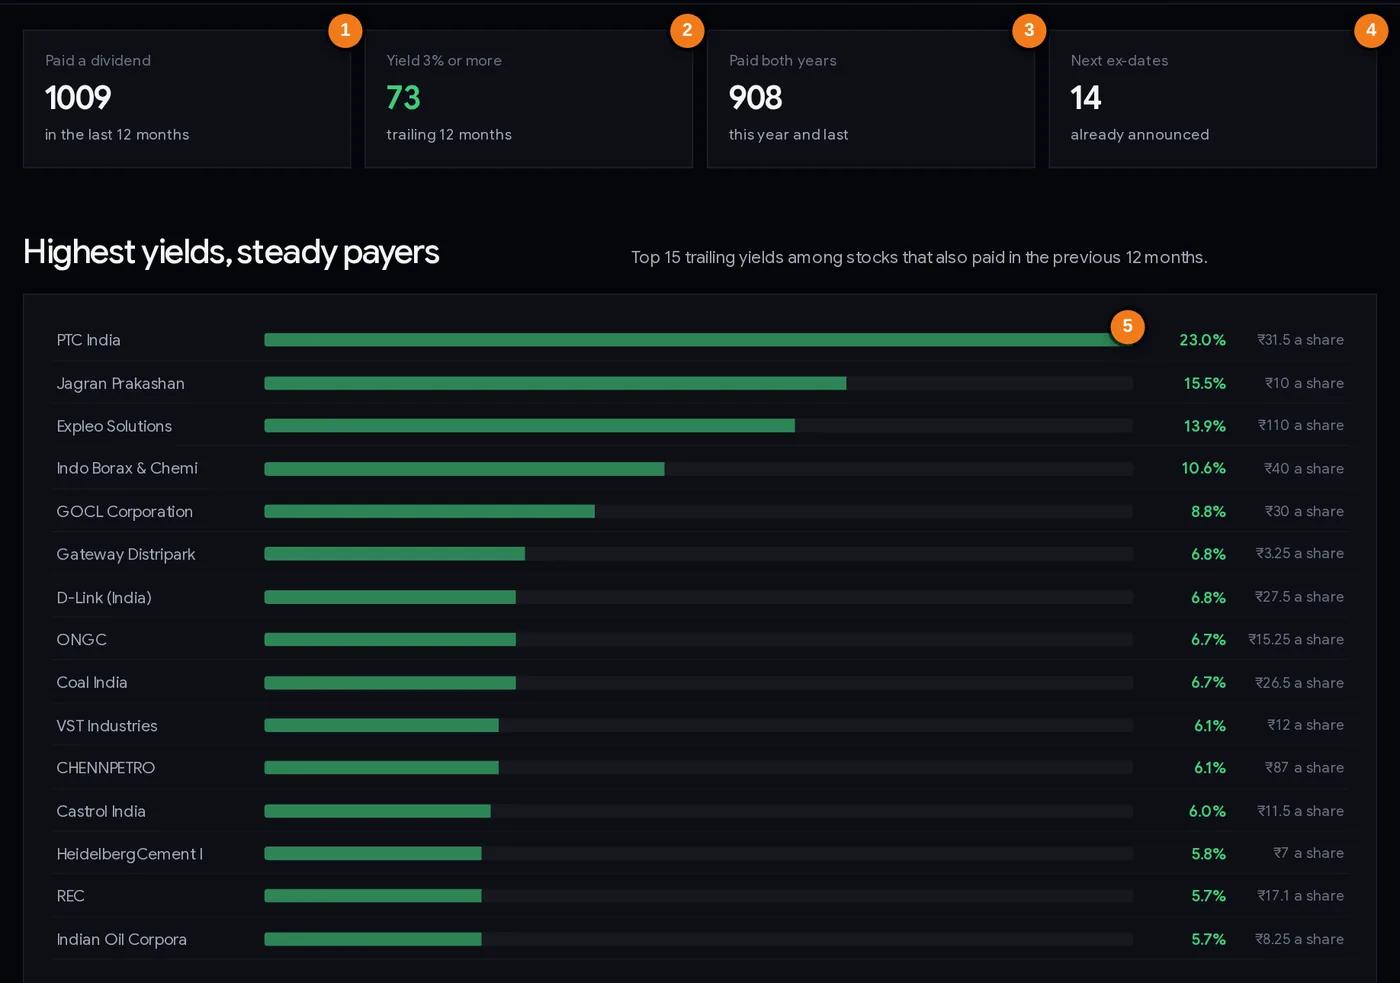
- 1Stocks that paid a dividend in the last 12 months
- 2How many yield 3% or more
- 3How many paid in both of the last two 12-month periods
- 4Upcoming ex-dates already announced
- 5Each bar: trailing yield and rupees per share over 12 months
The Highest yields, steady payers chart only includes companies that paid in both 12-month periods, which removes many first-time and one-off payers. It can still include one-off or unusually large payments from companies that also paid the year before: on 9 Nov 2026 Jagran Prakashan’s ₹10 included a ₹3 special dividend, and PTC India’s total was lifted by an unusually large ₹23 payment (case study 2). Click a bar to open the stock’s page.
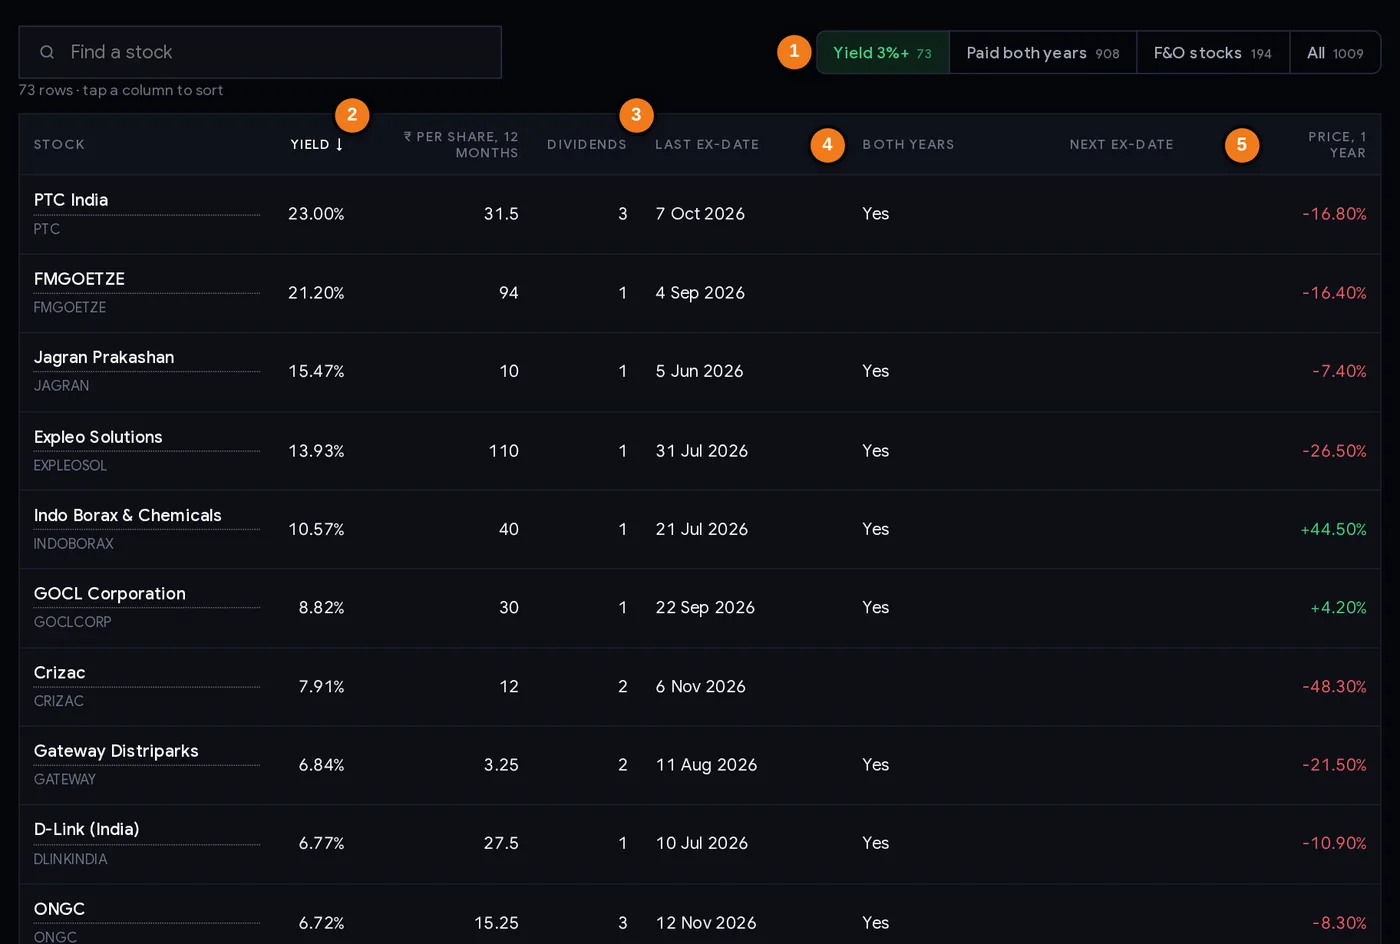
- 1Filters: Yield 3%+, Paid both years, F&O stocks, All
- 2Trailing 12-month yield
- 3Number of dividends behind the total
- 4Whether the company also paid the year before
- 5Share price change over one year
Every column explained
| Column | What it tells you |
|---|---|
| Stock | Company name; click to open its ChartMine page. |
| Yield | Trailing 12-month dividends ÷ latest close. |
| ₹ per share, 12 months | The rupee total behind the yield, adjusted for later bonus issues and splits. |
| Dividends | How many separate dividends make up that total. A total from one payment deserves a closer look. |
| Last ex-date | The most recent ex-date within the 12 months. |
| Both years | “Yes” if the company also paid in the previous 12 months. Blank means this year’s payment may be a first or a one-off. |
| Next ex-date | An announced upcoming ex-date and amount, if the company has filed one. |
| Price, 1 year | How the share price moved over the last year. A big fall here is often the reason for a big yield. |
The filter buttons
- Yield 3%+ (default): only trailing yields of 3% or more.
- Paid both years: only companies that paid in both 12-month periods.
- F&O stocks: only stocks with futures and options, usually large and liquid companies.
- All: every payer. Use Find a stock to jump to one name. Click any header to sort.
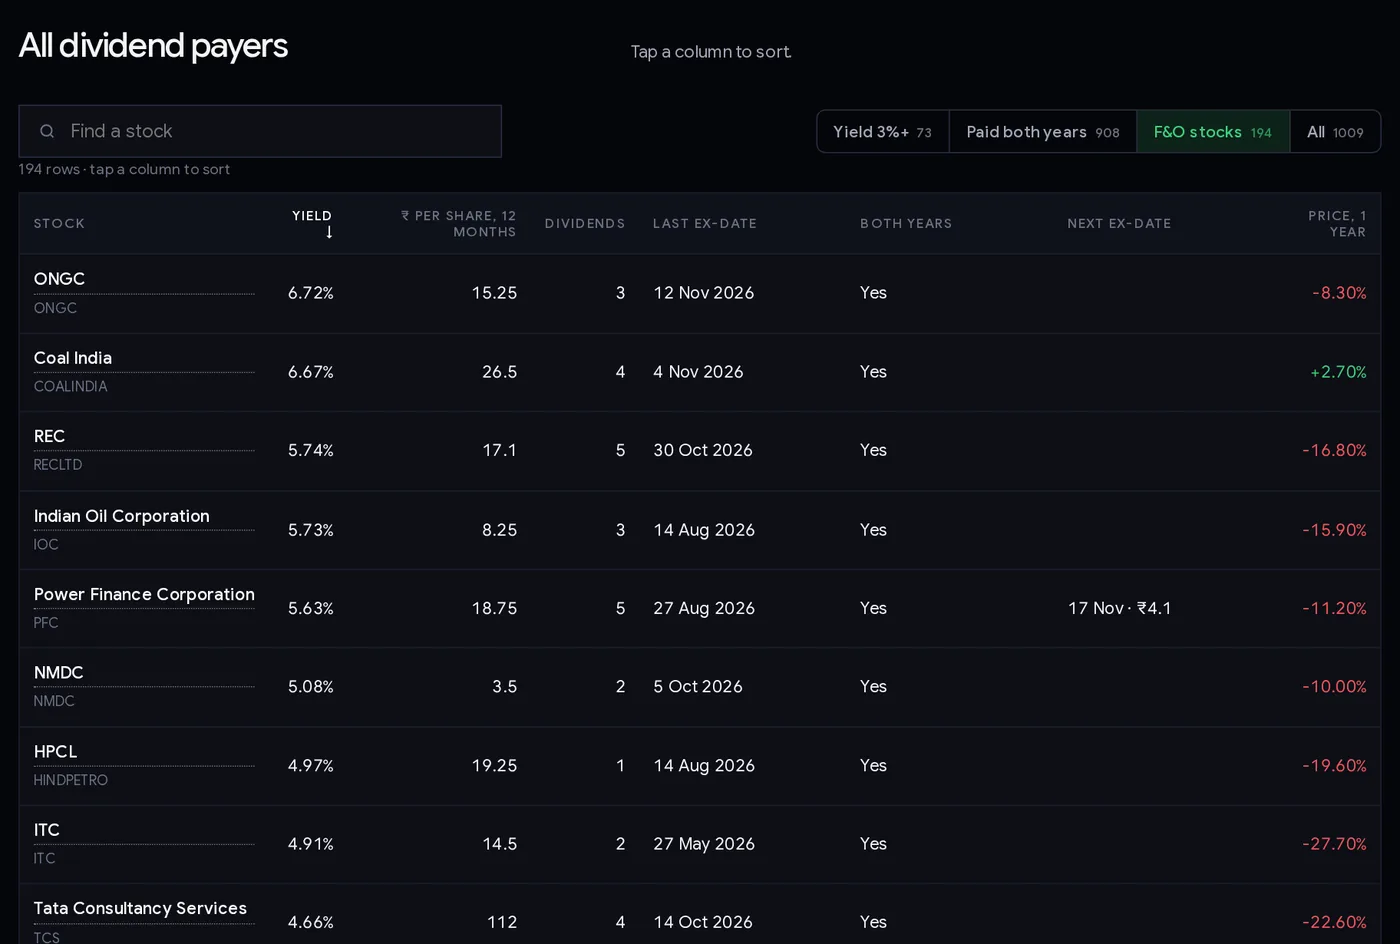
The F&O view is a useful starting point for beginners because it is limited to large, heavily traded companies. On 9 Nov 2026 it was led by Coal India (6.6%), REC, ONGC, PFC and IOC, all with yields between 5.6% and 5.8%.
Step by step: checking a high-yield stock (15 minutes)
- Start with “Paid both years”, then sort by Yield. This removes most first-time payers.
- Look at “Dividends” and “₹ per share”. Is the total made of several similar payments, or one large one?
- Open the stock’s corporate actions and read the dividend descriptions. Words like “special” mean a one-off.
- Check “Price, 1 year”. If the price fell 20–30%, find out why: results, sector trouble, debt, regulation.
- Check profits. On the stock’s page and in quarterly results, are profits stable or falling? Dividends come out of profits and cash.
- Work out a “normal” yield. Remove any special dividend and divide the regular payments by today’s price. That is a more honest number to compare.
- Look at the next ex-date if one is announced, and remember the price usually falls by most of the dividend on that day.
- Think after tax. At a 30% slab, a 5% yield is roughly 3.5% in your hand.
- Decide position size as you would for any stock. A dividend does not protect you from a price fall.
Three ways investors use the page
Playbook A: the steady-income shortlist
Filter Paid both years, keep yields between about 2% and 6%, and prefer stocks with several dividends a year and a price that has not collapsed. Then check that profits support the payout. The goal is a list of companies with a long habit of paying, not the highest number on the page.
Playbook B: the yield-trap check
Before buying anything because of a big yield, run the three tests from the case studies: Is it a special dividend? Did two payments land in one window? Did the price fall sharply? If the answer to any is yes, recalculate the yield on regular payments only and decide again.
Playbook C: dividends as part of total return
When you compare stocks on price charts (for example with Compare stocks, which shows price only), add the dividend yield back mentally. A stock that was flat on price but paid 6% a year did better for its holders than the chart shows.
A dividend is not a safety net. A 6% yield is wiped out by a 6% price fall. Spread your money across several companies and sectors, size each position with your own limits, and never buy only because of the yield.
Case studies (page of 9 Nov 2026, prices to 6 Nov 2026)
Dividend amounts are from NSE corporate-action filings; prices are closing prices on 6 Nov 2026.
1. FM Goetze: a 20% yield from one special payment
The page showed a 20.15% yield on ₹94 a share, from a single ex-date (4 Sep 2026). The filing reads: interim dividend ₹7.50 and special dividend ₹86.50. “Both years” was blank. At the 6 Nov close of ₹466.40, the regular ₹7.50 alone is a yield of about 1.6%. Lesson: one dividend, a blank “Both years” and a huge yield almost always mean a one-off.
2. PTC India: a steady payer having an unusual year
PTC topped the steady-payer chart at 22.6%: ₹31.50 a share from three dividends (₹3 on 20 Feb 2026, ₹23 on 10 Aug 2026 and ₹5.50 on 7 Oct 2026). In the 12 months before, it paid ₹11.70 (₹5 in May 2025 and ₹6.70 in Aug 2025). At the 6 Nov close of ₹139.45, last year’s level would be a yield of about 8.4%: still high, but far from 22.6%. The share price was also down 16.4% over the year. Lesson: “Both years” says the company pays regularly, not that this year’s amount is normal. Look at the individual payments.
3. Sanofi India: two Novembers in one window
Sanofi India showed 6.0%: ₹198 from ₹75 (7 Nov 2025), ₹48 (22 Apr 2026) and ₹75 (5 Nov 2026). Its November interim fell just inside the start of the 12-month window and again at the end, so two interims were counted. One interim plus the final (₹123) on the ₹3,283.10 close is about 3.7%. The share price had also fallen 31.4% over the year. Lesson: a trailing window can catch two payments that normally belong to different years; check the dates.
4. Coal India: what a steady payer looks like
Coal India yielded 6.6% on the ₹400 close: ₹26.50 from four dividends (₹5.50 in Feb, ₹5.50 in Jul, ₹5.25 in Sep and ₹10.25 on 4 Nov 2026). In the previous 12 months it had paid exactly the same total, ₹26.50, also in four parts, and the share price was up 2.9% over the year. Lesson: several similar payments, year after year, with a stable price, is the pattern behind a dependable yield. Even so, the dividend depends on the company’s future profits and policy and is never promised.
Common mistakes
- Sorting by yield and buying the top. The top is full of special dividends and falling prices.
- Ignoring “Both years” and “Dividends”. These two columns catch most one-offs.
- Buying just before the ex-date to collect the dividend. The price usually falls by most of the dividend that day, and the dividend is taxed.
- Forgetting tax. The yield shown is before tax.
- Treating a high yield as safe. A falling business can cut its dividend and its price at the same time.
- Comparing with a fixed deposit as if equal. A deposit’s interest is contracted; a dividend is not, and the share price can fall.
- Holding too few names. Income from one or two companies can disappear with one board decision.
High-yield stock checklist
- The company paid in both 12-month periods.
- The total comes from several regular payments, not one special.
- No two payments from different years are bunched into one window.
- I know why the share price moved over the year.
- Profits look able to support the payout.
- I worked out a “normal” yield on regular payments and after tax.
- I know the next ex-date, if any, and that the price usually drops on it.
- Position size fits my risk limits; I am not relying on one company for income.
Glossary
| Dividend | A cash payment per share from a company to its shareholders. |
| Dividend yield | Dividends per share in a year ÷ share price × 100. |
| Trailing yield | Yield from dividends already paid in the last 12 months. |
| Ex-date | The first day a share trades without the right to the coming dividend. |
| Record date | The date the company uses to decide who receives the dividend. |
| Interim / final dividend | Paid during the year / after the annual results. |
| Special dividend | A one-off extra payment that may not repeat. |
| Payout ratio | The share of profit paid out as dividends. |
| Yield trap | A stock whose high yield comes from a falling price or a one-off payment rather than a sustainable dividend. |
| Total return | Price change plus dividends received. |
Questions
Which stocks have the highest dividend yield in India?
ChartMine’s Dividend yield stocks page ranks every actively traded NSE stock by its trailing 12-month yield and updates daily. Before relying on a high number, check whether the company paid in both years, how many dividends make up the total, and whether a special dividend or a falling price is behind it.
How is dividend yield calculated?
Add up the dividends per share with ex-dates in the last 12 months (adjusted for later bonus issues and splits) and divide by today’s share price. ₹10 of dividends on a ₹200 share is a 5% yield.
Is a high dividend yield good?
Not by itself. A yield can be high because the share price has fallen or because of a one-off special dividend. On 9 Nov 2026, stocks yielding 3% to 5% had a median one-year price change of −20%. Check the dividend history and the company’s profits.
What is an ex-dividend date?
The first day a share trades without the right to the upcoming dividend. To receive the dividend you must buy the share before the ex-date. With T+1 settlement in India, the ex-date and record date are usually the same day.
How are dividends taxed in India?
Dividends are added to your income and taxed at your income-tax slab rate, so your after-tax yield is lower than the yield shown. Companies may also deduct TDS above a threshold.
What is a dividend yield trap?
A stock that looks attractive because of a high yield, where the yield comes from a collapsing share price or a one-time special payment rather than a dividend the company can keep paying.