
☰ All tutorials
Start here
Tool tutorialsHow to trade with ChartMineStocks
Stock monitorMy watchlistStock scores & checklistMarket & sectors
Nifty 50Bank NiftySensexFin NiftyDaily market reportMarket breadthSector rotationSector heatmapStock screenerRelative strength (RS)MCX commodity pricesFear & Greed IndexWhat happens after…Scanners
Top gainers & losersStocks to watch tomorrowNR7 stocks scannerInside bar stocks52-week high stocksGap up & gap down stocksRSI oversold stocksGolden cross stocksSuperTrend buy stocksScan builderEMA 9/21 crossoverMACD crossoverADX strong trendBollinger breakout / squeezeVolume spike stocksOpen = high / open = lowCandlestick pattern scannerNarrow CPR scannerF&O data
F&O ban listOI build-upOption chainPCR & max painExpiry calendarF&O lot sizesOI build-up heatmapPCR trendMax pain trendFutures basisStock screens
Quarterly growersProfit growth stocksLow P/E stocksMutual fund buyingNear 52-week low, growingDebt-free companiesHigh ROE & ROCEMagic Formula stocksLow price-to-bookSmart money
FII / DII dataShareholding changesBig-money footprintShort selling dataF&O positions by participantBulk & block dealsPromoter buyingDelivery percentageCalendars
Results calendarQuarterly results trackerBoard meetingsCorporate actionsIPO calendarIPO performanceResearch & planning
Strategy testerCompare stocksDividend yield stocksASM / GSM listExpiry-day movesSeasonality & stock historyNSE holidays 2026Position size calculatorOption payoff calculatorPivot point calculatorMore
Stock scanners hubStock screensHow to use the Scan builder
A plain-language guide to building your own end-of-day stock scan: every kind of condition, how ALL and ANY work, a tour of the screen, the seven ready-made scans, three playbooks and real case studies from 13 Nov 2026.
What a scan builder is, in plain words
A stock scan is a question you ask the whole market at once. “Which stocks closed above their 200-day average but have an RSI below 40?” “Which stocks traded twice their normal volume and closed higher?” Doing this by hand means opening hundreds of charts. A scan answers it in a second.
Most scanners on ChartMine ask one fixed question each: the NR7 scanner looks for narrow days, the RSI scanner for stretched RSI, and so on. The scan builder lets you ask your own question by combining conditions: numbers (RSI, volume, delivery %, returns), trend tests (price above the 200-day average, SuperTrend up) and ready-made signals (MACD crossover, Bollinger squeeze, hammer candle).
It runs on every actively traded NSE stock that has enough price history, about 1,300 stocks (1,304 for the session of Friday 13 Nov 2026), not just the roughly 220 F&O stocks the pattern scanners cover. The data comes from NSE’s own end-of-day files, adjusted for splits and bonuses, and is refreshed every trading evening.
One line to remember: a scan is a filter. It gives you a short list of stocks that fit a description. It does not tell you which of them will go up, and it is not a buy or sell signal.
Everything happens in your browser: the page downloads the day’s data once, and every condition you add re-filters the list instantly. Nothing you build is sent to ChartMine.
The three kinds of conditions
Every scan is made of conditions. There are three kinds, each with its own button.
1. Number conditions (“+ Number condition”)
Pick a number, a comparison (≥, ≤, > or <) and a value. For example RSI (14) ≤ 40.
| Group | Numbers you can test | What they mean |
|---|---|---|
| Price | Price ₹, change today %, opening gap %, day range %, from 52-week high %, above 52-week low % | Where the stock closed and how it moved today. “From 52-week high” is negative when below the high (−3 means 3% below it). |
| Returns | Return 1 week, 1 month, 3 months, 1 year (%), RS rating (1–99) | How the stock has done over time. RS rating compares its 1-year performance with every other stock: 90 means it beat about 90% of them. |
| Volume | Volume × 20-day average, delivery %, turnover ₹ Cr (median) | How busy the stock was. 2 means twice its usual volume. Turnover is the stock’s typical daily traded value, a liquidity check. |
| Indicators | RSI (14), ADX (14), +DI, −DI, MACD line, MACD histogram, Bollinger width % | Standard technical indicators on daily closes (explained in the glossary). |
2. Trend conditions (“+ Trend condition”)
Yes/no tests about the trend: price above the 20-, 50- or 200-day average; price below the 200-day average; 50-day average above the 200-day; 9 EMA above 21 EMA; SuperTrend (10, 3) up or down; +DI above −DI; MACD above zero; and F&O stock (keeps only stocks with futures and options).
3. Signals and patterns (“+ Signal or pattern”)
38 ready-made events, the same ones the individual scanners use:
- Crossovers: 9/21 EMA bullish or bearish (last 3 sessions), MACD bullish or bearish (last 3 sessions), golden or death cross (last 5 sessions), SuperTrend buy or sell flip (last 3 sessions).
- Trend strength and volatility: ADX 25+ uptrend or downtrend, ADX rising, close above or below the Bollinger Bands, Bollinger squeeze (narrowest bands in 120 days).
- Volume and the open: volume 2× or 3×, open = high, open = low.
- Price levels: new 52-week high or low, within 2% of either, NR7, inside bar, gap up or down 1%+, gap not filled, RSI below 30 or above 70.
- Candlesticks: doji, hammer, bullish and bearish engulfing, morning star, evening star, shooting star, bullish and bearish marubozu.
How conditions are combined: ALL, ANY, sector and blanks
Four rules decide which stocks appear. Knowing them saves a lot of confusion.
| Rule | What happens |
|---|---|
| Match ALL | A stock must pass every condition. Each new condition makes the list shorter. |
| Match ANY | A stock needs to pass just one condition. Each new condition makes the list longer. |
| Sector | The sector box always applies on top, in both modes. It uses NSE’s industry groups (Capital Goods, Financial Services, Healthcare and so on). |
| Blank value | A number condition with an empty value box is ignored until you type a number. |
| Missing data | A stock with no value for a number fails that condition. For 13 Nov 2026, 95 stocks had no RS rating (mostly recent listings) and 65 had less than 200 days of history, so they drop out of any scan that tests those. |
A real example of why ALL and ANY matter: the ready-made Trend change up scan (9/21 EMA bullish crossover, MACD bullish crossover, SuperTrend buy flip) found 401 stocks on 13 Nov 2026 with Match ANY. Switching the same three conditions to Match ALL gave 0: not one stock had all three fresh turns in the same window. Neither answer is wrong; they answer different questions.
You cannot mix ALL and ANY in one scan. If you want “any fresh turn up and F&O only”, use the ANY scan and then the F&O filter on a second pass, or download the CSV and filter it in a spreadsheet.
Why build your own scan: advantages and limits
✅ Your question, not ours
Fixed scanners answer one question each. The builder lets you describe exactly the setup you trade, in your words, and see today’s list.
✅ The whole market
About 1,300 stocks, including small and mid caps the F&O scanners never see.
✅ Repeatable
Save a scan once and run the same rules every evening. Consistent rules make it easier to judge what works for you.
✅ Easy to share
The conditions live in the link. Send it to a friend or keep it as a bookmark; it opens the same scan on the latest data.
The limits (please read this part)
- End of day only. The data is the last session’s close, refreshed in the evening. It does not change during market hours.
- No back-test inside the builder. It shows today’s matches, not how the rules did in the past. To test rules, use the strategy tester or keep a written log of your saved scan’s results.
- Big numbers can be misleading. On 13 Nov 2026 the top “volume” stock traded 219× its normal volume, but only 4.12% of those shares were taken for delivery. Most of that activity was same-day trading, not long-term buying.
- A filter is not an edge. A list of stocks that fit a description is a starting point. Our own test of 2× volume spikes over two years found the next 20 days split almost evenly between up and down (see the volume spike page).
- Thin stocks. Some of the 1,300 stocks trade only a few lakh rupees a day. Add a turnover condition so you can actually enter and exit.
A tour of the scan builder screen
Open the scan builder. The page has three parts, top to bottom: ready-made scans, your conditions, and the results table.

- 1Breakout with volume: near the 52-week high on 1.5× volume.
- 2Big buyers today: 2× volume, price up, delivery 50%+.
- 3Trend change up: any fresh EMA, MACD or SuperTrend turn (Match ANY).
Tap any ready-made scan and its conditions load into the box below. You can then change or remove any of them.
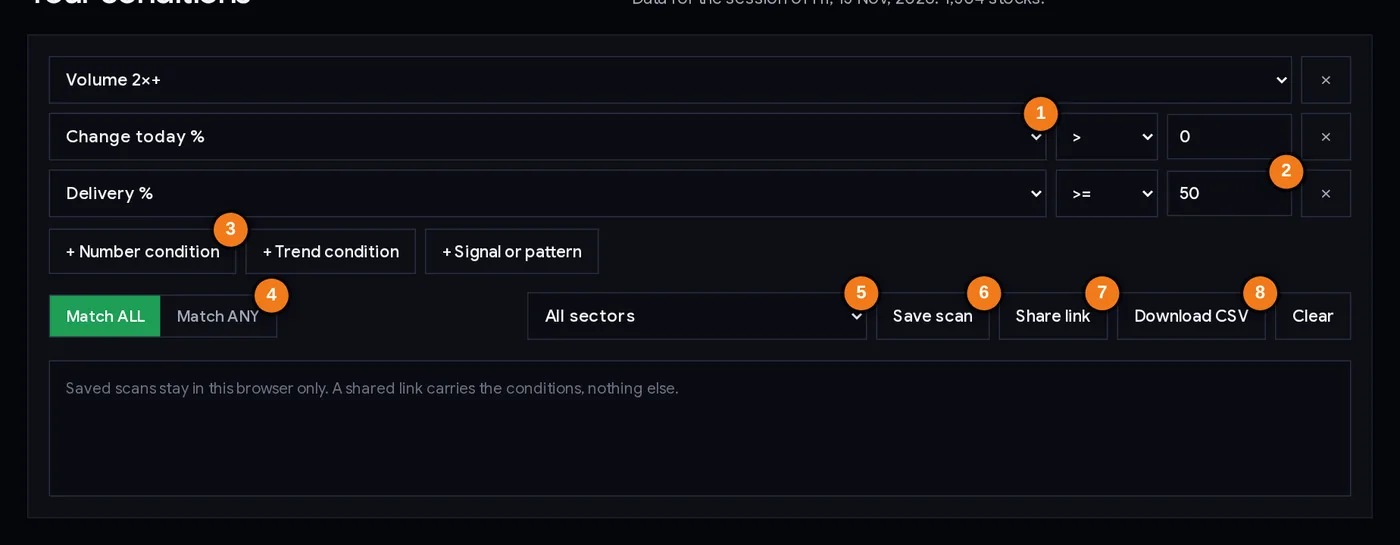
- 1A number condition: pick the number and the comparison.
- 2The value to compare with (here delivery ≥ 50%).
- 3Add a number, trend or signal condition.
- 4Match ALL or Match ANY.
- 5Limit to one sector.
- 6Save the scan in this browser.
- 7Copy a link with the conditions.
- 8Download every match as CSV.
The controls
| Control | What it does |
|---|---|
| Condition rows | Each row is one condition. Change the dropdown, the comparison or the value and the results update instantly. The × removes the row. |
| + Number / + Trend / + Signal | Add a new row of that kind. A new number row starts as “RSI ≤ (blank)”, which does nothing until you type a value. |
| Match ALL / Match ANY | Every condition must pass, or any one is enough. |
| All sectors | Limit the list to one NSE industry group. |
| Save scan | Asks for a name and stores the scan in this browser. Saved scans appear as buttons under the box; × deletes one. |
| Share link | Copies a link with the conditions inside it. The address bar also updates as you build, so a bookmark works too. |
| Download CSV | Saves every matching stock (not just the first 300 shown) with its numbers and signals, for a spreadsheet. |
| Clear | Removes all conditions and the sector. |
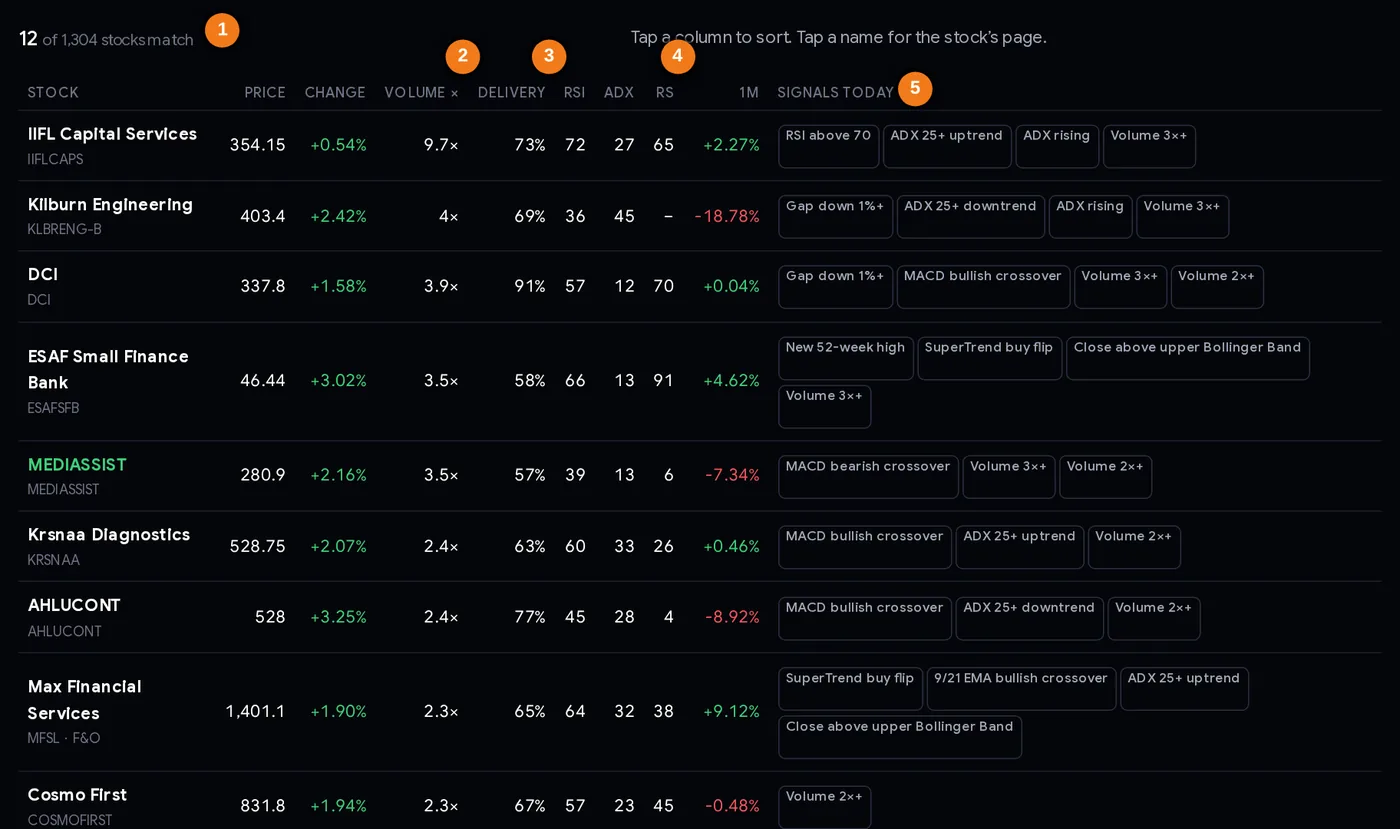
- 1How many stocks match, out of the day’s total.
- 2Volume × 20-day average (default sort).
- 3Delivery %.
- 4RS rating (1–99).
- 5Other signals the stock fired today.
The results table
| Column | What it tells you |
|---|---|
| Count | How many stocks match, out of all stocks in the day’s data, and the session date. |
| Stock | Name, NSE symbol and “F&O” if it has derivatives. Tap for the stock’s ChartMine page. |
| Price / Change | Closing price and the day’s change in %. |
| Volume × | Today’s volume divided by the average of the previous 20 sessions. The table is sorted by this, highest first. |
| Delivery | Share of today’s traded quantity that was taken for delivery (see the delivery % tool). |
| RSI / ADX | 14-day RSI and ADX. |
| RS | Relative strength rating, 1 to 99. |
| 1M | Return over the last month. |
| Signals today | Up to four signals the stock also fired, so you can spot overlaps. |
Tap any column heading to sort by it; tap again to reverse. Only the first 300 rows are shown; the CSV has all of them.
The seven ready-made scans (and what they found on 13 Nov 2026)
The ready-made scans are starting points that show how conditions fit together. Counts are for the session of Friday 13 Nov 2026, out of 1,304 stocks.
| Scan | Conditions | Idea | 13 Nov |
|---|---|---|---|
| Breakout with volume | From 52-week high ≥ −3%, volume ≥ 1.5×, change > 0 (ALL) | Strong stocks at or near their high, with extra volume. | 21 |
| Pullback in an uptrend | Price above 200-day average, RSI ≤ 40 (ALL) | A dip inside a long-term uptrend. | 17 |
| Fresh momentum | MACD bullish crossover, +DI above −DI, ADX ≥ 20 (ALL) | Momentum just turned up and the trend has some strength. | 20 |
| Bollinger squeeze, strong stock | Bollinger squeeze, RS ≥ 70 (ALL) | A quiet stock that has been a leader. | 2 |
| Big buyers today | Volume 2×+, change > 0, delivery ≥ 50% (ALL) | Heavy volume, up day, much of it taken for delivery. | 12 |
| Oversold quality | RSI ≤ 35, 1-year return ≥ 20% (ALL) | A stretched dip in a stock that has done well over a year. | 4 |
| Trend change up | 9/21 EMA bullish, MACD bullish, SuperTrend buy (ANY) | Any fresh turn up. Wide on purpose. | 401 |
Notice the range: from 2 stocks to 401. A scan that returns hundreds of names is a theme, not a shortlist. Add conditions (in ALL mode) until the list is small enough to study properly, usually 5 to 25 stocks.
The names are not recommendations. For example, the four Oversold quality stocks on 13 Nov were Thangamayil Jewellery (RSI 34.7), Rain Industries (31.3), Rashi Peripherals (34.2) and Indo Borax & Chemicals (34.6). All four were 30% to 44% below their 52-week highs: “quality” here only means a good past year, and a deep fall can keep going.
Step by step: build your first scan (10 minutes)
- Write the idea in one sentence first. For example: “liquid stocks in an uptrend that dipped, with RSI not yet oversold”.
- Open the scan builder in the evening and check the line under “Your conditions”: it shows the session date and the number of stocks. The data is usually ready by about 8 PM IST after a trading day.
- Turn each part of the sentence into a condition. “Uptrend” = Trend condition Price above 200-day average. “Dipped” = Return 1 week % ≤ −3. “RSI not yet oversold” = RSI (14) ≥ 35. “Liquid” = Turnover ₹ Cr (median) ≥ 10.
- Keep Match ALL for a shortlist. Use ANY only when you deliberately want “one of several”.
- Look at the count. Too many? Tighten a value or add a condition. Zero? Loosen one value at a time to see which condition is doing the cutting.
- Sort the table by the column that matters to your idea (RS for leaders, volume × for activity, change for the day’s move).
- Open each stock’s page and check the chart, results date and news before you form any view.
- Save the scan with a clear name (“Uptrend dip, liquid”). Tomorrow evening, tap it to run the same rules on new data.
- Share or bookmark it. Remember that saved scans live only in this browser; the link is your backup.
Liquidity rule of thumb: on 13 Nov 2026, 694 of the 1,304 stocks had a median turnover of ₹10 crore or more. Adding that one condition removes most stocks that are hard to trade in size.
Three playbooks
Playbook A: the evening shortlist (trend followers)
- Conditions (ALL): price above 200-day average, ADX ≥ 25, +DI above −DI, RSI between 50 and 70 (two rows: ≥ 50 and ≤ 70), turnover ≥ ₹10 Cr.
- Sort by RS, highest first.
- On 13 Nov 2026 this found 105 stocks, too many. Adding Return 1 week % ≤ 0 (a pause in the trend) or a sector you follow brings it to a workable list.
- For each name, mark the recent swing low as the level where the idea is wrong. Size the position with the position size calculator so a stop there costs a fixed, small share of your capital.
Playbook B: the volume check (news and big players)
- Load Big buyers today, then add Turnover ₹ Cr (median) ≥ 10.
- For each match, open the bulk and block deals page and the stock’s results date. Find out who traded before deciding what the volume means.
- Watch the stock for a few sessions. Heavy volume days often mark a level (the day’s high or low) that the price returns to.
Playbook C: the quiet list (volatility contraction)
- Signal: Bollinger squeeze (120 days). Add RS ≥ 50 if you only want stocks that have held up.
- Do not trade the squeeze itself; it says “quiet”, not “up”. Write down the band’s upper and lower edges.
- Wait for a close outside the band, ideally on rising volume. Plan the stop on the other side of the squeeze range.
None of these playbooks is a recommendation. They are examples of how traders turn a written idea into rules. Always decide your risk before entry, and skip stocks with results or big news due.
Case studies from 13 Nov 2026
Four real scans from the session of Friday 13 Nov 2026, chosen to show what the numbers can and cannot tell you. Prices in ₹.
1. “Big buyers today”: the buyers were on the other side of big sellers
The scan found 12 stocks. The top one by volume was IIFL Capital Services: 9.66× its usual volume, up just 0.54% to 354.15, with 73.09% delivery. The name of the scan suggests eager buying. NSE’s bulk-deal data for that day shows the other side: three large sellers sold a combined 63,15,728 shares in bulk deals. The high delivery was real, but it came from large holders exiting, and the price barely moved. Lesson: a scan’s name describes its filter, not the story. Check the bulk and block deals before reading meaning into a volume spike.
Adding turnover ≥ ₹10 Cr cut the list from 12 to 4: IIFL Capital Services, Max Financial Services (2.26×, +1.9%, delivery 65.04%), GCSL (2.24×, +5.09%, 60.41%) and Indegene (2.08×, +0.02%, 50.25%).
2. “Breakout with volume”: huge volume, tiny delivery
21 stocks matched. The top two by volume were Alicon Castalloy (154.59× volume, +17.32% to 976.15, delivery 5.97%) and Dhanlaxmi Bank (45.61×, +14.81% to 40.24, delivery 6.03%). In both, over 94% of the traded shares were not taken for delivery: most of the activity was same-day trading. For Alicon, the bulk-deal list shows several trading firms each buying and selling almost the same number of shares. Adding delivery ≥ 30% cut the list to 13, led by Baazar Style Retail (4.96×, +5.69%, delivery 42.08%) and RPEL (3.89×, +2.4%, 34.34%). Lesson: one extra condition changes the character of the list completely.
3. Bollinger squeeze: a whole sector going quiet
Only 13 stocks had a Bollinger squeeze that day, and four of them were large IT companies: TCS, Infosys, HCL Tech and Tech Mahindra, with band widths between 4.8% and 5.9%. When several stocks of one sector squeeze together, the story is usually the sector, not one company. The ready-made scan (squeeze + RS ≥ 70) kept only Tech Mahindra (RS 78) and Tirupati Forge (RS 88). Lesson: run the signal alone first, then add filters; you may spot a theme the filtered list hides. The sector heatmap helps confirm it.
4. ALL versus ANY: 401 or 0
Trend change up returned 401 stocks in ANY mode, almost a third of the market, because fresh 9/21 EMA crossovers alone numbered 225 that day. The same three conditions in ALL mode returned zero. Limiting the ANY list to F&O stocks (by running the F&O condition as a separate check) left 43, led by Hitachi Energy India (+10.68%, 5.89× volume). Lesson: a very wide scan tells you about the market’s mood; a narrow one gives you names to study.
Common mistakes
- Too many conditions. Ten conditions in ALL mode often return nothing, or one stock that fits by luck. Three to five clear conditions are usually enough.
- Adding conditions in ANY mode and wondering why the list grows.
- Forgetting liquidity. Without a turnover condition, thinly traded stocks fill the top of a volume-sorted list.
- Treating the scan name as a verdict. “Big buyers today” on 13 Nov included a stock where funds were selling in bulk.
- Ignoring missing data. New listings have no RS rating or 200-day average, so they silently drop out of those scans.
- Relying on browser storage. Clearing the browser deletes saved scans. Keep the share link somewhere safe.
- Using it during market hours. The data is the previous close. For intraday decisions you need live prices.
- Skipping the chart. A scan is the first filter; your own reading of the chart, results dates and news is the second.
Checklist before you act on a scan
- The session date under “Your conditions” is the latest trading day.
- Your idea is written in one sentence, and each condition matches a part of it.
- Match ALL (or ANY on purpose), and the count is small enough to study.
- A turnover condition keeps out stocks you cannot trade.
- For volume ideas: delivery % and bulk/block deals checked.
- Results, board meetings and news checked for every name.
- Entry level, stop loss and position size decided before any trade.
- The scan is saved and the link kept, so you can review it later.
Glossary
| Scan | A set of conditions applied to many stocks at once, returning those that pass. |
| Match ALL / ANY | Every condition must pass / at least one must pass. |
| Volume × | Today’s traded shares divided by the average of the previous 20 sessions. |
| Delivery % | Share of traded quantity taken into demat accounts rather than squared off the same day. |
| Turnover (median) | The stock’s typical daily traded value in ₹ crore. |
| RS rating | 1-year performance ranked against all stocks, 1 to 99. |
| RSI (14) | Relative Strength Index: compares up-moves and down-moves over 14 days, 0 to 100. |
| ADX, +DI, −DI | Trend strength (ADX) and direction (+DI above −DI = up-moves bigger), Wilder’s 14-day method. |
| MACD | 12-day EMA minus 26-day EMA; the signal line is its 9-day EMA; the histogram is the gap between them. |
| EMA / DMA | Exponential moving average / daily (simple) moving average of closing prices. |
| SuperTrend (10, 3) | A trailing line 3 × ATR(10) from price; a close through it flips the trend. |
| Bollinger width / squeeze | Distance between the bands as % of the 20-day average; a squeeze is the narrowest width in 120 sessions. |
| F&O stock | A stock with futures and options trading on NSE. |
Questions
What is a stock scan builder?
A tool to make your own stock scan by combining conditions such as RSI below 40, price above the 200-day average or volume twice the average. ChartMine’s scan builder runs your conditions on about 1,300 actively traded NSE stocks and lists the ones that match.
Is the ChartMine scan builder free?
Yes. It runs in your browser on end-of-day data from NSE, refreshed every trading evening. Saving and sharing scans is also free and needs no login.
What is the difference between Match ALL and Match ANY?
With Match ALL a stock must pass every condition, so each new condition shortens the list. With Match ANY one passing condition is enough, so each new condition lengthens it. On 13 Nov 2026 the same three trend-turn conditions gave 401 stocks with ANY and 0 with ALL.
Can I use the scan builder for intraday trading?
Not directly. It uses the previous session’s closing data and does not update during market hours. Traders use it in the evening to prepare a watchlist for the next day.
Where are my saved scans stored?
In your own browser only. Clearing browser data deletes them. Use Share link to keep a copy: the link carries the conditions and opens the same scan on the latest data.
How is this different from the stock screener?
The stock screener filters companies mainly on fundamentals such as P/E, ROE and growth. The scan builder works on daily price, volume and technical conditions, and on signals like crossovers and candlestick patterns.
Is a stock in my scan results a buy signal?
No. A scan only lists stocks that fit your description. ChartMine is not a SEBI-registered adviser; check the chart, news and results, and always decide your stop loss and position size before any trade.