
☰ All tutorials
Start here
Tool tutorialsHow to trade with ChartMineStocks
Stock monitorMy watchlistStock scores & checklistMarket & sectors
Nifty 50Bank NiftySensexFin NiftyDaily market reportMarket breadthSector rotationSector heatmapStock screenerRelative strength (RS)MCX commodity pricesFear & Greed IndexWhat happens after…Scanners
Top gainers & losersStocks to watch tomorrowNR7 stocks scannerInside bar stocks52-week high stocksGap up & gap down stocksRSI oversold stocksGolden cross stocksSuperTrend buy stocksScan builderEMA 9/21 crossoverMACD crossoverADX strong trendBollinger breakout / squeezeVolume spike stocksOpen = high / open = lowCandlestick pattern scannerNarrow CPR scannerF&O data
F&O ban listOI build-upOption chainPCR & max painExpiry calendarF&O lot sizesOI build-up heatmapPCR trendMax pain trendFutures basisStock screens
Quarterly growersProfit growth stocksLow P/E stocksMutual fund buyingNear 52-week low, growingDebt-free companiesHigh ROE & ROCEMagic Formula stocksLow price-to-bookSmart money
FII / DII dataShareholding changesBig-money footprintShort selling dataF&O positions by participantBulk & block dealsPromoter buyingDelivery percentageCalendars
Results calendarQuarterly results trackerBoard meetingsCorporate actionsIPO calendarIPO performanceResearch & planning
Strategy testerCompare stocksDividend yield stocksASM / GSM listExpiry-day movesSeasonality & stock historyNSE holidays 2026Position size calculatorOption payoff calculatorPivot point calculatorMore
Stock scanners hubStock screensHow to use Stocks to watch tomorrow
A plain-language guide to ChartMine’s next-day movers list: how stocks are scored, what the chance and the lean mean, what the live scorecard shows, a tour of every part of the page, and three playbooks with real case studies.
What this list is, in plain words
Every evening thousands of NSE stocks finish the day. On the next day, a small number of them will move a lot: 5% or more, up or down. On an average day in the last two years, about 5 in every 100 liquid NSE stocks did that.
Stocks to watch tomorrow tries to find those stocks in advance. It scores every listed NSE company that trades at least ₹5 crore a day on a handful of conditions that, in two years of data, came before big next-day moves, and ranks them by their measured chance of moving 5% or more in the next session.
It is important to be clear about what this is and is not:
- It is a ranked watchlist of stocks more likely than average to make a big move tomorrow.
- It is not a list of stocks that will go up. A 5% move can be up or down, and for many stocks the two are close to even.
- It is not certain. Even the highest-scoring group moved 5%+ only about one time in four.
One line to remember: this list tells you where to look tomorrow. Your chart, your levels and your stop loss decide whether and which way to trade.
How the list is built
1. The universe
Every listed company on NSE (equity series), using NSE’s own end-of-day file. A stock is included if it closed at ₹20 or more, traded on average ₹5 crore or more a day over the last 20 days, and has at least 80 days of history. On 6 Nov 2026 that was 1,072 stocks, both F&O and non-F&O.
2. The conditions
A study of all liquid NSE stocks over two years (18 Oct 2024 to 16 Oct 2026, 445,719 stock-days) measured how often each condition was followed by a 5%+ move the next day. The table shows the tuning part of that period (up to 16 Mar 2026, 269,278 stock-days), where the average was 4.6%. The conditions that raised the odds became the score:
| Condition today | Chance of a 5%+ move next day | vs average (4.6%) |
|---|---|---|
| Moved 10% or more today | 27.7% | 6.0× |
| Volatile stock (median daily move 3%+) | 15.5% | 3.4× |
| Moved 5% or more today | 15.0% | 3.3× |
| NR7 in a volatile stock | 14.8% | 3.2× |
| Volume 3× normal | 10.8% | 2.3× |
| Volume 2× normal | 8.8% | 1.9× |
| Close above the 20-day high | 7.6% | 1.7× |
| Shakeout (dipped below the 10-day low, closed back above) + volume | 6.1% | 1.3× |
3. The score and the chance
Each true condition adds points; stronger conditions add more. The tuning used only the first 70% of the period (up to 16 Mar 2026). The “Chance of a 5%+ move” shown for each stock is how often stocks with a similar score actually moved 5%+ in the later period the model never saw (17 Mar to 16 Oct 2026). In that unseen period the daily top 10 moved 5%+ the next day 22.6% of the time, against 5.5% for a random liquid stock.
4. Two tabs
- Already moving: stocks that moved 3% or more today. These score highest (big moves cluster), but you are late to them.
- Not moved yet: stocks that moved less than 3% today but show unusual volume or are naturally volatile stocks having a quiet day. Their measured chance is lower (8.4% to 12.4%) but you are early.
The list is built from NSE’s daily file and published every trading evening after about 7:45 PM IST.
The setups and the “lean”
The Why column shows which conditions put each stock on the list. The common ones:
| Tag | Meaning |
|---|---|
| Moved 10%+ / 5%+ today | A big move today. Big moves tend to be followed by more big days (either way). |
| Volume 2× / 3×+ | Today’s volume against the 20-day average. Unusual interest. |
| Volatile stock | A stock whose typical day is a 3%+ move. It moves a lot most days. |
| NR7 in a volatile stock | A volatile stock having its quietest day in seven. One of the few “quiet” setups that raised the odds. |
| 20-day breakout / breakdown | Close above the highest high (or below the lowest low) of the last 20 days. |
| Shakeout + volume | Dipped below the 10-day low and closed back above it on 1.5× volume. |
| Delivery spike | Delivery % at least 1.5× its usual level. |
| Results [date] | The company announces results by the next session. |
The lean: which way, if any
Each stock also shows a lean, taken from measured history of high-scoring stocks (Oct 2024 to Oct 2026, about 29,000 cases), not from a guess:
| Today’s action | Next day up 5%+ | Next day down 5%+ | Lean |
|---|---|---|---|
| Up 10%+ today | 14.7% | 10.3% | ◆ Two-way |
| Down 10%+ today | 13.7% | 17.7% | ▼ Leans down |
| Closed up at a 20-day high, strong close | 9.3% | 5.3% | ▲ Leans up |
| Closed down at a 20-day low, weak close | 6.9% | 7.1% | ▼ Leans down |
| Closed up today (other) | 7.4% | 4.6% | ▲ Leans up |
| Closed down today (other) | 6.3% | 6.8% | ▼ Leans down |
Look at the numbers, not just the arrow: even “leans up” means a 5%+ fall is still quite possible. The lean tilts the odds; it does not decide them.
Advantages and limits
✅ Tested on unseen data
The chance shown comes from a period the model was not tuned on, and the page keeps a live 30-day scorecard.
✅ Whole market
About 1,070 liquid stocks, not just F&O names.
✅ Honest about direction
It shows the measured up and down odds separately instead of pretending to know the direction.
✅ Saves hours
The evening shortlist is ready with reasons attached.
The limits: what the scorecard shows
For the last 30 sessions before 6 Nov 2026 (23 Sep to 5 Nov 2026), the page’s own scorecard checked each day’s top 10 against the next session:
| Group | Top-10 picks | Moved 5%+ next day | Hit rate |
|---|---|---|---|
| Already moving tab | 300 | 84 | 28.0% |
| Not moved yet tab | 300 | 37 | 12.3% |
| Average liquid stock, same days | – | – | 6.5% |
- The ranking works as a ranking. Both tabs found big movers several times more often than chance.
- But most picks did not move 5%. Even in the stronger tab, about 7 in 10 did not. In the Not moved yet tab, almost 9 in 10 did not, and some days had zero hits (4 and 5 Nov 2026).
- Direction is the hard part. A “hit” counts a 5% fall the same as a 5% rise. The list does not tell you which.
- Quiet charts disappointed. In the study’s tuning period (Oct 2024 to Mar 2026), NR7 days (3.7%), inside bars (3.9%) and tight squeezes (3.1%) moved 5%+ less often than the 4.6% average. That is why the list prefers volume and volatility.
- Prices on this page are not adjusted for corporate actions, and a stock’s history restarts after a split or bonus.
What this means for you: a big move is likely to be big in either direction, so the risk is as large as the opportunity. Smaller position sizes and firm stop losses matter even more on this list than on a normal watchlist.
A tour of the screen
Open Stocks to watch tomorrow. The top of the page shows the date, the two tabs and a “proof” bar.
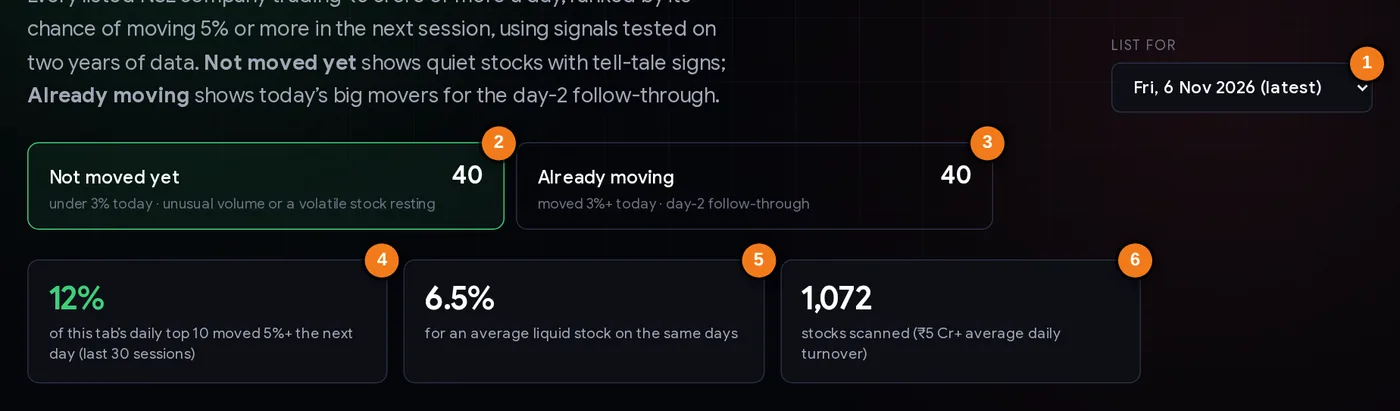
- 1List for: the evening the list was made; it is for the next session.
- 2Not moved yet: under 3% today, unusual volume or a volatile stock resting.
- 3Already moving: moved 3%+ today.
- 4How often this tab’s daily top 10 moved 5%+ next day, last 30 sessions.
- 5The same for an average liquid stock.
- 6How many stocks were scored (₹5 crore+ average daily turnover).
The proof bar is recalculated every evening, so you always see how the list did recently, not just how it did in testing.
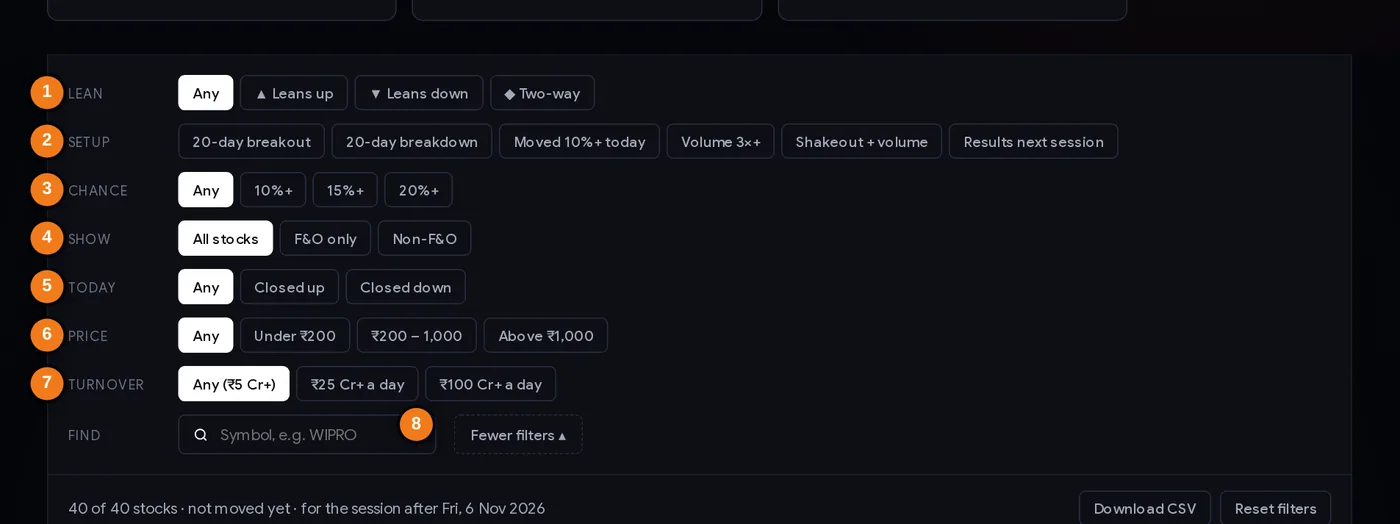
- 1Lean: up, down or two-way
- 2Setup: the reason the stock is listed
- 3Minimum measured chance
- 4F&O or non-F&O stocks
- 5Closed up or down today
- 6Price band
- 7Minimum average daily turnover
- 8Find a symbol
The filters
- Lean: show only stocks that lean up, lean down, or are two-way.
- Setup: keep stocks with a specific reason: 20-day breakout or breakdown, moved 10%+, volume 3×+, shakeout, or results next session. Several can be on at once.
- Chance: only stocks with a measured chance of 10%, 15% or 20%+.
- More filters: F&O or non-F&O stocks, closed up or down, price band, and minimum turnover (₹25 crore or ₹100 crore a day for more liquid names).
- Find a symbol. Filters are saved in the page address.
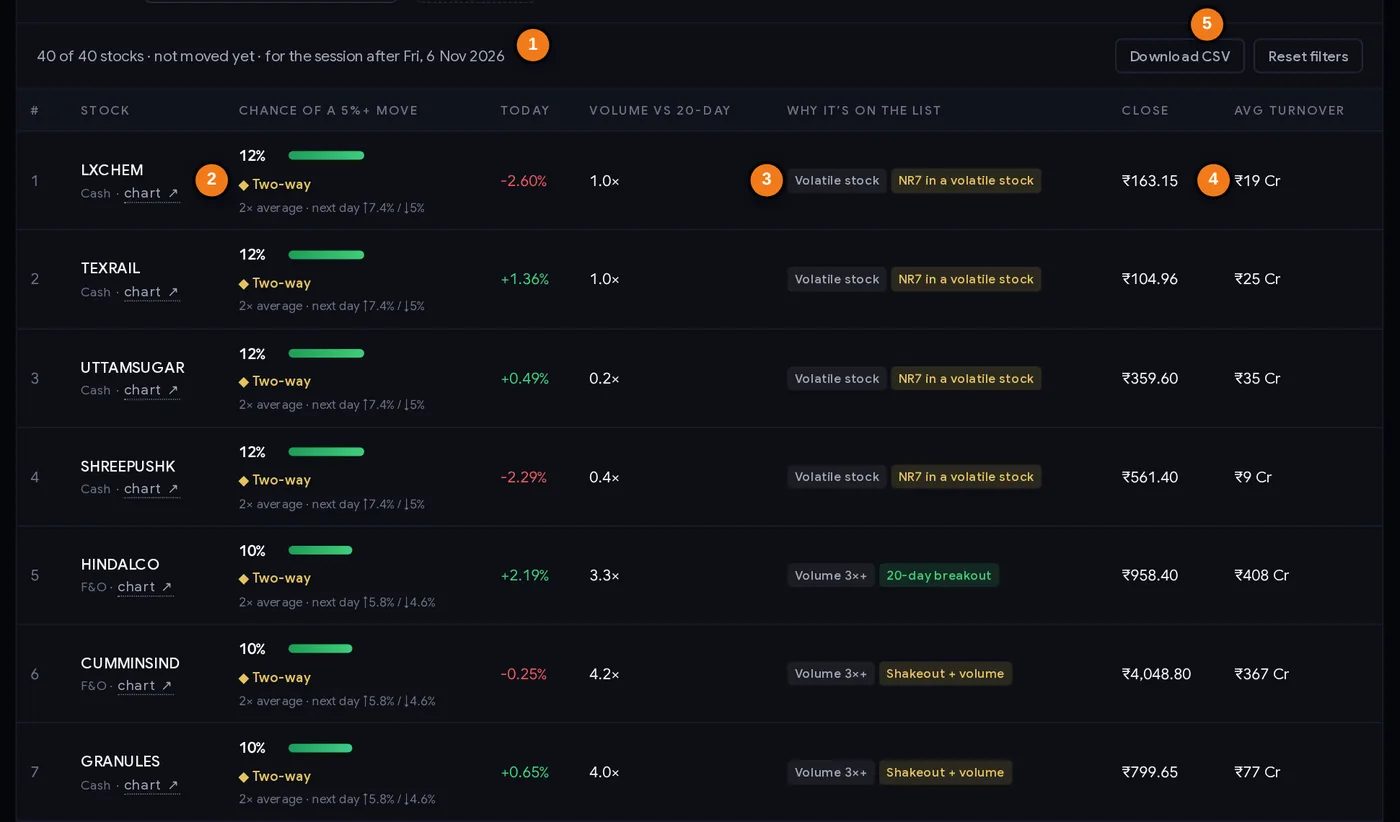
- 1How many stocks are shown, the tab and the date
- 2Chance of a 5%+ move, the lean and the measured up/down split
- 3Why the stock is on the list
- 4Average daily turnover (₹ crore)
- 5Download the list as CSV
Every column explained
| Column | What it tells you |
|---|---|
| # | Rank within the tab (by score). |
| Stock | Symbol, F&O or cash segment, and a chart link. |
| Chance of a 5%+ move | The measured chance, how many times the average that is, the lean, and the measured up/down split (e.g. ↑14.7% / ↓10.3%). |
| Today | Today’s % change. |
| Volume vs 20-day | Today’s volume against the 20-day average. |
| Why it’s on the list | The conditions that scored, plus a results date if due. |
| Close | Today’s closing price. |
| Avg turnover | Average daily traded value over 20 days, in ₹ crore. Higher = easier to enter and exit. |
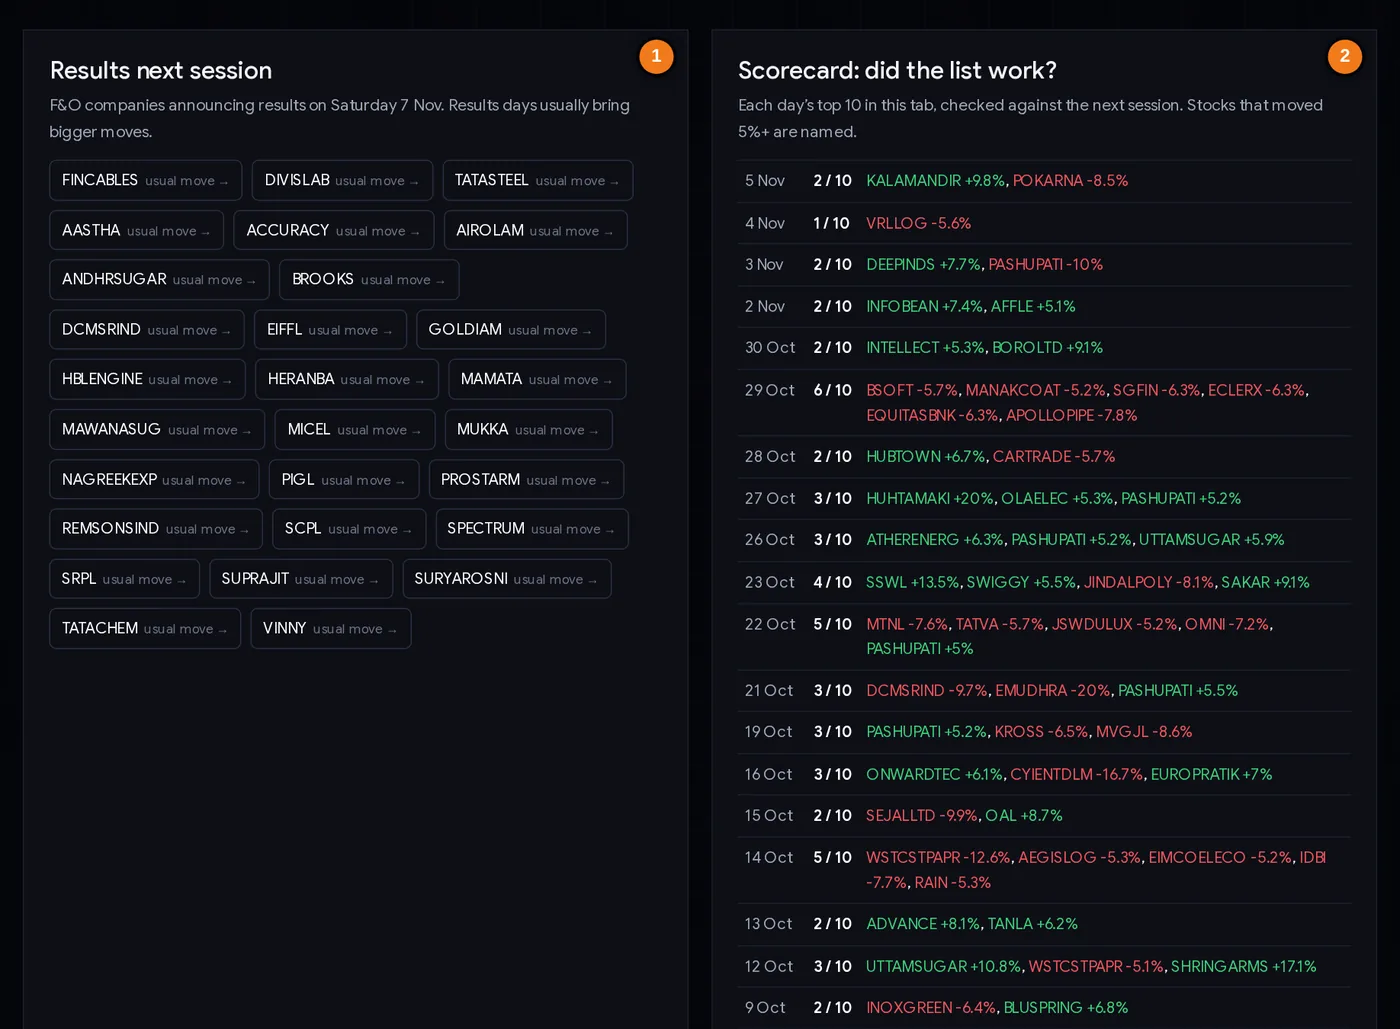
- 1F&O companies announcing results by the next session
- 2Each day’s top 10, how many moved 5%+ next day, and which
Below the table, Results next session lists F&O companies announcing results by the next session (each links to its usual results-day move), and the Scorecard shows, day by day, how many of that tab’s top 10 moved 5%+ and names them with the actual move.
Step by step: an evening routine
- Open the page after about 8 PM IST and check the date in the “List for” box.
- Read the proof bar and scorecard. If the last few days had few hits, the market may be quiet; expect less.
- Choose a tab. “Not moved yet” if you want to be early; “Already moving” if you trade day-2 follow-through or reversals.
- Filter for tradability: turnover ₹25 crore+ and, if you trade futures or options, “F&O only”.
- Read the Why and the lean for each candidate, then open its chart.
- Mark levels: today’s high and low, the 20-day high and low, and any gap.
- Write a plan for both directions: where you would act on an upside break, where on a downside break, and where you are wrong.
- Size small. Use the position size calculator; these stocks can move 5–10% against you in a day.
Three playbooks
Playbook A: the opening-range break
- Take 3–5 names from the list with turnover above ₹25 crore.
- Next morning, mark the high and low of the first 15 or 30 minutes.
- Act only if the price breaks that range with volume, in either direction; the list told you a move is likely, the break tells you which way.
- Stop: the other side of the opening range. Exit the same day if it is an intraday plan.
Playbook B: day-2 of a big mover
For stocks that moved 10%+ today (Already moving tab), the measured odds are two-way: up 5%+ 14.7%, down 5%+ 10.3% after a 10% rise; down 17.7%, up 13.7% after a 10% fall. Traders watch whether the price holds above (or below) today’s close in the first hour. A strong mover that cannot hold its gain early is a warning sign; one that holds and makes a new high is a continuation candidate.
Playbook C: results-day preparation
The Results next session box lists companies reporting by the next session. Results days bring bigger moves. Many traders check the usual results-day move for each and either avoid them, or plan for both outcomes with defined risk (for example, with options and the option payoff calculator).
Risk is two-sided. A list of likely big movers is also a list of likely big losers. Never take a full-size position on a stock you picked because it is “likely to move”.
Case studies from the scorecard
Real examples from the published lists of late October and early November 2026 (data.chartmine.ai, NSE end-of-day prices).
1. 29 Oct 2026: six hits, opposite directions
The Already moving tab’s top 10 had a great day by the scorecard: 6 of 10 moved 5%+ on 30 Oct. But look at the direction. Four had risen 11–13% on 29 Oct (BSOFT +11.9%, MANAKCOAT +11.5%, SGFIN +12.8%, APOLLOPIPE +13.0%) and all four fell 5–8% the next day. Two had fallen 11–12% (ECLERX and EQUITASBNK) and both fell another 6.3%. A trader who simply bought the top of the list lost money on a “6 out of 10” day.
2. HUHTAMAKI, 27 Oct 2026: the lean was wrong
Fell 11.5% on 8.5× volume to ₹191.31, a 20-day breakdown; the lean said ▼ leans down (down 5%+ 17.7% vs up 13.7%). The next day it rose 20%. The lean is a tilt, not a forecast; a stop loss on a short position would have been essential.
3. PASHUPATI, 27 Oct and 3 Nov 2026: follow-through, then reversal
On 27 Oct it was on the Already moving list after rising 5.2% to ₹115.58 on 3.9× volume, a 20-day breakout, leaning up. It rose another 5.2% the next day. On 3 Nov it was back on the list after another 5% day, at ₹148.72, leaning up again. This time it fell 10% the next day. Same setup, opposite result.
4. The Not moved yet tab, 3–5 Nov 2026
On 3 Nov two of the top 10 delivered: KROSS (+5.5%) and SASKEN (+5.9%), both flagged as “NR7 in a volatile stock”. On 4 and 5 Nov the tab had zero hits. Over 30 sessions it averaged 12.3%. Early lists are cheap to watch but most days nothing big happens.
Common mistakes
- Reading the list as “stocks that will go up”. It ranks the chance of a big move in either direction.
- Buying the top names at the open. Case 1 shows how that can go wrong on a high-hit day.
- Trusting the lean arrow blindly. Case 2 rose 20% against a “leans down” tag.
- Ignoring liquidity. A ₹5 crore-a-day stock can have wide spreads. Use the turnover filter.
- Full-size positions. Big movers need small sizes.
- Forgetting results. Check the results box and the Why column’s results tag.
- Expecting every day to work. Some days have no hits at all.
Pre-trade checklist
- List date is the latest trading day; proof bar and recent scorecard checked.
- Turnover high enough for your size (₹25 crore+ a day for most traders).
- Why column and lean read; results date checked.
- Chart opened; today’s high/low and 20-day high/low marked.
- Plan for both directions written down, with stops.
- Entry only on a price trigger the next day (e.g. opening-range break), not at the open.
- Position size reduced for a stock likely to move 5%+.
- Daily loss limit set before the session.
Glossary
| 5%+ move | A next-day close at least 5% above or below today’s close. |
| Chance | How often stocks with a similar score moved 5%+ next day, in data the model was not tuned on. |
| Lean | The measured tilt between 5%+ up and 5%+ down moves for that kind of day. |
| Turnover | The value of shares traded in a day, in ₹ crore. |
| Volatile stock | A stock whose median daily move over 20 days is 3% or more. |
| 20-day breakout | A close above the highest high of the previous 20 sessions. |
| Shakeout | A dip below a recent low that closes back above it. |
| Opening range | The high and low of the first 15–30 minutes of trading. |
| Out-of-sample test | Checking a model on data it never saw while being built. |
Questions
Which stocks will move tomorrow?
Nobody can know for sure. ChartMine’s Stocks to watch tomorrow ranks about 1,070 liquid NSE stocks by their measured chance of a 5%+ move next session. In the last 30 sessions before 6 Nov 2026 its Already moving top 10 moved 5%+ 28% of the time, against 6.5% for an average stock, in either direction.
How is the stocks to watch tomorrow list made?
Each evening every listed NSE stock trading ₹5 crore or more a day is scored on conditions that came before big moves in two years of data, such as a big move today, unusual volume, a volatile stock resting, or a 20-day breakout. The chance shown was measured on a period the model was not tuned on.
Does the list say whether a stock will go up or down?
No. It shows the chance of a big move and a measured lean (for example up 5%+ 9.3% vs down 5%+ 5.3% for strong closes at a 20-day high). Direction is close to even for many stocks, so traders let price action decide.
What is the difference between Not moved yet and Already moving?
Not moved yet keeps stocks that moved less than 3% today but show unusual volume or are volatile stocks having a quiet day. Already moving lists stocks that moved 3% or more today, for day-2 follow-through or reversal; they score higher but you are later.
When is the list updated?
Every trading evening after NSE’s end-of-day file is out, usually after about 7:45 PM IST. Earlier lists can be opened from the date box.
Are NR7 and inside bar stocks likely to move big tomorrow?
In the tuning period of ChartMine’s study (Oct 2024 to Mar 2026) they were less likely than average: NR7 days moved 5%+ next day 3.7% of the time and inside bars 3.9%, against 4.6% for any liquid stock. The exception was NR7 in an already volatile stock (14.8%).