
☰ All tutorials
Start here
Tool tutorialsHow to trade with ChartMineStocks
Stock monitorMy watchlistStock scores & checklistMarket & sectors
Nifty 50Bank NiftySensexFin NiftyDaily market reportMarket breadthSector rotationSector heatmapStock screenerRelative strength (RS)MCX commodity pricesFear & Greed IndexWhat happens after…Scanners
Top gainers & losersStocks to watch tomorrowNR7 stocks scannerInside bar stocks52-week high stocksGap up & gap down stocksRSI oversold stocksGolden cross stocksSuperTrend buy stocksScan builderEMA 9/21 crossoverMACD crossoverADX strong trendBollinger breakout / squeezeVolume spike stocksOpen = high / open = lowCandlestick pattern scannerNarrow CPR scannerF&O data
F&O ban listOI build-upOption chainPCR & max painExpiry calendarF&O lot sizesOI build-up heatmapPCR trendMax pain trendFutures basisStock screens
Quarterly growersProfit growth stocksLow P/E stocksMutual fund buyingNear 52-week low, growingDebt-free companiesHigh ROE & ROCEMagic Formula stocksLow price-to-bookSmart money
FII / DII dataShareholding changesBig-money footprintShort selling dataF&O positions by participantBulk & block dealsPromoter buyingDelivery percentageCalendars
Results calendarQuarterly results trackerBoard meetingsCorporate actionsIPO calendarIPO performanceResearch & planning
Strategy testerCompare stocksDividend yield stocksASM / GSM listExpiry-day movesSeasonality & stock historyNSE holidays 2026Position size calculatorOption payoff calculatorPivot point calculatorMore
Stock scanners hubStock screensHow to use Compare stocks
A plain-language guide to comparing NSE stocks fairly: why every line starts at 0%, what return, volatility, worst fall and beta really tell you, how to read the screen, and four real comparisons from the year to November 2026.
What the compare tool does, in plain words
“Which did better, HDFC Bank or ICICI Bank?” sounds like a simple question, but looking at two price charts side by side does not answer it. One stock trades near ₹800 and the other above ₹1,300, the charts use different scales, and your eye is drawn to whichever line looks steeper.
The Compare stocks tool solves this. You add up to five NSE stocks, and it draws them on one chart that starts every line at 0% on the first day of the period you choose. NIFTY 50 is always drawn as a grey reference line. From then on every point shows the same thing for every stock: how much it has gained or lost since the start, in %.
Under the chart, a table adds four numbers for each stock over the same period:
- Return: the % change in price from the first day to the last.
- Volatility per year: how much the price typically swings.
- Worst fall: the biggest drop from a high to a later low inside the period.
- Beta vs NIFTY: how strongly the stock has tended to move with the index.
One line to remember: the compare tool answers “what happened, and how bumpy was the ride?” for several stocks at once. It does not tell you which one will do better next.
The selection is kept in the address bar, so you can bookmark a comparison or send the link to a friend.
The four numbers, explained simply
Each number answers a different question. Read them together; none of them is enough alone.
| Number | The question it answers | How it is calculated | How to read it |
|---|---|---|---|
| Return | How much did the price change? | Last close ÷ first close in the period − 1. | Price only: dividends are not included. |
| Volatility / yr | How bumpy was the ride? | The standard deviation of daily % changes, scaled to a year (× √250). | NIFTY 50 is usually around 12–15%. Many large stocks sit at 20–30%; small caps can be far higher. |
| Worst fall | What was the deepest loss for someone who bought at the top? | The largest drop from any closing high to a later closing low inside the period (maximum drawdown). | Shows the pain you would have had to sit through. |
| Beta vs NIFTY | How much did the stock move with the market? | The slope of the stock’s daily % changes against NIFTY 50’s on the same days. | 1.0 = moved like the index; 1.3 = about 30% more; 0.5 = about half. |
Beta and volatility are not the same thing
This trips up many beginners. Beta only measures the part of a stock’s movement that follows the index. Volatility measures all of it, including moves caused by the company’s own news. A stock can have a low beta and still be very volatile, if it often moves for its own reasons. Case study 4 below shows exactly that.
Why everything starts at 0%
Starting every line at the same point on the same day is called rebasing (or normalising). It removes the effect of share price level. A ₹100 stock that rises to ₹120 and a ₹3,000 stock that rises to ₹3,600 both show +20%.
The five ranges
| Button | Trading days | Good for |
|---|---|---|
| 1M | 21 | Recent momentum. Very noisy; beta over one month means little. |
| 3M | 63 | The current quarter’s story. |
| 6M | 126 | Medium-term trend. |
| 1Y (default) | 250 | The standard view; enough days for volatility and beta to settle. |
| 2Y | All data (about 500 days) | The longest view the tool has. |
Why compare stocks: advantages and limits
✅ A fair race
Every stock starts from the same line on the same day, so you see real relative performance, not chart-scale illusions.
✅ Risk next to return
A 20% gain with a 40% worst fall is a very different ride from a 20% gain with a 12% worst fall. The table shows both.
✅ Built-in benchmark
NIFTY 50 is always on the chart. Doing worse than the index is a fact worth knowing about any stock you hold.
✅ Shareable
The link keeps your selection, so a comparison can be saved, revisited or sent to someone.
The limits
- The start date changes the winner. The same stocks can rank differently over 3 months, 1 year or 2 years (see case study 3).
- Price only. Dividends are not added back, so high-dividend stocks look a little worse than a shareholder’s real return.
- Splits and bonuses are adjusted, other events may not be. A demerger can show up as a drop that was really value moving into new shares.
- Two years at most. For long histories use the stock’s own history page.
- Backward-looking. Low volatility or a strong last year says nothing certain about the next one.
- Small date mismatches. On 9 Nov 2026 the stock data ran to 6 Nov while the NIFTY 50 line included the one-hour Muhurat session of 8 Nov. Beta uses only days both have, but the index’s return can include a day the stocks do not.
A tour of the screen
Open Compare stocks. It starts with Reliance, HDFC Bank and Infosys over one year.
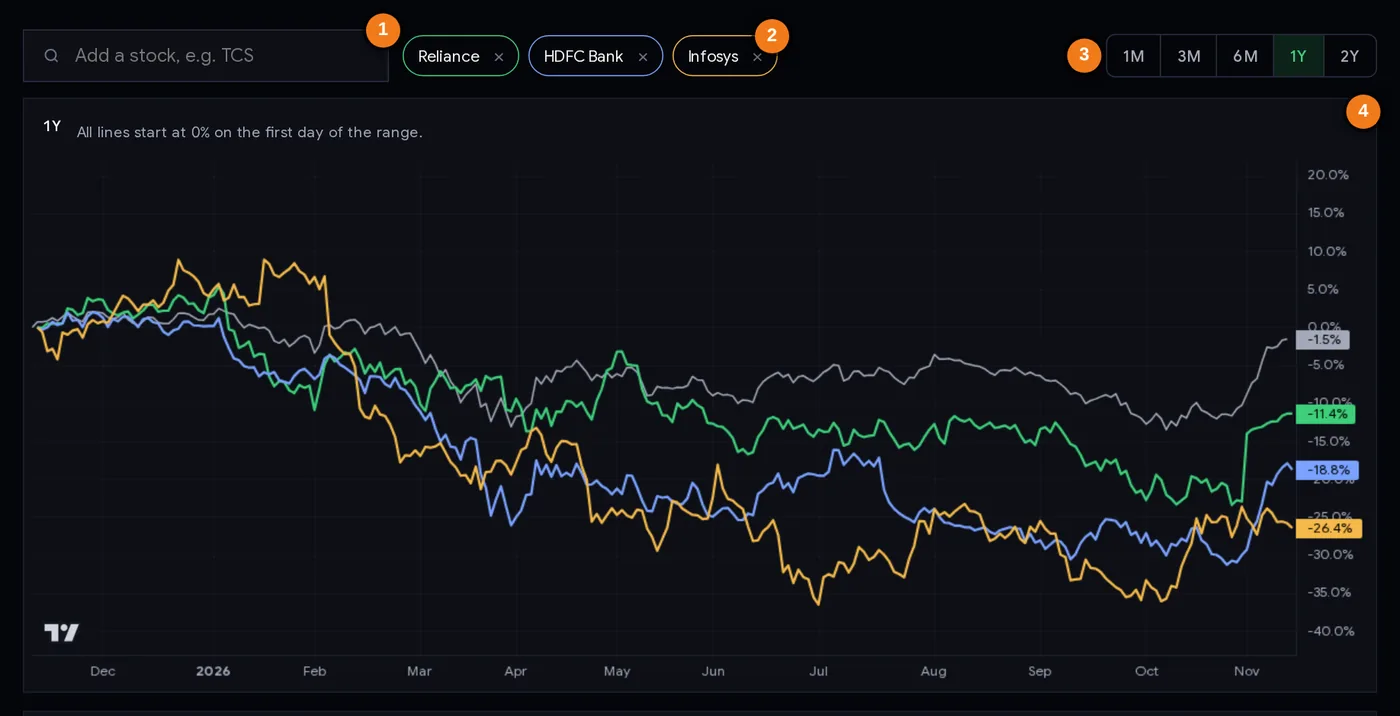
- 1Add a stock: search by name or symbol.
- 2Chips: one per stock in its line colour; × removes it.
- 3Range: 1M, 3M, 6M, 1Y or 2Y.
- 4Every line starts at 0% on the first day of the range; NIFTY 50 is the grey line.
Controls
- Add a stock: type a name or symbol (for example “TCS” or “Sun Pharma”) and pick from the suggestions, or press Enter for the first one. If five are already shown, the oldest one is dropped.
- Chips: each stock has a coloured chip; click × to remove it. NIFTY 50 cannot be removed: it is the reference.
- Range buttons: 1M, 3M, 6M, 1Y, 2Y. All lines restart at 0% on the first day of the new range, and the table is recalculated.
- The chart: hover to read each line’s value on a date. The labels on the right edge show where each line ends.
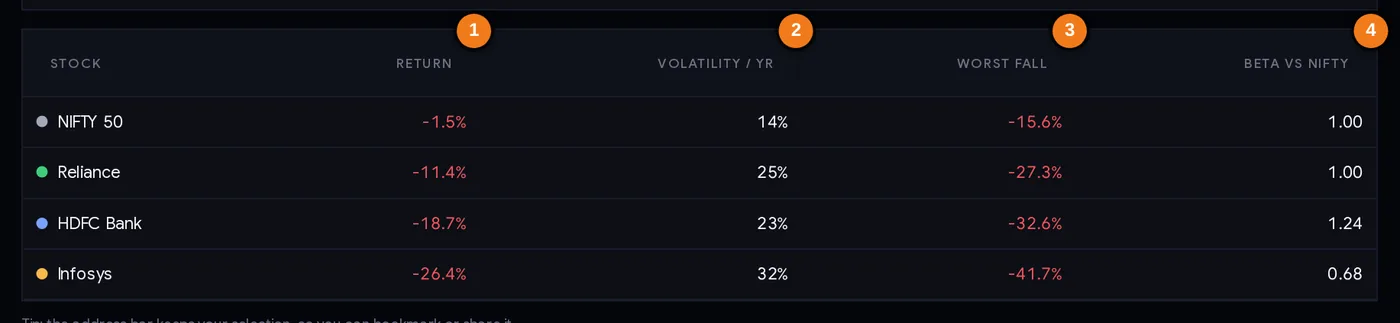
- 1Return over the range (price only)
- 2Volatility per year
- 3Worst fall (maximum drawdown)
- 4Beta against NIFTY 50
Every column explained
| Column | What it tells you |
|---|---|
| Stock | The name, with its line colour. NIFTY 50 is always the first row. |
| Return | Price change over the range. Green if positive, red if negative. |
| Volatility / yr | Typical yearly swing, from daily moves. Compare it with NIFTY’s figure in the first row. |
| Worst fall | The deepest peak-to-low drop inside the range. |
| Beta vs NIFTY | Sensitivity to the index (NIFTY itself shows 1.00). |
Click a column header to sort the table by it. The address bar now holds something like ?s=reliance,hdfcbank,infy; that link reopens the same comparison.
Step by step: a useful comparison in 10 minutes
- Decide the question first. “Which of these two banks held up better this year?” is a good question. “Which stock should I buy?” is not one this tool can answer.
- Pick comparable stocks: the same sector, or the stock you hold against two close rivals. Comparing a bank with a pharma company mostly shows sector moves.
- Start with 1Y, then check 3M and 2Y. If the ranking flips between ranges, note it; the story is less clear than it looks.
- Look at the grey NIFTY line. Which stocks beat the index, and which lagged it?
- Read the table across. For each stock: return, then worst fall, then volatility. Ask: was the gain worth the ride?
- Check beta if you care about how a stock behaves when the whole market falls. A beta well above 1 has tended to fall harder on bad market days.
- Find the reason. A big gap between two similar stocks usually has a cause: results, news, a corporate action. Open each stock’s page on the Stock monitor and check quarterly results.
- Save the link and look again in a month to see whether the pattern held.
Three ways people use the compare tool
Playbook A: the holding health check
Put your stock next to two direct rivals. If it has lagged both rivals and NIFTY over 6 months and 1 year, that is not a sell signal by itself, but it is a clear reason to find out why: weaker results, sector news, or something specific to the company. Write down what you find and whether your reason for holding still stands.
Playbook B: choosing within a sector
When you like a sector, compare its main names over 1Y. Look for the one with a reasonable return and a smaller worst fall. Then check the fundamentals elsewhere (for example the stock screener) before deciding anything. Past relative strength can continue for a while (see relative strength stocks), but it can also reverse sharply.
Playbook C: building a calmer portfolio
Investors who want a smoother ride compare candidates on volatility and worst fall, not just return. A mix of stocks that did not all fall at the same time (different sectors, different betas) usually swings less than any one of them. Use the 2Y range to include more market conditions.
Keep perspective. A comparison is a description of the past. Decide position sizes with your own risk limits (the position size calculator helps) and never put a large share of your capital into one stock because it topped a chart.
Case studies (1-year range, data to 6 Nov 2026)
All figures below come from the tool’s own data and formulas, seen on 9 Nov 2026.
1. The default view: three giants that all lagged the index
| 1Y | Return | Volatility / yr | Worst fall | Beta |
|---|---|---|---|---|
| NIFTY 50 | −2.1% | 14% | −15.6% | 1.00 |
| Reliance | −10.4% | 25% | −27.3% | 1.00 |
| HDFC Bank | −20.0% | 23% | −32.6% | 1.24 |
| Infosys | −19.5% | 32% | −41.7% | 0.69 |
All three did worse than NIFTY 50, and each had a deeper worst fall than the index. Buying “big names” did not mean a smooth year. Lesson: single stocks, even the largest, are usually much bumpier than the index.
2. Same sector, very different years: four private and public banks
| 1Y | Return | Volatility / yr | Worst fall | Beta |
|---|---|---|---|---|
| ICICI Bank | +17.5% | 21% | −16.1% | 0.99 |
| Axis Bank | +7.9% | 25% | −17.2% | 1.15 |
| SBI | +6.4% | 24% | −23.5% | 1.05 |
| HDFC Bank | −20.0% | 23% | −32.6% | 1.24 |
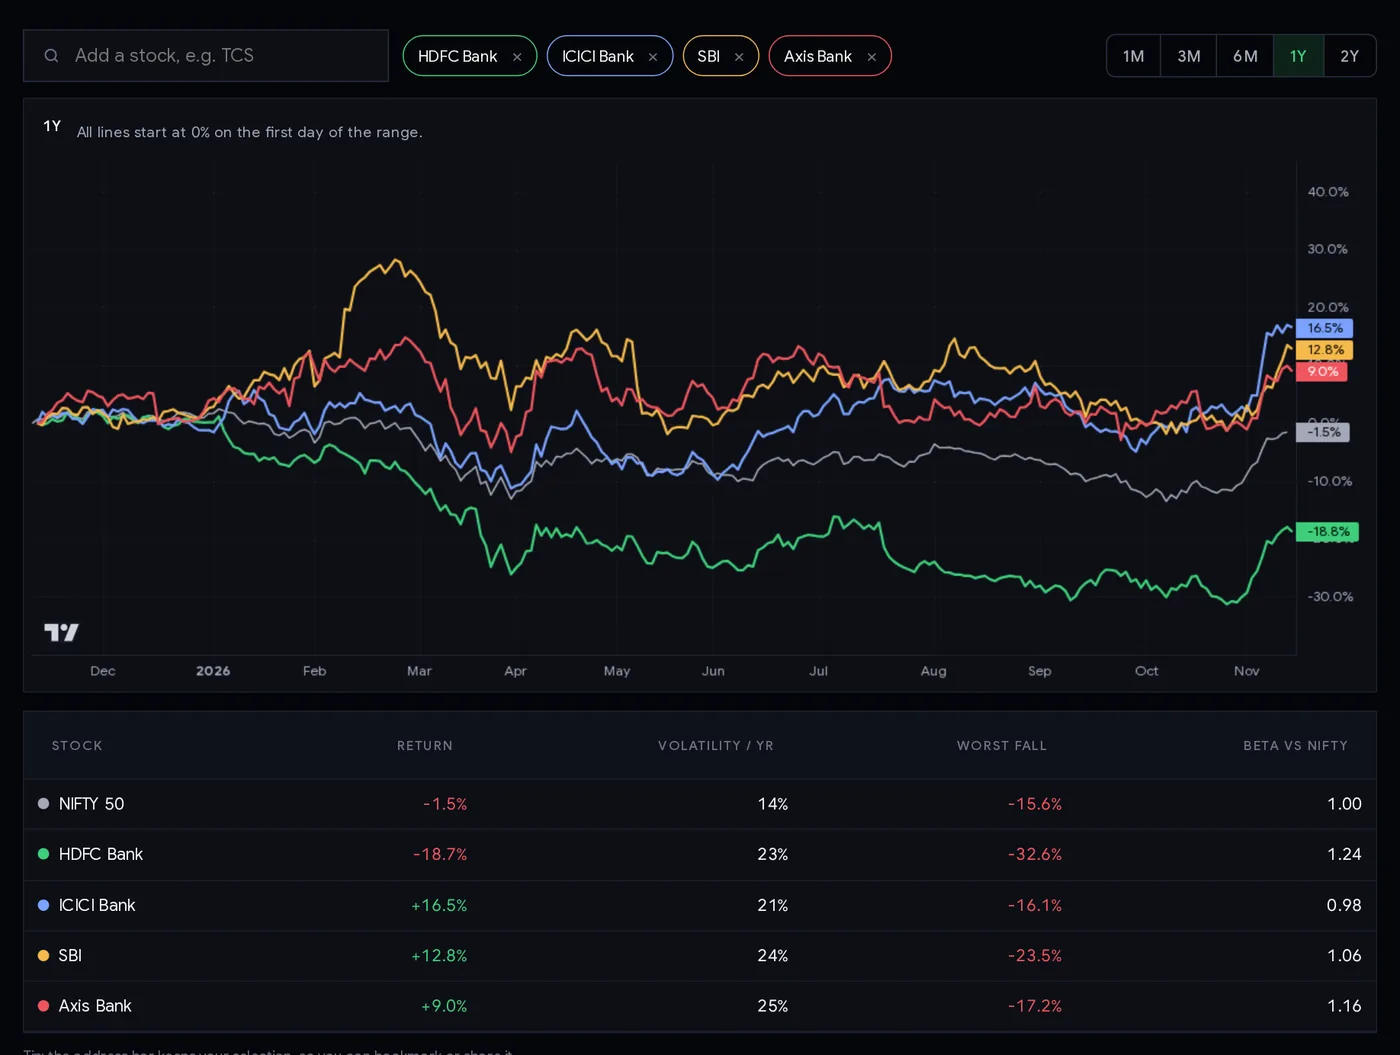
Similar volatility and similar betas, yet a 37-point gap between the best and the worst. Lesson: “I own the sector” is not the same as “I own the right stock in it”. Company-specific factors matter a lot.
3. The range changes the story: HDFC Bank
Over 3M HDFC Bank was +7.8%, ahead of NIFTY’s +1.6%. Over 1Y it was −20.0%; over 2Y −9.2%. Someone checking only the last quarter would have seen a recovering leader; someone checking the year saw a laggard. Both are true. Lesson: always check at least two ranges before drawing a conclusion.
4. Low beta is not low risk: Sun Pharma vs Infosys
Sun Pharma had the lowest beta of the stocks we looked at, 0.46, with volatility of 19% and a worst fall of −13.2% (return +10.1%). Infosys also had a below-1 beta, 0.69, yet its volatility was 32% and its worst fall −41.7%, much worse than NIFTY’s −15.6%. Infosys moved a lot, just not in step with the index. Lesson: to judge how rough a stock can be, read volatility and worst fall, not beta alone.
Common mistakes
- Picking the range that tells the story you want. Check several.
- Comparing unlike stocks and calling the result a stock-picking insight, when it is really a sector move.
- Ignoring the worst fall. The final return hides how deep the dip was on the way.
- Treating beta as total risk. It only measures movement with the index.
- Forgetting dividends. For high-dividend stocks the price return understates what holders earned; see dividend yield stocks.
- Reading 1M beta and volatility as meaningful. 21 days is too few.
- Assuming last year’s winner wins again. Relative performance can and does reverse.
Comparison checklist
- I know the question I am asking.
- The stocks are comparable (same sector, or deliberate rivals).
- I checked at least two ranges (for example 3M and 1Y).
- I compared each stock with the NIFTY 50 line.
- I read return, worst fall and volatility together.
- I looked for the reason behind any big gap (results, news, corporate actions).
- I remembered dividends are not included.
- Any decision uses my own risk limits and position size.
Glossary
| Rebasing | Starting every line at the same value (0%) on the same day so performance can be compared fairly. |
| Return | The % change in price over the period; here, price only, without dividends. |
| Volatility | How much the price swings; here the standard deviation of daily changes, scaled to a year. |
| Maximum drawdown (worst fall) | The largest drop from a high to a later low. |
| Beta | How much a stock has tended to move for each 1% move in NIFTY 50. |
| Benchmark | The reference you compare against; here NIFTY 50. |
| Relative performance | How a stock did compared with another stock or the index, rather than on its own. |
| Adjusted prices | Past prices changed for splits and bonuses so the chart has no false jumps. |
Questions
How do I compare two stocks on one chart?
Open ChartMine’s Compare stocks tool and add up to five NSE stocks with the search box. Every line starts at 0% on the first day of the range you pick (1M to 2Y), with NIFTY 50 as a reference, and a table shows return, volatility, worst fall and beta for each.
What is a good beta for a stock?
There is no good or bad beta; it depends on what you want. Beta near 1 means the stock has moved roughly with NIFTY 50, above 1 more strongly, below 1 less. Remember that beta ignores company-specific moves, so also check volatility and worst fall.
What is the difference between volatility and beta?
Volatility measures all of a stock’s price swings. Beta measures only how much it moves together with the index. A stock can have low beta and high volatility if it often moves on its own news, as Infosys did in the year to November 2026 (beta 0.69, volatility 32%).
What does maximum drawdown mean?
It is the biggest fall from a closing high to a later closing low within the chosen period: the worst loss someone who bought at the top would have seen before any recovery.
Does the stock comparison include dividends?
No. Returns are price changes only, adjusted for splits and bonuses. Shareholders of high-dividend stocks earned somewhat more than the chart shows.
How many stocks can I compare at once?
Up to five NSE stocks, plus NIFTY 50, which is always shown as the benchmark. Adding a sixth drops the oldest one.