
☰ All tutorials
Start here
Tool tutorialsHow to trade with ChartMineStocks
Stock monitorMy watchlistStock scores & checklistMarket & sectors
Nifty 50Bank NiftySensexFin NiftyDaily market reportMarket breadthSector rotationSector heatmapStock screenerRelative strength (RS)MCX commodity pricesFear & Greed IndexWhat happens after…Scanners
Top gainers & losersStocks to watch tomorrowNR7 stocks scannerInside bar stocks52-week high stocksGap up & gap down stocksRSI oversold stocksGolden cross stocksSuperTrend buy stocksScan builderEMA 9/21 crossoverMACD crossoverADX strong trendBollinger breakout / squeezeVolume spike stocksOpen = high / open = lowCandlestick pattern scannerNarrow CPR scannerF&O data
F&O ban listOI build-upOption chainPCR & max painExpiry calendarF&O lot sizesOI build-up heatmapPCR trendMax pain trendFutures basisStock screens
Quarterly growersProfit growth stocksLow P/E stocksMutual fund buyingNear 52-week low, growingDebt-free companiesHigh ROE & ROCEMagic Formula stocksLow price-to-bookSmart money
FII / DII dataShareholding changesBig-money footprintShort selling dataF&O positions by participantBulk & block dealsPromoter buyingDelivery percentageCalendars
Results calendarQuarterly results trackerBoard meetingsCorporate actionsIPO calendarIPO performanceResearch & planning
Strategy testerCompare stocksDividend yield stocksASM / GSM listExpiry-day movesSeasonality & stock historyNSE holidays 2026Position size calculatorOption payoff calculatorPivot point calculatorMore
Stock scanners hubStock screensHow to use the candlestick pattern scanner
A plain-language tutorial on the 15 candlestick patterns ChartMine scans every evening: how to read a candle, the exact rule behind each pattern, how to use the hub and the pattern pages, and what two years of data on NSE F&O stocks say about what happened next.
What a candlestick is, in plain words
A candlestick is a way of drawing one trading day of a stock as a small picture. Japanese rice traders used it centuries ago; today it is the default chart in every trading app.
- The thick part is the body. It runs from the open (first price) to the close (last price).
- A green (or white) body means the stock closed higher than it opened. A red (or black) body means it closed lower.
- The thin lines above and below are the shadows (or wicks). The top of the upper shadow is the day’s high; the bottom of the lower shadow is the day’s low.
A candlestick pattern is a shape made by one, two or three candles that traders believe says something about the balance between buyers and sellers. A long lower shadow, for example, shows that sellers pushed the price down during the day but buyers brought it back.
One line to remember: a pattern describes what happened in one to three sessions. Whether it tells you anything about the next sessions is a question you can test with data, and ChartMine does exactly that for every pattern.
The candlestick pattern scanner checks every NSE F&O stock and the main indices after each close for 15 classic patterns. Each pattern has its own page with today’s list, the exact rule and a two-year “what happened next” study.
How the scanner decides: the building blocks
Books describe patterns with words like “small body” and “long shadow”. A scanner needs numbers. These are the building blocks ChartMine uses; every pattern page lists its exact thresholds.
| Term | How it is measured |
|---|---|
| Body | The gap between open and close: |close − open|. |
| Range | High − low for the day. |
| Upper / lower shadow | High minus the top of the body / bottom of the body minus the low. |
| Long body | Bigger than the average body of the 10 sessions before it. |
| After a decline | The close of the session before the pattern was below its 10-day average, or below the close 5 sessions earlier. |
| After an advance | The close of the session before the pattern was above its 10-day average, or above the close 5 sessions earlier. |
The trend condition matters because some patterns have the same shape but opposite meanings depending on what came before. A hammer and a hanging man look identical; one appears after a fall, the other after a rise.
- Candles are daily, from NSE’s end-of-day files, adjusted for splits and bonuses.
- Diwali Muhurat sessions (one hour long) are skipped, so they do not create fake patterns.
- The universe is the F&O list (about 220 stocks) plus NIFTY 50, BANK NIFTY and FIN NIFTY.
The 15 patterns and their exact rules
Single-candle patterns
| Pattern | Reading | Rule used by the scanner |
|---|---|---|
| Doji | Neutral | Body at most 10% of the range. No trend condition. |
| Hammer | Bullish | Body at most one third of the range, lower shadow at least 2× the body, upper shadow at most 10% of the range, after a decline. |
| Hanging man | Bearish | The hammer shape, after an advance. |
| Shooting star | Bearish | Body at most one third of the range, upper shadow at least 2× the body, lower shadow at most 10% of the range, after an advance. |
| Inverted hammer | Bullish | The shooting-star shape, after a decline. |
| Bullish marubozu | Bullish | Green, long body, each shadow at most 5% of the range. No trend condition. |
| Bearish marubozu | Bearish | Red, long body, each shadow at most 5% of the range. No trend condition. |
Two-candle patterns
| Pattern | Reading | Rule used by the scanner |
|---|---|---|
| Bullish engulfing | Bullish | Day 1 red, day 2 green; day 2 opens at or below day 1’s close and closes at or above day 1’s open, with a bigger body. After a decline. |
| Bearish engulfing | Bearish | The mirror: day 1 green, day 2 red with a bigger body covering day 1’s. After an advance. |
| Bullish harami | Bullish | Day 1 a long red candle; day 2’s body sits inside day 1’s body and is at most half its size. After a decline. |
| Bearish harami | Bearish | Day 1 a long green candle; day 2’s small body sits inside it. After an advance. |
| Piercing line | Bullish | Day 1 a long red candle; day 2 opens below day 1’s close and closes green above the midpoint of day 1’s body, but below its open. After a decline. |
| Dark cloud cover | Bearish | Day 1 a long green candle; day 2 opens above day 1’s close and closes red below the midpoint of day 1’s body, but above its open. After an advance. |
Three-candle patterns
| Pattern | Reading | Rule used by the scanner |
|---|---|---|
| Morning star | Bullish | Day 1 a long red candle; day 2 a small body at or below day 1’s close; day 3 green, closing above the midpoint of day 1’s body. After a decline. |
| Evening star | Bearish | Day 1 a long green candle; day 2 a small body at or above day 1’s close; day 3 red, closing below the midpoint of day 1’s body. After an advance. |
“Harami” is Japanese for pregnant: the small second candle sits inside the first like a baby. “Marubozu” means bald or shaven head: a candle with no shadows.
Do the patterns work? The two-year study, honestly
Every pattern page carries the same test. ChartMine found every case of every pattern in 219 NSE F&O stocks over 494 sessions, from Nov 2024 to Nov 2026, and measured the close-to-close return 1, 5 and 20 sessions later. Each result is set against any stock on any day in the same period (107,789 stock-days), because a pattern that is followed by a rise 52% of the time is not useful if any stock rises 50% of the time anyway. “Beat the market” compares each case with the average of all the stocks on that same day, which removes market-wide moves.
| Pattern | Cases | Higher after 5 sessions | Higher after 20 sessions | Beat market, 20 sessions | Verdict on the page |
|---|---|---|---|---|---|
| Doji | 11,244 | 49% | 49% | 47% | No clear edge |
| Hammer | 1,436 | 48% | 49% | 46% | No clear edge |
| Hanging man | 1,318 | 48% | 45% | 44% | No edge once the market is removed |
| Shooting star | 1,087 | 49% | 50% | 46% | Went against the textbook |
| Inverted hammer | 1,202 | 47% | 49% | 47% | No clear edge |
| Bullish engulfing | 2,536 | 47% | 49% | 47% | No clear edge |
| Bearish engulfing | 3,843 | 50% | 49% | 47% | No clear edge |
| Bullish harami | 2,797 | 50% | 51% | 47% | No clear edge |
| Bearish harami | 1,467 | 48% | 49% | 48% | No clear edge |
| Morning star | 312 | 56% | 57% | 49% | No edge once the market is removed |
| Evening star | 312 | 47% | 50% | 48% | Small lean, as the textbook says |
| Bullish marubozu | 340 | 47% | 44% | 46% | Went against the textbook |
| Bearish marubozu | 427 | 51% | 41% | 47% | Went against the textbook |
| Piercing line | 442 | 49% | 51% | 42% | Went against the textbook |
| Dark cloud cover | 730 | 48% | 49% | 47% | No clear edge |
| Any stock, any day | 107,789 | 50% | 50% | 47% | The yardstick |
In plain words:
- 10 of the 15 patterns did about the same as an ordinary day once same-day market moves were removed.
- The best-looking raw number is misleading. Morning stars were higher after 20 sessions 57% of the time, but the 312 cases fell on only 131 different days, mostly when the whole market was rising. Against the same day’s market, 49% did better, close to the 47% for any stock.
- Four patterns leaned the wrong way. After a shooting star (bearish), 51% beat the market over 5 sessions against 47% normally. After a bullish marubozu, only 43% did. After a bearish marubozu the next day was higher 59% of the time, a bounce rather than more selling. After a piercing line (bullish), 42% beat the market over 20 sessions.
- Only the evening star leaned the textbook way, by about 3 points over 5 sessions, on just 306 cases. A lean that size is easily eaten by brokerage, taxes and slippage.
Limits of the study. Returns are before costs. The stocks studied are today’s F&O list, which leaves out companies that dropped out and flatters the past. Two years is a short sample, and the rare patterns have only a few hundred cases. Past patterns are not a forecast.
So why use the scanner at all? Advantages and limits
✅ No black box
Each pattern page prints the exact rule with a diagram, so you know precisely why a stock is on the list.
✅ Honest numbers
Most sites show a single “success rate”. Here every pattern sits next to the base rate, over 1, 5 and 20 sessions, with a plain verdict.
✅ Fast shortlist
On 13 Nov 2026 the scanner found 71 pattern signals across the F&O list in seconds, instead of you opening 220 charts.
✅ Ready filters
Each pattern page has tabs for 1.5× volume and delivery of 50% or more, plus trend, RSI and sector filters.
The limits
- A pattern alone is not an edge. The study above is the main limit, and it applies to almost every pattern.
- Daily candles only. The scanner does not look at weekly charts or intraday candles, where the same pattern can look different.
- Context is not scored. A hammer at a major support level and a hammer in the middle of nowhere count the same. You add the context.
- F&O stocks only. Smaller companies are not scanned for candles.
A tour of the hub and the pattern pages
Open the candlestick pattern scanner. The hub has three parts: the pattern tiles, the two-year results table and a short note on how the scanner works.
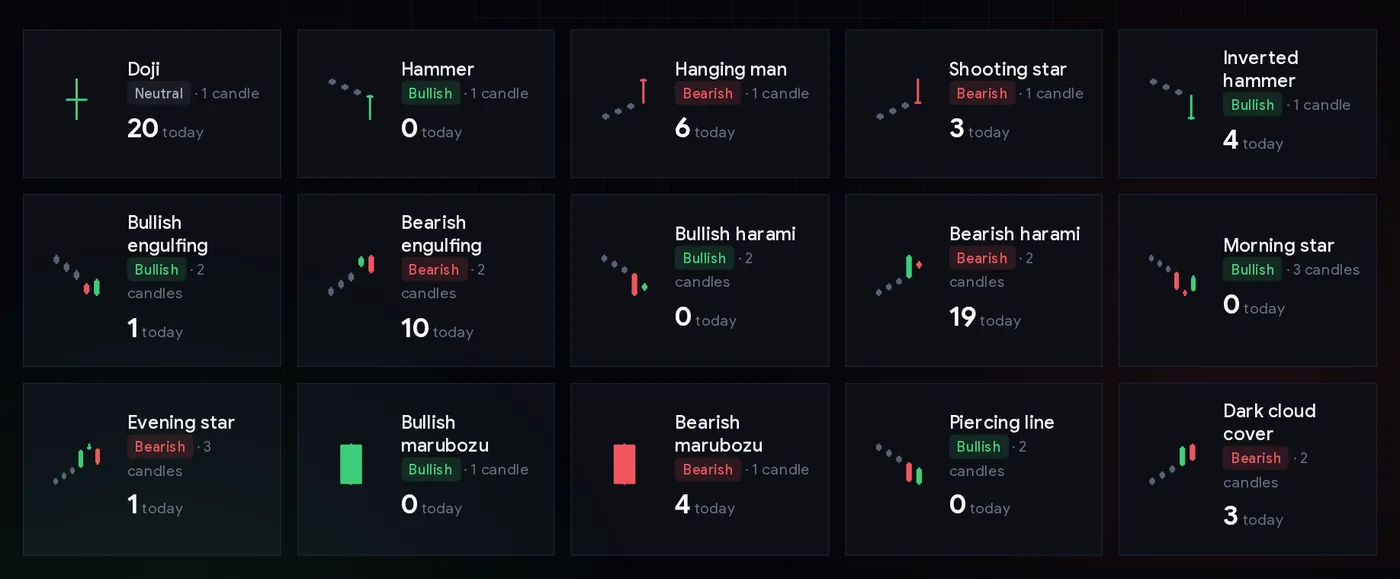
Each tile shows the candle shape, whether the pattern is read as bullish, bearish or neutral, how many candles it needs, and how many stocks formed it in the latest session. Click a tile to open that pattern’s page.
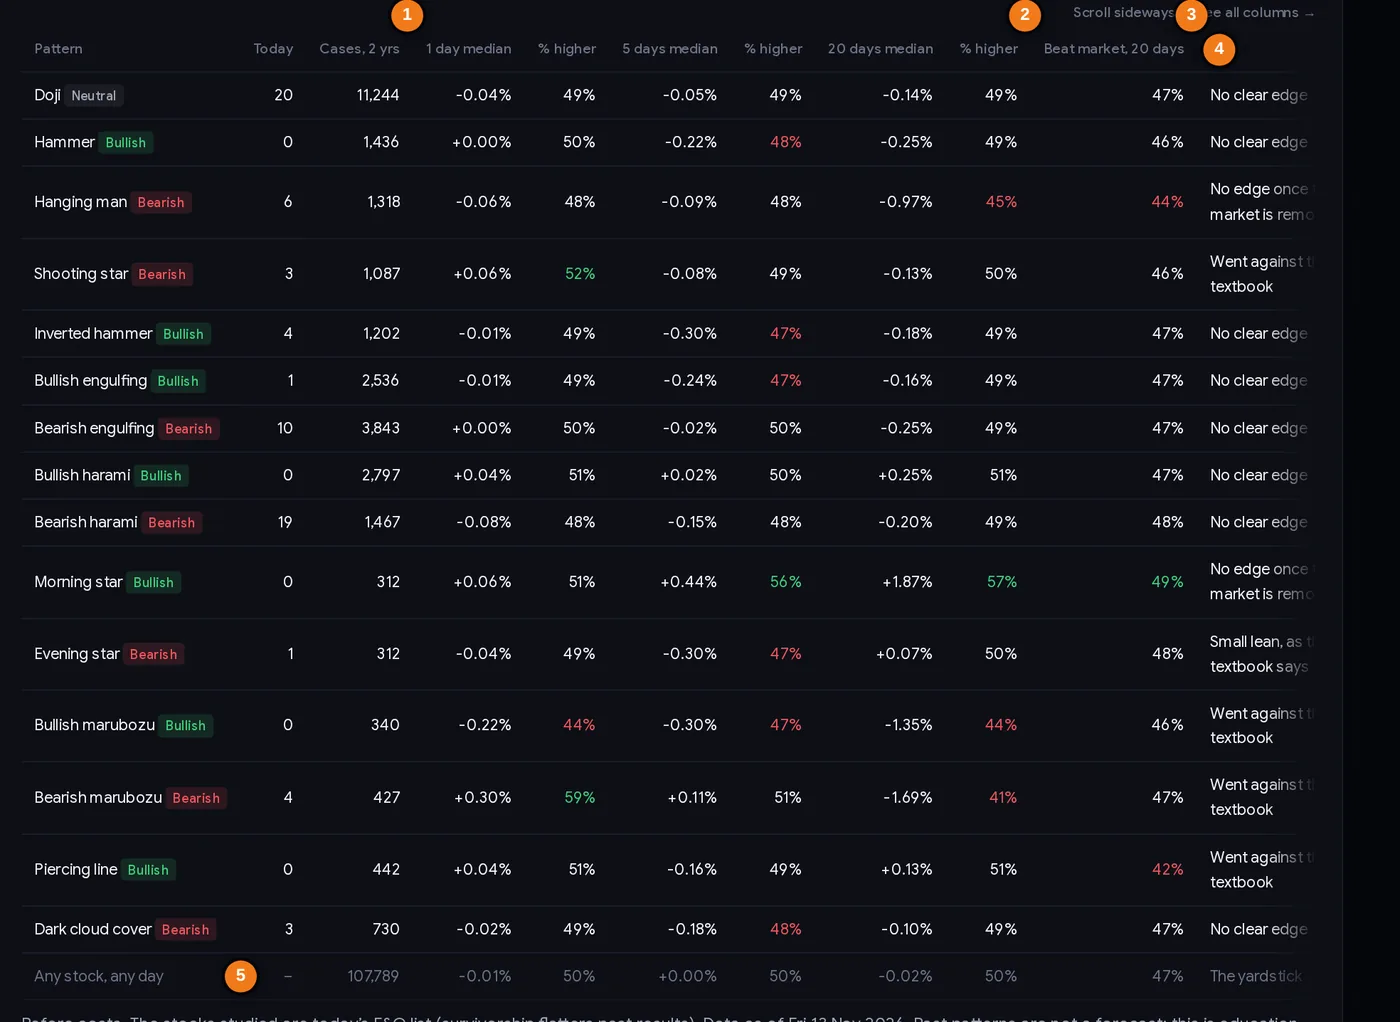
- 1Cases found in two years
- 2Share higher after 20 sessions
- 3Share that beat the same day’s market after 20 sessions
- 4Plain-language verdict
- 5The yardstick: any stock, any day
Green or red cells in the results table differ from the “any stock, any day” row by more than 2 points. Read across a row: cases, the median return and the share that were higher after 1, 5 and 20 sessions, the share that beat the market, and the verdict.
Inside a pattern page
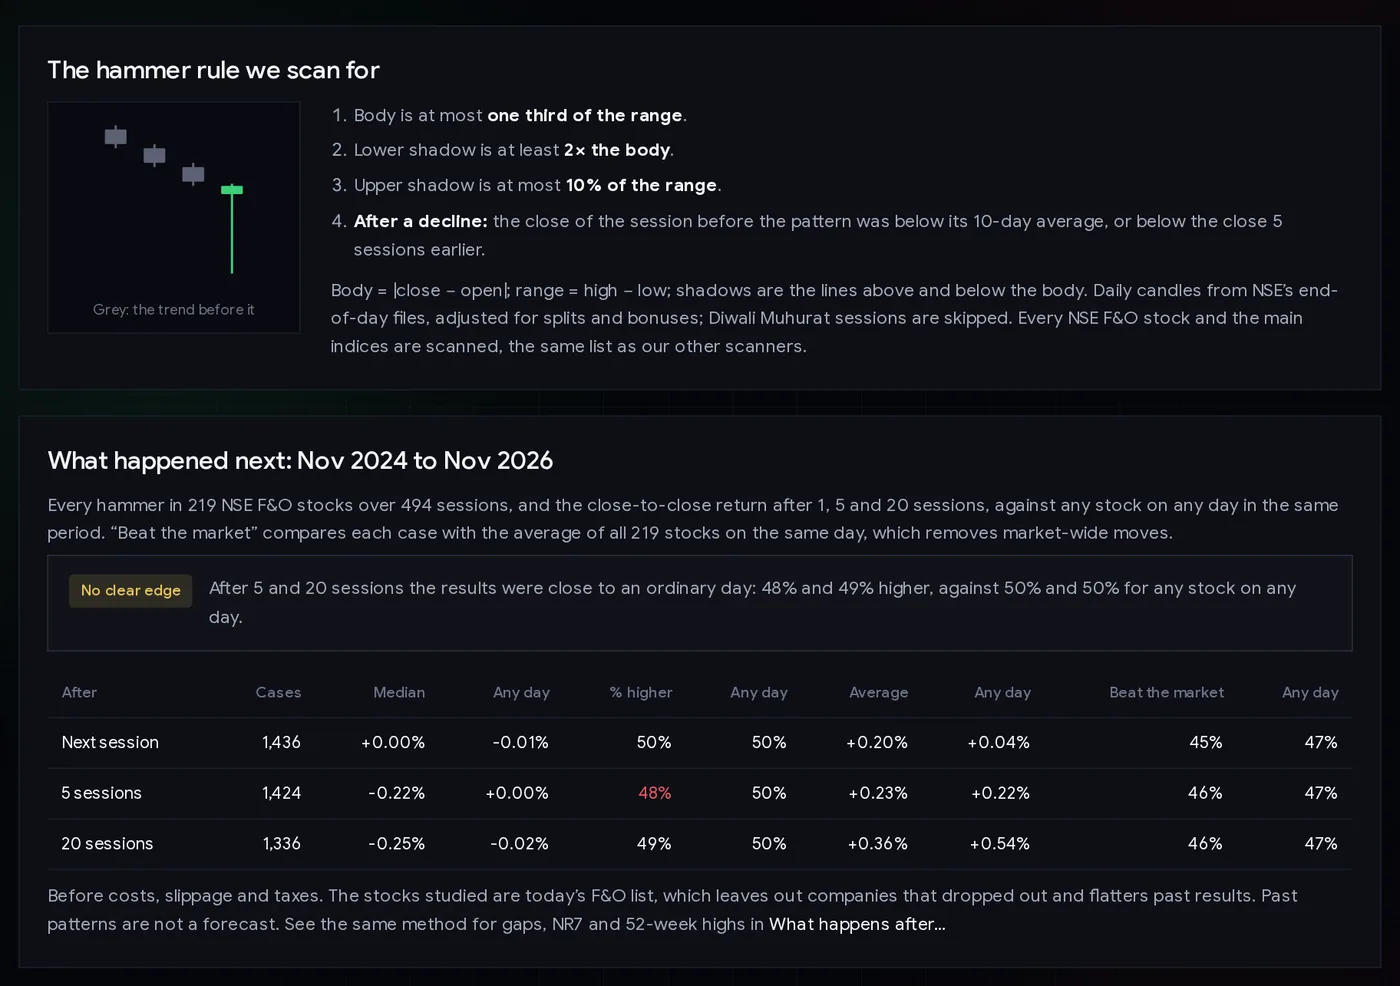
| Part | What it gives you |
|---|---|
| Tabs | Today’s list, the same list on 1.5× volume, and the list with delivery of 50% or more. |
| Results table | Symbol, close, change, day range, volume vs 20-day, delivery %, RSI, vs 200-DMA, from 52-week high, gap and other scans. Click a symbol for the stock page. |
| The rule | The exact thresholds and a diagram; grey candles show the trend the pattern needs. |
| What happened next | The pattern’s own two-year table: median, % higher, average and beat-the-market after 1, 5 and 20 sessions, next to any day. |
| How traders use it | Confirmation, stop placement and position sizing for that pattern. |
Step by step: a 10-minute evening routine
- Open the hub after the evening update and check the date line under the heading.
- Look at the mix. On 13 Nov 2026, a day when NIFTY 50 fell 0.61%, the bearish patterns dominated: bearish harami 19, bearish engulfing 10, hanging man 6. A one-sided mix mostly reflects the market’s day.
- Open one pattern page and switch to the 1.5× volume tab. A pattern on heavy volume at least shows real participation.
- Check the trend column. A bullish pattern above the 200-day average is a dip in an uptrend; below it, it fights the trend.
- Remove event risk. Results or news often create big candles. Check the results calendar.
- Wait for confirmation. Many traders act only if the next session closes beyond the pattern’s high (bullish) or low (bearish).
- Decide the stop first: just beyond the pattern’s low or high. Size with the position size calculator.
Three playbooks
Playbook A: confirmation at a level you already watch
Start from a level that matters to you, such as a support zone, the 200-day average or a previous breakout. Only when a bullish pattern (hammer, bullish engulfing, morning star) forms at that level do you pay attention, and you act only if the next session closes above the pattern’s high. The stop goes below the pattern’s low. The pattern is the trigger; the level is the reason.
Playbook B: the review signal for holders
Investors who already own a stock can treat a bearish pattern (bearish engulfing, evening star, dark cloud cover) after a strong run as a prompt to review, not as an exit order. Some tighten a trailing stop or book part of a profit. Given the study, a bearish candle alone is a weak reason to sell a good holding.
Playbook C: patterns as a filter, not a signal
Some traders use the scanner the other way round: they already have a setup (an NR7, an inside bar, a breakout) and use the candle only to refine the entry. For example, they skip a long trade if the last candle was a bearish engulfing on heavy volume.
Always decide the loss first. Risk a small, fixed part of your capital per trade, for example 0.5%: with ₹5 lakh that is ₹2,500. If your stop is ₹25 away, the size is 100 shares.
Case studies from real NSE data
Real cases from the study’s own records and the latest scan. Returns are close-to-close, counted in sessions as the study counts them.
1. Bullish marubozu, October 2026: the same pattern, three outcomes
On 13 Oct 2026 TCS and Tech Mahindra both formed bullish marubozus during a sharp IT rally. Five sessions later TCS was up 11.44% and TECHM 18.87%; after 20 sessions they were still up 7.63% and 14.93%. The next day, 14 Oct, Nestlé India formed one too (it opened at its low of 1,336 and closed at its high of 1,383.20). Five sessions later it was down 13.97%, and after 20 sessions down 8.68%. Across all 340 bullish marubozus in two years, the stock was higher after 20 sessions only 44% of the time.
2. Bullish engulfing, 13 Oct 2026: Titan against Yes Bank
Both stocks formed a bullish engulfing pattern on the same day. Titan was 2.36% lower after 5 sessions but 9.69% higher after 20. Yes Bank was 21.29% lower after 5 sessions and 15.16% lower after 20. The pattern was identical; the stories behind the stocks were not.
3. Shooting star, 8 Oct 2026: a bearish candle before a rally
Wipro formed a shooting star, a pattern read as a possible top. Five sessions later it was up 9.89%, and after 20 sessions up 25.02%. This matches the study: shooting stars beat the market slightly more often than an ordinary day, the opposite of the textbook.
4. The scan of 13 Nov 2026
The hub counted 71 signals: doji 20, bearish harami 19, bearish engulfing 10, hanging man 6, inverted hammer 4, bearish marubozu 4, shooting star 3, dark cloud cover 3, bullish engulfing 1 and evening star 1. Amber Enterprises was the only bullish engulfing, up 9.07% on 13.93 times normal volume. Manappuram Finance made a bearish engulfing, down 3.73% on 7.58 times volume. Petronet LNG was a bearish marubozu (it also opened at its high and closed at its low), and Canara Bank an evening star. Outcomes are not known yet; with the study in mind, these are names to study with a plan, not signals.
Common mistakes
- Trusting a “success rate” without a base rate. 52% sounds good until you know any stock was higher 50% of the time.
- Acting on the pattern day itself. Most traders wait for the next session to confirm.
- Ignoring the trend condition. A hammer shape after a rise is a hanging man, with the opposite reading.
- Ignoring the market. When most patterns of the day are bearish, it is usually the market’s day, not 50 separate stock stories.
- Reading too much into rare patterns. Morning and evening stars have only about 300 cases in two years.
- No stop. A pattern’s high or low gives a natural stop; use it.
Pre-trade checklist
- The scan date is the latest session.
- I read the pattern’s exact rule and its two-year verdict.
- The pattern formed at a level I already care about.
- Volume and delivery support it; the trend column agrees with my trade.
- No results or major event before my planned exit.
- I will wait for the next session to confirm.
- Stop beyond the pattern’s high or low; position size from that distance.
Glossary
| Candlestick | A drawing of one session’s open, high, low and close. |
| Body | The part between open and close. |
| Shadow / wick | The thin lines above and below the body, reaching the high and low. |
| Doji | A candle with almost no body: open and close nearly equal. |
| Engulfing | A second body that fully covers the first, in the opposite colour. |
| Harami | A small second body inside a long first body. |
| Marubozu | A long candle with almost no shadows. |
| Confirmation | The next session closing in the direction the pattern suggests. |
| Base rate | How often something happens on any day, used as the yardstick. |
| Beat the market | Doing better than the average stock over the same days. |
Questions
Which candlestick patterns does ChartMine scan?
Fifteen: doji, hammer, hanging man, shooting star, inverted hammer, bullish and bearish engulfing, bullish and bearish harami, morning star, evening star, bullish and bearish marubozu, piercing line and dark cloud cover, on daily candles of every NSE F&O stock and the main indices.
Do candlestick patterns work in the Indian stock market?
Mostly not on their own, on ChartMine’s numbers. Over Nov 2024 to Nov 2026, 10 of the 15 patterns did about the same as an ordinary day in 219 F&O stocks once market moves were removed, and four leaned the opposite way to the textbook.
Which candlestick pattern is the most reliable?
None stood out. The morning star had the best raw figure (57% higher after 20 sessions against 50%), but that came from the days it appeared on; against the same day’s market it was close to average.
What is the difference between a hammer and a hanging man?
They have the same shape: a small body near the top with a long lower shadow. A hammer comes after a decline and is read as bullish; a hanging man comes after an advance and is read as bearish.
What is the difference between engulfing and harami?
In an engulfing pattern the second body is bigger and covers the first. In a harami the second body is small and sits inside the first.
When is the candlestick scanner updated?
Every trading day after NSE publishes its end-of-day files, usually by 8 PM IST. The two-year results are recalculated at the same time.
Can I use these patterns for intraday trading?
The scanner uses daily candles. The same shapes appear on intraday charts, but the rules, the frequency and the results there are different and are not covered by this study.