
☰ All tutorials
Start here
Tool tutorialsHow to trade with ChartMineStocks
Stock monitorMy watchlistStock scores & checklistMarket & sectors
Nifty 50Bank NiftySensexFin NiftyDaily market reportMarket breadthSector rotationSector heatmapStock screenerRelative strength (RS)MCX commodity pricesFear & Greed IndexWhat happens after…Scanners
Top gainers & losersStocks to watch tomorrowNR7 stocks scannerInside bar stocks52-week high stocksGap up & gap down stocksRSI oversold stocksGolden cross stocksSuperTrend buy stocksScan builderEMA 9/21 crossoverMACD crossoverADX strong trendBollinger breakout / squeezeVolume spike stocksOpen = high / open = lowCandlestick pattern scannerNarrow CPR scannerF&O data
F&O ban listOI build-upOption chainPCR & max painExpiry calendarF&O lot sizesOI build-up heatmapPCR trendMax pain trendFutures basisStock screens
Quarterly growersProfit growth stocksLow P/E stocksMutual fund buyingNear 52-week low, growingDebt-free companiesHigh ROE & ROCEMagic Formula stocksLow price-to-bookSmart money
FII / DII dataShareholding changesBig-money footprintShort selling dataF&O positions by participantBulk & block dealsPromoter buyingDelivery percentageCalendars
Results calendarQuarterly results trackerBoard meetingsCorporate actionsIPO calendarIPO performanceResearch & planning
Strategy testerCompare stocksDividend yield stocksASM / GSM listExpiry-day movesSeasonality & stock historyNSE holidays 2026Position size calculatorOption payoff calculatorPivot point calculatorMore
Stock scanners hubStock screensHow to use the OI build-up heatmap
A plain-language guide to the 20-session OI build-up heatmap: futures and open interest for beginners, what each colour and pattern means, an honest streak study on 580 sessions, a tour of the screen and five real streaks.
What the OI build-up heatmap is, in plain words
Every evening each F&O stock’s futures can be put into one of four boxes, depending on whether the price and the open interest (OI) (the number of futures contracts still open) went up or down. These are the four build-up types: long build-up, short build-up, short covering and long unwinding.
One day’s label is a snapshot. The OI build-up heatmap turns it into a film: one row per F&O stock, one coloured square per session, for the last 20 sessions (about a month). In a few seconds you can see which stocks keep adding long positions, which keep adding shorts, which are choppy, and where the pattern just changed.
One line to remember: the heatmap shows how long and how consistently positions have been building. A long run of one colour is an established trend in positioning. It can also be a crowded one, and our data says long runs of long build-up were more often followed by a pull-back than by more gains.
F&O basics in two minutes
If futures and open interest are new to you, here is the minimum you need.
| Term | Simple meaning |
|---|---|
| Futures | A contract to buy or sell a fixed lot of shares at a set price on the expiry date (the last Tuesday of the month for stocks). The buyer is long, the seller is short. |
| Open interest (OI) | How many futures contracts are still open. It rises when new positions are opened and falls when positions are closed. |
| Lot | The fixed quantity per contract, e.g. 750 shares for SBI. See lot sizes. |
| Expiry and rollover | Contracts end every month. Traders who want to keep a position close the old month and open the next: a rollover. ChartMine adds up OI across all months so rolling does not look like closing. |
The four colours
| Colour | Build-up | Price | OI | Plain meaning |
|---|---|---|---|---|
| Green | Long build-up | Up | Up | New buyers came in. |
| Red | Short build-up | Down | Up | New sellers came in. |
| Blue | Short covering | Up | Down | Short sellers closed (bought back). |
| Yellow | Long unwinding | Down | Down | Buyers closed (sold out). |
| Dark / empty | No label | No data | The stock had no futures that day (for example it joined F&O recently), or price or OI was unchanged. | |
The daily calculation is the same as on the OI build-up page: near-month futures price change, and OI change summed over all expiries. That tutorial explains each type in depth.
Patterns you will see, and what they mean
| Pattern in a row | What it describes | What to keep in mind |
|---|---|---|
| A solid run of green at the right end | Several sessions of fresh buying with a rising price. | Positioning and price agree. Long runs can be late in the move. |
| A solid run of red | Several sessions of fresh selling with a falling price. | Shorts are crowding in; a sharp short-covering bounce is possible. |
| Red turning blue | Fresh selling followed by shorts closing. | The selling pressure is easing; not yet fresh buying. |
| Green turning yellow | Fresh buying followed by longs closing. | Buyers are taking profit or giving up. |
| A flip: red run, then green run | The crowd switched sides. | Often visible a few days into a new trend. |
| A mix of all four colours | No consistent positioning. | Single-day labels mean little here. |
The Streak number at the end of each row counts how many sessions in a row today’s colour has appeared. Rows are grouped by today’s build-up (long build-up first, then short covering, long unwinding and short build-up), and within each group the longest streaks come first.
Why traders use the heatmap: advantages and limits
✅ A month on one screen
About 200 stocks × 20 sessions. The same information would take hours to collect from daily lists.
✅ Consistency, not noise
One day of long build-up can be anything. Five in a row is a pattern worth knowing about.
✅ Spots flips early
A row that turns from red to green stands out immediately.
✅ Details on hover
Hover any square to see that day’s futures price change and OI change.
The limits: what our streak study found
We measured every stock’s build-up streaks over 580 sessions (July 2024 to November 2026), and what the share price did over the next five sessions. For comparison, across all stock-days the price was higher five sessions later 49.0% of the time.
| Streak of the same build-up | Long build-up: higher 5 days later | Short build-up: higher 5 days later |
|---|---|---|
| 1 day | 48.9% | 48.7% |
| 2 days | 47.5% | 47.0% |
| 3 days | 46.7% | 48.0% |
| 4 days | 45.8% | 47.8% |
| 5 days or more | 41.2% (279 cases, median −0.60%) | 48.0% (793 cases, median −0.09%) |
- Long build-up streaks did not predict more gains. The longer the green run, the less often the price was higher a week later. After five or more green sessions, the stock was lower five days later in most cases.
- Short build-up streaks were neutral. Long red runs were followed by a higher price about as often as any stock: no follow-through, but no reliable bounce either.
- Long streaks are not rare. In 580 sessions there were 263 long or short build-up streaks of six sessions or more.
So how should you use it? To understand the positioning behind a move and to judge whether a trend is fresh or mature. A long green run is a reason to tighten risk, not to chase. Every trade still needs a level, a stop loss and a position size.
A tour of the heatmap screen
Open the OI build-up heatmap. Under the title you will find the colour key, a hint bar, and the grid itself.
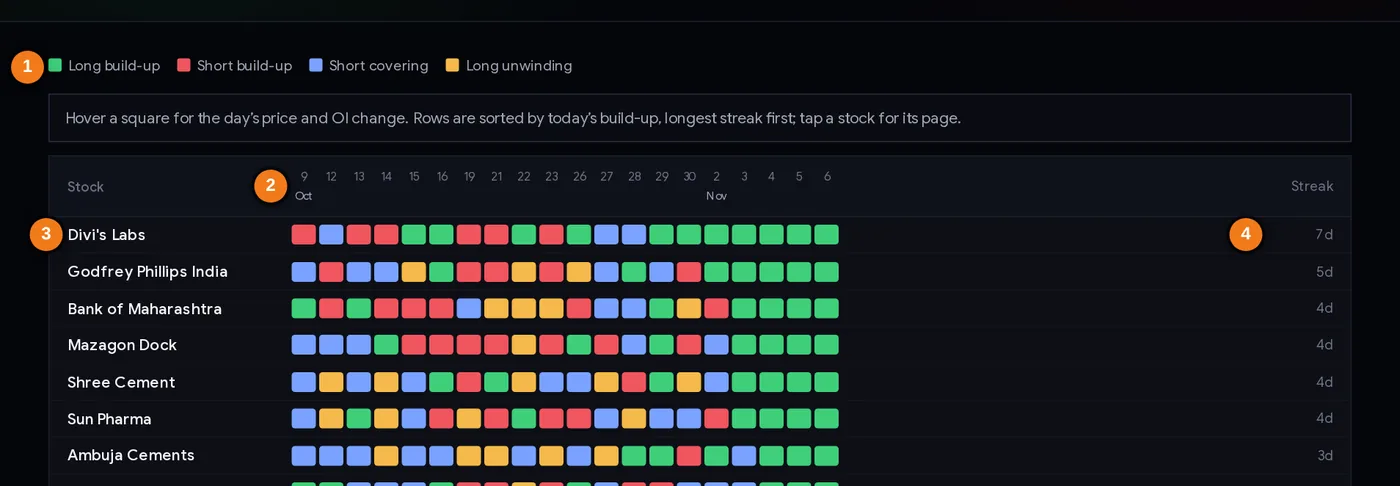
- 1Colour key for the four build-up types
- 2One column per session; the latest is on the right
- 3Stock name (click for its page)
- 4Current streak in sessions
Each row is one F&O stock; click a name to open its page. Each column is one trading session, oldest on the left and the latest on the right; the month is printed under the first date of each month. Hover a square and the hint bar shows that day’s numbers, for example “Divi’s Labs · 6 Nov · Long build-up · futures +1.65% · OI +7.35%”.
The top row in this picture is Divi’s Labs, whose last seven squares are green: seven sessions of long build-up in a row (case study 1).
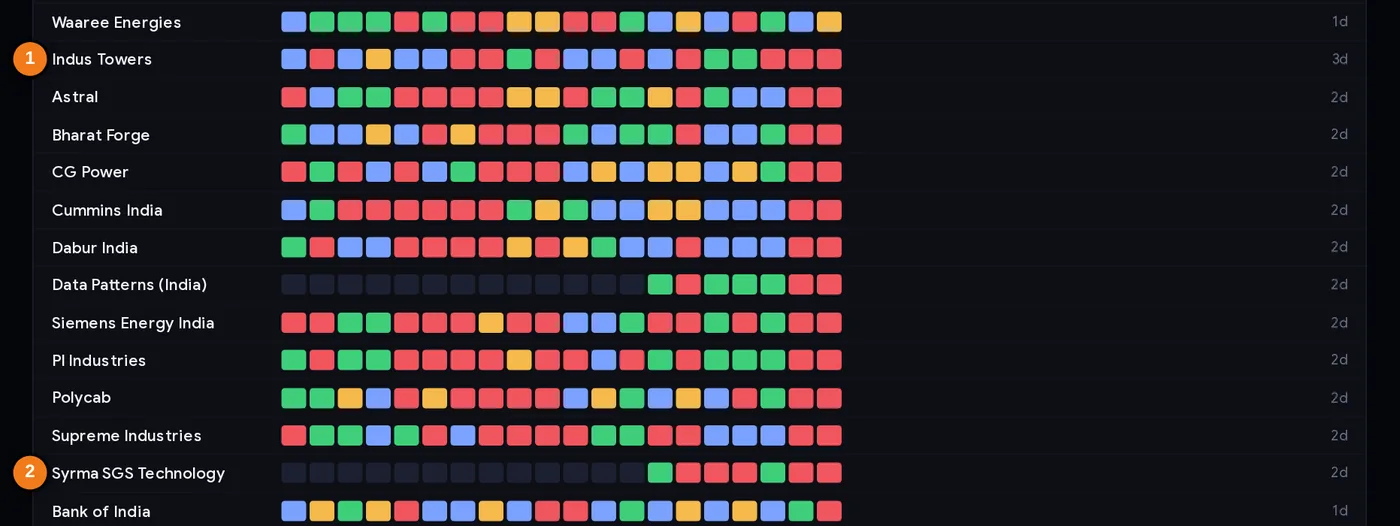
- 1Longest current short build-up streak in this group (Indus Towers, 3 days)
- 2Syrma SGS: dark squares before it joined F&O
Further down the page are the stocks whose latest build-up is short build-up, longest streak first. Two rows here start with dark squares: Data Patterns and Syrma SGS joined the F&O segment on 28 Oct 2026, so there is nothing to show before that.
Every part explained
| Part | What it tells you |
|---|---|
| Colour key | Green long build-up, red short build-up, blue short covering, yellow long unwinding. |
| Hint bar | Shows the date, build-up, futures % change and OI % change of the square under your mouse. |
| Stock column | Company name; links to the stock’s ChartMine page. |
| Date columns | The last 20 sessions. The rightmost square is the latest close. |
| Streak | Sessions in a row with today’s build-up, e.g. “7d”. |
| Row order | Grouped by today’s build-up, then longest streak first. |
Step by step: a 10-minute weekly review
- Open the heatmap after the evening update. The rightmost column should be the latest session.
- Scan the top of the page. The first rows are today’s longest long build-up streaks. Ask: is this a fresh move or a mature one?
- Scroll to the short build-up group at the bottom: the longest red runs are where shorts are most crowded.
- Look for flips. A row whose left half is red and right half green (or the reverse) shows a change in positioning.
- Hover the key squares to check the size. A green square with futures +0.2% and OI +0.3% is weak; +3% and +10% is strong.
- Open the OI build-up table for the names you shortlisted, to check premium, rollover and volume.
- Check the chart and the calendar (results, ex-dividend dates, the ban list) before forming any view.
Three playbooks
Playbook A: fresh trend, early entry
Look for rows where the colour has just changed and held for two or three sessions with meaningful moves (hover to check). A stock that flips from red to green, while the index is also rising, is a candidate for a trend-following trade. Enter only on price confirmation (for example a close above a recent high) with a stop below a recent swing low.
Playbook B: mature trend, manage risk
If you already hold a stock that has shown five or more sessions of long build-up, our data suggests caution rather than adding: tighten the stop, book part of the profit, or wait for a pull-back. The same logic applies to shorts in a long red run, where short-covering bounces can be violent.
Playbook C: sector reading
When many stocks from the same sector show the same colour on the same days, the positioning is sector-wide, not stock-specific. Compare with the sector heatmap. Sector-wide fresh longs in a rising market are a stronger backdrop than one stock on its own.
Position size first. Decide your maximum loss per trade (for example 0.5% to 1% of capital) and use the position size calculator. Futures lots are large; a small adverse move can be a big rupee loss.
Case studies: streaks that continued, reversed and flipped
Five real streaks from ChartMine’s history. Prices are closing share prices in ₹; the streak is counted in sessions.
1. Divi’s Labs, autumn 2026: from red to green
From 25 Sep to 5 Oct Divi’s showed six sessions of short build-up; the share fell from ₹9,602.02 to ₹9,196.05 (−4.2%). The five sessions after that run, it rose 2.5%. Then the pattern reversed completely: from 29 Oct to 6 Nov it showed seven sessions of long build-up, rising from ₹9,558.51 (28 Oct) to ₹10,320.34 (+8.0%) with futures OI up 24.6%. That run is the top row of the heatmap on 6 Nov. What happens next is not known at the time of writing; the streak study says long green runs often pause.
2. Adani Power, April 2026: the run that kept going
Nine sessions of long build-up from 8 to 21 Apr 2026: share +24.3%, futures OI roughly doubled (+101.8%), and another +10.0% over the next five sessions. The exception that keeps traders hopeful.
3. ABB India, April 2026: the run that faded
Six sessions of long build-up from 15 to 22 Apr 2026: the share rose from ₹6,828.50 to ₹7,587.00 (+11.1%), OI +15.0%. Over the next five sessions it gave back 4.3% (₹7,264.50 on 29 Apr). This is the more typical outcome in our data.
4. SBI, March 2026: a red run that continued
Six sessions of short build-up from 27 Feb to 9 Mar 2026: the share fell from ₹1,209.50 to ₹1,098.50 (−9.2%) while futures OI rose 33.6%. Five sessions later it was lower again, at ₹1,066.70 (−2.9%).
5. PI Industries, September 2026: a red run that bounced
Six sessions of short build-up from 7 to 15 Sep 2026: from ₹2,465.07 to ₹2,254.91 (−8.5%), OI +18.4%. Then the shorts got squeezed: +6.9% in the next five sessions (₹2,409.97 on 22 Sep).
What the five cases teach together: the same pattern (a long run of one colour) was followed by continuation in two cases and reversal in three. That matches the study: streaks describe the past well and predict the future poorly. Stops and sizing decide the result.
Common mistakes
- Chasing long green runs. In our data, five-plus-day long build-up streaks were followed by a lower price a week later more often than not.
- Assuming a red run must bounce. SBI in March 2026 kept falling.
- Ignoring the size of each day. Hover the squares; tiny moves still get a colour.
- Reading dark squares as signals. They mean no data, usually a stock new to F&O.
- Forgetting the index. When the whole market rallies on short covering (NIFTY did for seven sessions to 6 Nov 2026), many stock rows turn blue together.
- Skipping the stop loss because “the trend is clear on the heatmap”.
Checklist before acting on a streak
- The rightmost column is the latest session.
- I have hovered the recent squares: the moves are meaningful, not tiny.
- I know whether the streak is fresh (2–3 days) or mature (5+ days).
- The index and the sector point the same way.
- The stock was not newly added to F&O (no dark squares distorting the picture).
- No results, dividend or ban issue this week, or I have planned for it.
- I have a price level for entry and a stop loss.
- Position size is set so a loss is small and planned.
Glossary
| Heatmap | A grid where colour shows a value; here, the daily build-up type. |
| Build-up | Price change and OI change read together. |
| Streak | Sessions in a row with the same build-up as today. |
| Long build-up | Price up, OI up (green). |
| Short build-up | Price down, OI up (red). |
| Short covering | Price up, OI down (blue). |
| Long unwinding | Price down, OI down (yellow). |
| Open interest | Futures contracts still open at the end of the day, all expiries added up. |
| Flip | A change from one dominant colour to another, e.g. red run to green run. |
| Short squeeze | A sharp rise as short sellers rush to buy back. |
Questions
What is an OI build-up heatmap?
A grid with one row per F&O stock and one square per session, coloured by that day’s futures build-up: green long build-up, red short build-up, blue short covering, yellow long unwinding. ChartMine’s heatmap shows the last 20 sessions.
What does a long build-up streak mean?
Several sessions in a row where both the futures price and open interest rose, i.e. fresh buying each day. In ChartMine’s data, streaks of five or more sessions were followed by a higher price five sessions later only 41% of the time.
How many days of data does the heatmap show?
The last 20 trading sessions, about one month, ending with the latest close.
Why are some squares dark or empty?
There was no futures data that day, usually because the stock joined the F&O segment recently, as Syrma SGS and Data Patterns did on 28 Oct 2026.
How are the rows sorted?
By today’s build-up (long build-up, short covering, long unwinding, then short build-up) and, within each group, by the longest current streak.
Is a long red streak a sign of a coming bounce?
Not reliably. In ChartMine’s study, stocks after five or more sessions of short build-up were higher five sessions later 48% of the time, about the same as any stock.