
☰ All tutorials
Start here
Tool tutorialsHow to trade with ChartMineStocks
Stock monitorMy watchlistStock scores & checklistMarket & sectors
Nifty 50Bank NiftySensexFin NiftyDaily market reportMarket breadthSector rotationSector heatmapStock screenerRelative strength (RS)MCX commodity pricesFear & Greed IndexWhat happens after…Scanners
Top gainers & losersStocks to watch tomorrowNR7 stocks scannerInside bar stocks52-week high stocksGap up & gap down stocksRSI oversold stocksGolden cross stocksSuperTrend buy stocksScan builderEMA 9/21 crossoverMACD crossoverADX strong trendBollinger breakout / squeezeVolume spike stocksOpen = high / open = lowCandlestick pattern scannerNarrow CPR scannerF&O data
F&O ban listOI build-upOption chainPCR & max painExpiry calendarF&O lot sizesOI build-up heatmapPCR trendMax pain trendFutures basisStock screens
Quarterly growersProfit growth stocksLow P/E stocksMutual fund buyingNear 52-week low, growingDebt-free companiesHigh ROE & ROCEMagic Formula stocksLow price-to-bookSmart money
FII / DII dataShareholding changesBig-money footprintShort selling dataF&O positions by participantBulk & block dealsPromoter buyingDelivery percentageCalendars
Results calendarQuarterly results trackerBoard meetingsCorporate actionsIPO calendarIPO performanceResearch & planning
Strategy testerCompare stocksDividend yield stocksASM / GSM listExpiry-day movesSeasonality & stock historyNSE holidays 2026Position size calculatorOption payoff calculatorPivot point calculatorMore
Stock scanners hubStock screensHow to use the Max pain trend tool
A plain-language tutorial on option max pain: what it means, how it is calculated, how often the indices and F&O stocks really finished near it, how to read every part of the page, and real expiry case studies.
What max pain is, in plain words
Every option has a buyer and a seller. On expiry day, each option is either worth something (it is “in the money”) or worth nothing. Option buyers win when options finish valuable; option sellers (writers) win when they finish worthless.
Max pain is the strike price at which, if the index or stock closed exactly there on expiry day, option buyers as a group would lose the most money. Said the other way round, it is the price at which option sellers would have to pay out the least.
The idea behind the name: big sellers (often institutions and professional desks) hold a lot of open options, and some traders believe the price tends to drift towards the point that hurts buyers most. Whether that actually happens is a question of data, and the max pain trend page is built to test it.
The page shows, for NIFTY 50, BANK NIFTY, FINNIFTY and MIDCAP NIFTY:
- today’s max pain and how far the index is from it,
- a chart of max pain against the index since July 2024,
- a scorecard: on past expiries, how close did the index actually close to the previous evening’s max pain?
It also lists every F&O stock with its own max pain and its own track record.
One line to remember: max pain is a reference level built from open interest. The index closed within 0.5% of it on 45% of NIFTY expiries since July 2024. That means it missed by more than 0.5% on most expiries.
How max pain is calculated
ChartMine calculates max pain from NSE’s end-of-day open interest (OI) for every strike of the nearest expiry. In words:
- Take one strike, say 24,700, and pretend the index closes exactly there on expiry.
- For every call strike below 24,700, the calls would be worth (24,700 − strike) each. Multiply by that strike’s call OI.
- For every put strike above 24,700, the puts would be worth (strike − 24,700) each. Multiply by that strike’s put OI.
- Add it all up. That is the total amount option sellers would pay to buyers if expiry were at 24,700.
- Repeat for every strike. The strike with the smallest total is max pain.
Formula: for each candidate price K, pain(K) = Σ call OI(s) × max(0, K − s) + Σ put OI(s) × max(0, s − K), summed over all strikes s. Max pain = the K with the lowest pain(K).
The real reading on 6 Nov 2026
| Index | Spot close | Max pain | Spot vs max pain | For expiry |
|---|---|---|---|---|
| NIFTY 50 | 25,030 | 24,700 | +1.34% | 9 Nov |
| BANK NIFTY | 59,086 | 57,200 | +3.30% | 23 Nov |
| FINNIFTY | 27,284 | 26,050 | +4.74% | 23 Nov |
| MIDCAP NIFTY | 14,009 | 13,600 | +3.01% | 23 Nov |
All four indices closed well above max pain, because the market had just rallied about 10% in eight sessions. Max pain is built from where open positions were; when the price moves fast, it lags behind.
Important: max pain changes every day as positions are opened and closed. The level on Monday can be very different from the level on expiry eve. That is why the page’s scorecard uses max pain from the evening before each expiry.
Related ideas you will meet
Max pain is one of several ways to read option open interest. They are often confused, so here they are side by side.
| Term | What it is | Where to see it |
|---|---|---|
| Max pain | The strike where buyers’ total payout at expiry would be smallest. One number from the whole chain. | This page, and PCR & max pain today |
| Highest call OI | The strike with the most open calls. Many traders read it as resistance (a ceiling) because call writers defend it. | Option chain |
| Highest put OI | The strike with the most open puts. Often read as support (a floor). | Option chain |
| PCR | Total put OI ÷ total call OI. Overall positioning. | PCR trend |
| Pinning | The belief that the price gets “pinned” to a big strike or to max pain in the last hours before expiry. | Tested by this page’s scorecard |
Index max pain vs stock max pain
- Indices have weekly expiries for NIFTY and monthly for the others, with very large open interest. The scorecard for NIFTY covers 119 expiries since July 2024.
- Stocks have monthly expiries only, so even a stock with full history has fewer than 30 expiries in the record. Their OI is smaller and their prices react to company news, so max pain is a weaker reference for stocks.
Why watch max pain: advantages and limits
✅ A level from positioning
Max pain summarises the whole option chain into one strike. It gives you a reference built from where money is actually committed.
✅ Distance tells a story
When the index is far from max pain (NIFTY +1.34% on 6 Nov 2026), it shows that the price has moved away from where most positions were opened.
✅ It is tested, not assumed
The page checks every past expiry, so you can see how often “expiry near max pain” really happened.
✅ Every F&O stock
The stock table gives each stock’s own max pain and its own record, so you can see which stocks have historically finished closer to it.
The limits (please read this part)
| Index | Expiries tested | Closed within 0.5% of max pain | Typical miss (median) |
|---|---|---|---|
| NIFTY 50 | 119 | 45% | 0.54% |
| BANK NIFTY | 42 | 50% | 0.48% |
| FINNIFTY | 43 | 53% | 0.44% |
| MIDCAP NIFTY | 42 | 29% | 0.80% |
What this means in plain words:
- About half the time the index finished near max pain, about half the time it did not. For NIFTY a 0.5% miss is roughly 125 points at today’s level, which is a lot for an option trader.
- It works best on calm weeks. Max pain is calculated from yesterday’s positions; any big news overrides it.
- Max pain follows price more than price follows max pain. On the chart the orange max pain line hugs the white price line and steps after it. Between 27 Oct and 6 Nov 2026, NIFTY’s max pain moved from 22,750 to 24,700 as the index rose from 22,750 to 25,030.
- For stocks the record is weaker. On 6 Nov 2026 the best stock in the table, Maruti Suzuki, had closed within 1% of max pain on 48% of 27 expiries. Most stocks did far worse.
So how should you use it? As one reference level among several, mainly in the last day or two before an expiry and on quiet weeks. Never as a target.
A tour of the max pain trend page
Open the max pain trend page and pick an index tab. Each tab has the same three parts.
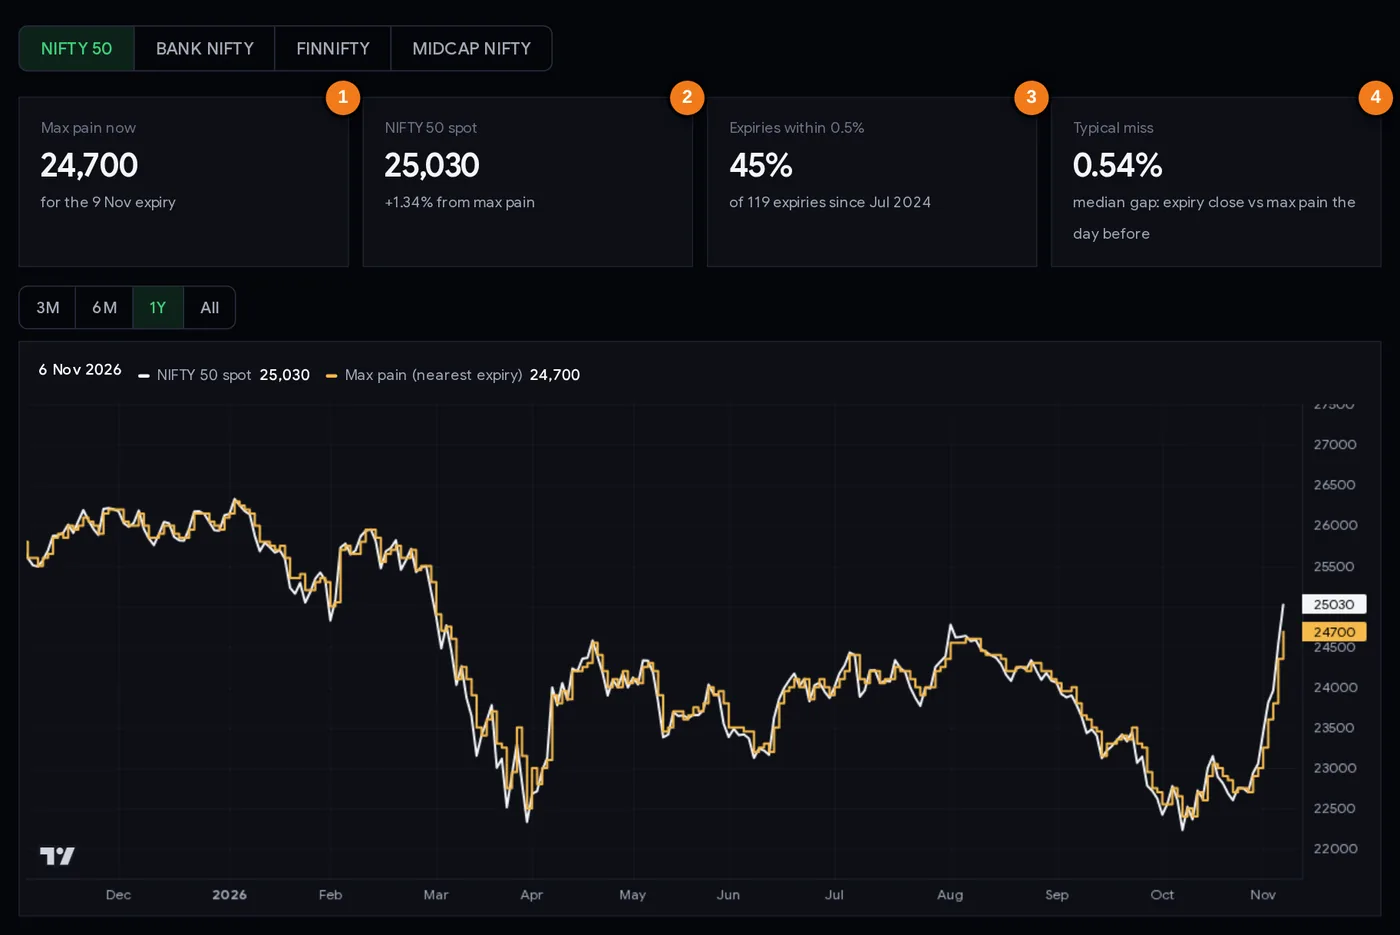
- 1Max pain now, and the expiry it belongs to.
- 2Index close and its distance from max pain.
- 3Share of past expiries that closed within 0.5% of max pain.
- 4Typical miss: the median gap between the expiry close and the previous evening’s max pain.
In the chart, the white line is the index close and the orange step line is max pain for the nearest expiry on each day. Hover to read both values for any date. Gaps between the two lines show when the market ran away from where positions were built, as at the right edge in November 2026.
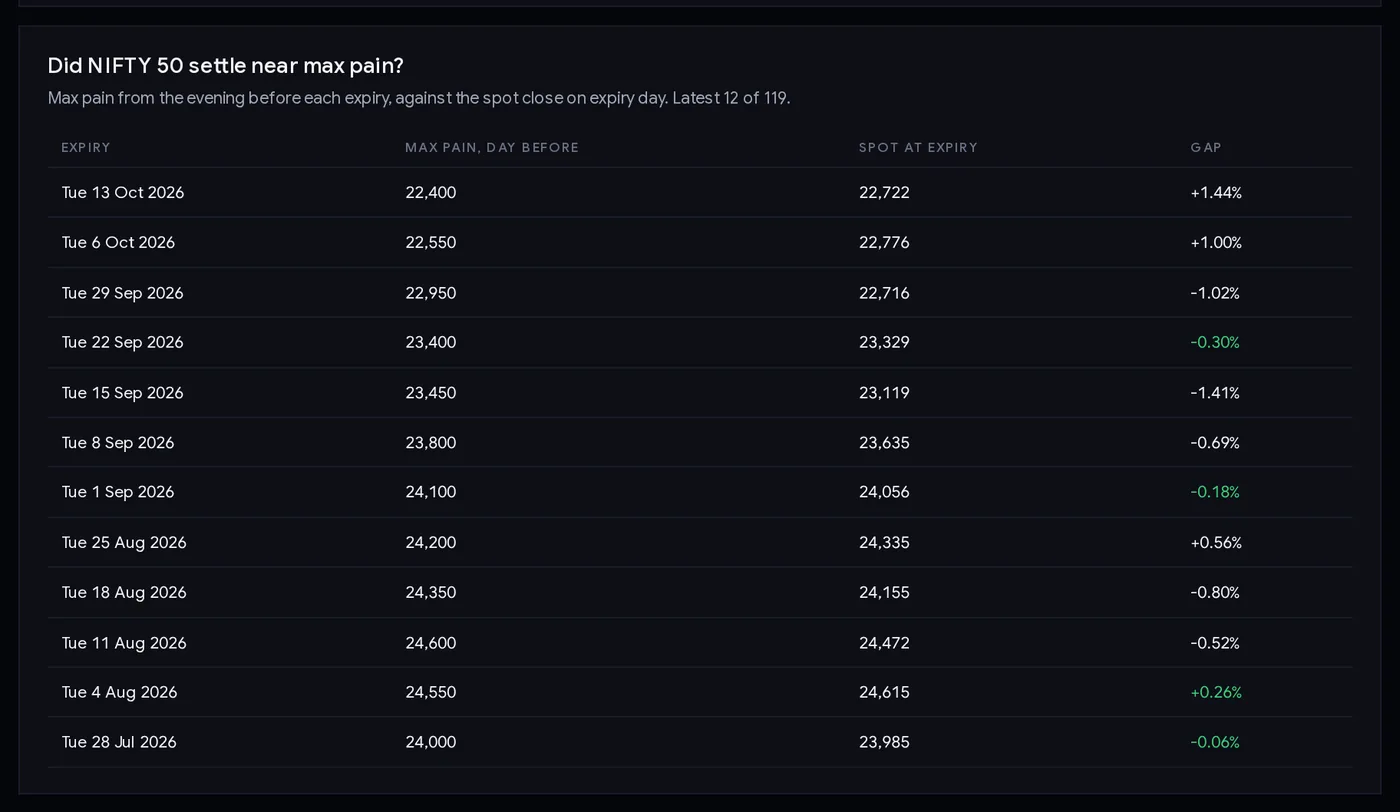
The scorecard lists the latest 12 expiries: the max pain from the evening before, the index close on expiry day, and the gap. Gaps within 0.5% are shown in green. Read down the column and you can judge for yourself how often the level held.
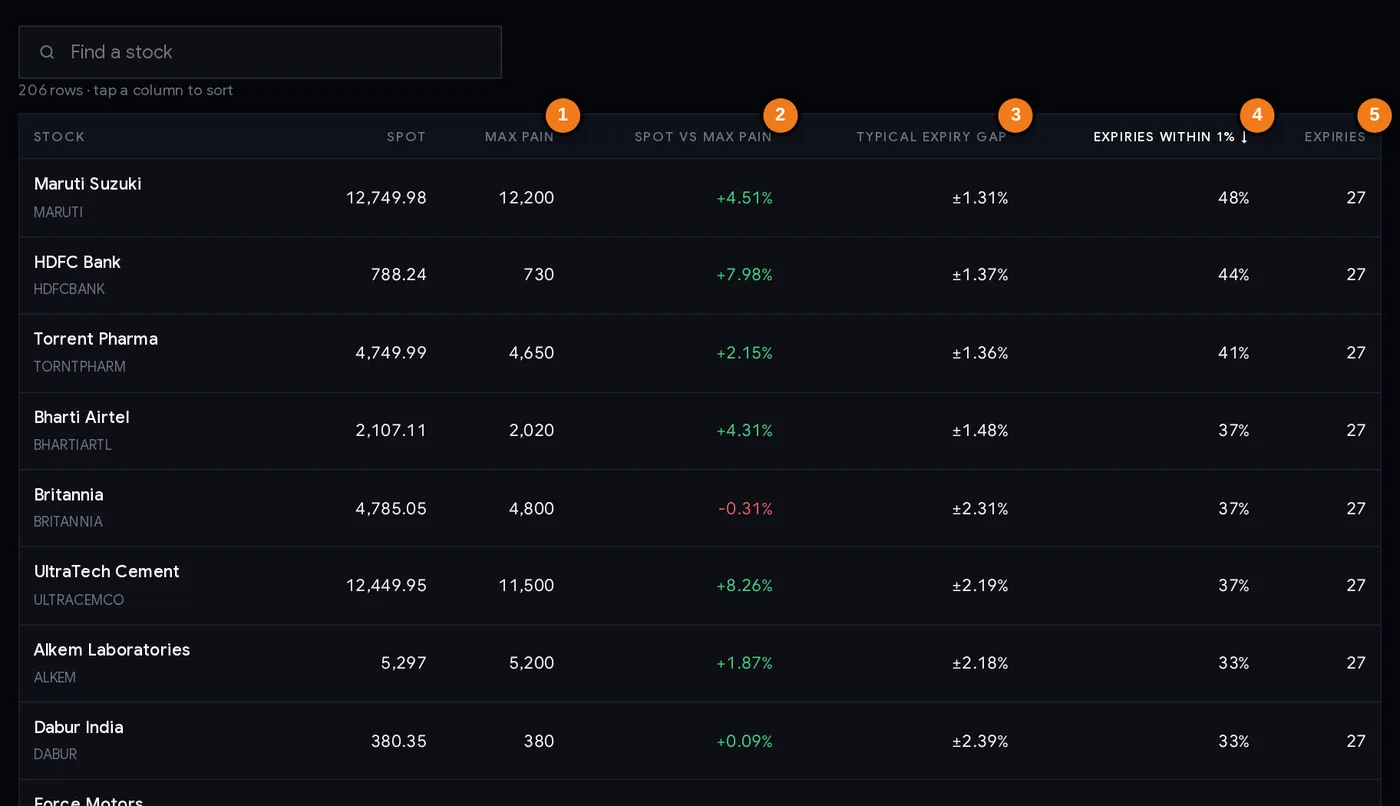
- 1Max pain for the stock’s nearest expiry.
- 2Spot price vs max pain.
- 3Typical (median) gap on past expiries.
- 4Share of past expiries within 1% of max pain.
- 5Number of expiries in the record.
Every column of the stock table
| Column | What it tells you |
|---|---|
| Stock | Name and symbol; click to open the stock page. |
| Spot | The stock’s closing price. |
| Max pain | Today’s max pain strike for the stock’s nearest (monthly) expiry. |
| Spot vs max pain | How far the price is above (+) or below (−) max pain. |
| Typical expiry gap | The median distance between the expiry-day close and the previous evening’s max pain, over past expiries. |
| Expiries within 1% | The share of past expiries that closed within 1% of max pain. The table is sorted by this, best first. |
| Expiries | How many expiries are in the record. Fewer than about 12 is too few to judge. |
Step by step: using max pain in expiry week
- Know the expiry date. The first card says which expiry max pain is for. See the expiry calendar for holidays that move it.
- Check the distance. The second card shows spot vs max pain. Within about 0.5% means the index is already near the level; 2–3% away means the market would need a big move to get there.
- Check the record. The third and fourth cards show how often this index finished near max pain and the typical miss.
- Watch it change daily. Open the page each evening in expiry week. If max pain keeps stepping in the direction of price, the level is following the market, not pulling it.
- Compare with the chain. Open the option chain to see the highest call OI and highest put OI strikes. When max pain sits between a strong put wall and a strong call wall on a quiet day, the level has more meaning.
- Check for events. RBI policy, global news, results of big index stocks or a budget can overwhelm every OI-based level.
- Plan with a stop loss. If you use max pain in a trade, decide in advance the price at which the idea is wrong.
How traders use max pain
Playbook A: a context level for option sellers
Traders who sell options near expiry sometimes use max pain to choose strikes that are far enough away from it. If NIFTY is near max pain on expiry eve and the week has been calm, a seller may place short strikes on either side. The risk is that one news headline moves the index far beyond those strikes, and losses on sold options can be large. Use the option payoff calculator to see the worst case before you trade, and size it so that worst case is affordable.
Playbook B: a reality check for directional trades
If you plan to buy a call on expiry day and the index is already 1–2% above max pain, you know positioning is not on your side and the move may already be stretched. That does not mean the trade is wrong, but it may mean a smaller size or waiting for a price level to break.
Playbook C: choose stocks with a record
For stock options, use the table’s “Expiries within 1%” and “Typical expiry gap” columns. A stock with a typical gap of 5% (as Suzlon Energy showed on 6 Nov 2026) has historically finished nowhere near max pain, so the level is close to useless for it.
Position size first. Expiry-day options can lose most of their value in hours. Use the position size calculator so that a full loss of the premium stays within your risk limit.
Case studies from real expiries
Max pain values are from the evening before each expiry; closes are on expiry day. Source: NSE end-of-day F&O data as used by the page.
1. NIFTY, 28 Jul 2026: the textbook case
Max pain on the evening of 27 Jul was 24,000. On expiry day NIFTY closed at 23,985, just 0.06% away. Weeks like this are why max pain is popular.
2. NIFTY, 27 Oct and 3 Nov 2026: one hit, one big miss
On 26 Oct max pain for the 27 Oct expiry was 22,750; NIFTY closed on 27 Oct at 22,749.75, essentially on max pain. One week later the story reversed. Max pain on 2 Nov for the 3 Nov expiry was 23,250; NIFTY closed at 23,810.85, 2.4% above, in the middle of a strong rally. The same tool, in consecutive weeks, gave a perfect hit and a large miss.
3. BANK NIFTY, 30 Mar 2026: news beats positioning
Max pain the evening before was 54,300. BANK NIFTY fell 3.8% on expiry day and closed at 50,275, 7.4% below max pain. FINNIFTY (−7.4%) and MIDCAP NIFTY (−4.3%) missed by similar amounts. It was a volatile week for the whole market; see the expiry-day moves tutorial for the day-by-day moves.
4. BANK NIFTY, Nov 2025 to Feb 2026: a run of close finishes
Four monthly expiries in a row finished within 0.35% of max pain: 25 Nov 2025 (+0.03%), 30 Dec 2025 (+0.29%), 27 Jan 2026 (+0.35%) and 24 Feb 2026 (+0.08%). Then came the 30 Mar miss above. Lesson: a good run does not protect you from the next big move.
5. Stocks, 6 Nov 2026: weak records across the board
The table ranked 206 F&O stocks by their record. The best were Maruti Suzuki (48% of 27 expiries within 1%), HDFC Bank (44%) and Torrent Pharma (41%). At the other end, stocks such as Suzlon Energy and Solar Industries had never closed within 1% of max pain in their records, with typical gaps of 5.0% and 4.8%.
Common mistakes
- Treating max pain as a target. NIFTY missed by more than 0.5% on 55% of expiries.
- Using Monday’s max pain for Tuesday’s expiry a week later. It changes every day; use the latest reading.
- Fighting a trending market. In case 2 the index ran 2.4% past max pain in a single week.
- Applying index habits to stocks. Stock records are much weaker and based on fewer expiries.
- Ignoring the calendar. Holidays shift expiry days; big events override OI.
- Selling options without a worst-case plan. A short option can lose many times the premium received.
Checklist before you use max pain
- I know which expiry the max pain is for, and the expiry date.
- I am using the latest evening’s reading.
- I checked the distance between spot and max pain.
- I checked this index’s or stock’s record (within 0.5% / within 1%, typical gap, number of expiries).
- I looked at the highest call and put OI strikes in the option chain.
- No big event is due before expiry.
- My stop loss, worst case and position size are decided.
Glossary
| Max pain | The strike at which option buyers’ total value at expiry would be smallest (sellers pay least). |
| Strike | The fixed price written into an option contract. |
| Open interest (OI) | Contracts still open at the end of the day. |
| Expiry | The last day of an option contract, when it is settled. |
| Spot | The current price of the index or stock itself. |
| In the money | An option with value at expiry: a call below the price, a put above it. |
| Option writer | The seller of an option, who receives the premium and takes the obligation. |
| Pinning | The idea that prices settle at a heavily traded strike at expiry. |
| Median gap | The middle value of all expiry misses: half were smaller, half larger. |
Questions
What is max pain in options?
The strike price at which option buyers as a group would lose the most, and option sellers pay out the least, if the market expired there. It is calculated from the open interest at every strike.
Does NIFTY expire at max pain?
Sometimes. Since July 2024 NIFTY closed within 0.5% of the previous evening’s max pain on 45% of 119 expiries; the median miss was 0.54%. So more often than not it finished further away.
How is max pain calculated?
For each strike, ChartMine adds up what all calls below it and all puts above it would be worth if the market expired there, using NSE end-of-day open interest. The strike with the smallest total is max pain.
Why is the market far from max pain today?
Max pain is built from where positions were opened. After a fast move, such as NIFTY’s 10% rally into 6 Nov 2026, price moves away and max pain follows later.
Is max pain useful for stock options?
Less than for indices. On 6 Nov 2026 the best record in the stock table was Maruti Suzuki, within 1% of max pain on 48% of 27 expiries; many stocks never finished within 1%.
When does max pain change?
Every trading day, as open interest changes. Use the latest evening’s reading, especially in expiry week.
Can I trade using only max pain?
It is not a reliable signal on its own. Use it as one reference level with price action and the option chain, and always with a stop loss and planned position size.