
☰ All tutorials
Start here
Tool tutorialsHow to trade with ChartMineStocks
Stock monitorMy watchlistStock scores & checklistMarket & sectors
Nifty 50Bank NiftySensexFin NiftyDaily market reportMarket breadthSector rotationSector heatmapStock screenerRelative strength (RS)MCX commodity pricesFear & Greed IndexWhat happens after…Scanners
Top gainers & losersStocks to watch tomorrowNR7 stocks scannerInside bar stocks52-week high stocksGap up & gap down stocksRSI oversold stocksGolden cross stocksSuperTrend buy stocksScan builderEMA 9/21 crossoverMACD crossoverADX strong trendBollinger breakout / squeezeVolume spike stocksOpen = high / open = lowCandlestick pattern scannerNarrow CPR scannerF&O data
F&O ban listOI build-upOption chainPCR & max painExpiry calendarF&O lot sizesOI build-up heatmapPCR trendMax pain trendFutures basisStock screens
Quarterly growersProfit growth stocksLow P/E stocksMutual fund buyingNear 52-week low, growingDebt-free companiesHigh ROE & ROCEMagic Formula stocksLow price-to-bookSmart money
FII / DII dataShareholding changesBig-money footprintShort selling dataF&O positions by participantBulk & block dealsPromoter buyingDelivery percentageCalendars
Results calendarQuarterly results trackerBoard meetingsCorporate actionsIPO calendarIPO performanceResearch & planning
Strategy testerCompare stocksDividend yield stocksASM / GSM listExpiry-day movesSeasonality & stock historyNSE holidays 2026Position size calculatorOption payoff calculatorPivot point calculatorMore
Stock scanners hubStock screensHow to use the stock screens
A plain-language guide to ChartMine’s ready-made stock screens: the exact rule behind each of the nine lists, the terms they use, how to read the hub and a screen page, a weekly routine, three ways to combine screens and real cases from 13 November 2026.
What ready-made stock screens are, in plain words
India has more than 2,000 listed companies on NSE. Nobody can read the results of all of them every quarter. A stock screen is a fixed set of rules, such as “P/E under 15 and profit growing”, that a computer applies to every company to give you a short list worth reading about.
The Stock screens page on ChartMine is a hub of nine ready-made screens built from company results, shareholding patterns and prices, plus links to two technical scanners and the full stock screener. Each screen has its own page with a table of matching stocks, and the hub shows how many stocks match today. On 13 Nov 2026 the counts ranged from 28 (low price-to-book) to 456 (profit growth).
Why use a ready-made screen instead of building your own? Because the rules are fixed and published, the list is rebuilt after every market close, and some checks are already built in: tiny companies are left out, one-off quarters are filtered on most screens, and lease-heavy companies are kept off the balance-sheet screens.
One line to remember: a screen gives you a reading list, not a buying list. Every name on it still needs you to open its stock page, understand the business and decide your own risk.
The nine screens and their exact rules
These rules are taken from ChartMine’s screen code, so they are exactly what decides whether a stock appears. Counts are from the hub on 13 Nov 2026 (prices of that day, fundamentals from the latest filed quarter).
Growth and value screens (from quarterly results and prices)
| Screen | Exact rule | Sorted by | 13 Nov 2026 |
|---|---|---|---|
| Quarterly growers Tutorial | Sales (income, for banks) and profit both higher than the quarter before, in each of the last three quarters. Latest profit positive; no quarter’s sales more than tripling. | Profit growth on a year ago | 132 stocks |
| Profit growth stocks Tutorial | Latest-quarter profit up 25% or more on the same quarter a year ago; the year-ago profit at least ₹10 crore; no one-off quarter; the latest quarter is not older than the one most companies have already reported. | Profit growth | 456 stocks |
| Low P/E stocks Tutorial | P/E from 3 to under 15 on the last four quarters’ earnings, two ways of calculating P/E agree, no one-off quarter, and latest-quarter sales and profit both up on a year ago. | Lowest P/E first | 163 stocks |
| Stocks mutual funds are buying Tutorial | Mutual funds’ stake up by 0.5 percentage points or more between the last two quarterly shareholding patterns. A second table does the same for foreign investors (FIIs). | Biggest stake increase | 276 stocks |
| Near 52-week low, profits growing Tutorial | Price within 10% of the 52-week low, and latest-quarter sales and profit both up on a year ago. | Closest to the low first | 61 stocks |
Balance-sheet screens (from half-yearly and annual balance sheets)
| Screen | Exact rule | Sorted by | 13 Nov 2026 |
|---|---|---|---|
| Debt-free companies Tutorial | Banks and NBFCs excluded. Borrowings under 10% of equity (debt/equity under 0.1), ROE 12% or more, not lease-heavy, no one-off quarter. | Highest ROE | 266 stocks |
| High ROE stocks Tutorial | Banks and NBFCs excluded. ROE and ROCE both 20% or more, not lease-heavy, no one-off quarter. | Highest ROE | 239 stocks |
| Magic Formula stocks Tutorial | Banks, NBFCs, lease-heavy and holding companies with large minority interests excluded; market cap ₹1,000 crore or more. Every company is ranked on earnings yield (operating profit ÷ enterprise value) and on ROCE; the two ranks are added. | Best combined rank; top 50 only | 50 stocks |
| Low P/B stocks Tutorial | Price below book value per share (P/B under 1) and ROE 10% or more, no one-off quarter. Banks and NBFCs included. | Lowest P/B first | 28 stocks |
Rules shared by all nine
- Universe: the most traded NSE stocks that have results on file, with a market cap of at least ₹500 crore. Below that, filing errors and tiny profit bases distort the lists.
- One-off quarter: a company is treated as having a one-off when the median of its last four quarterly profits is positive and one quarter is more than three times it.
- Top 150: each table shows at most 150 names. On 13 Nov five screens had more matches than that (profit growth, low P/E, mutual fund buying, debt-free and high ROE); most of these pages add a note linking to the stock screener for the rest.
- Refresh: prices update after every close; fundamentals change when companies file new results, mostly in results season.
The hub also links two technical scanners for F&O stocks: golden cross stocks (tutorial; 50-day average crossing the 200-day in the last five sessions; in the five sessions to 13 Nov only HCL Tech had a golden cross, and three stocks had a death cross) and RSI oversold stocks (tutorial; RSI(14) below 30, and overbought above 70).
Key terms used by the screens
Each screen uses one or two ratios. Here is what they mean, in one line each. The individual tutorials go deeper.
| Term | Plain meaning |
|---|---|
| YoY (year on year) | The latest quarter against the same quarter a year earlier. Removes seasonal swings (festive quarters, monsoon). |
| QoQ (quarter on quarter) | The latest quarter against the one just before. Quarterly growers use this, three times in a row. |
| P/E | Share price ÷ earnings per share of the last four quarters. How many years of current profit you pay for. |
| ROE | Profit ÷ average shareholders’ equity. Profit made on every ₹100 of the owners’ money. |
| ROCE | Operating profit ÷ capital employed (equity plus borrowings). Return on all the money in the business. |
| Debt / equity | Borrowings ÷ equity. Under 0.1 means borrowings below 10% of equity. |
| P/B | Share price ÷ book value per share. Under 1 means the market values the company below its accounting net worth. |
| Earnings yield | Operating profit ÷ enterprise value (market cap + debt − cash). The Magic Formula’s “cheapness” measure; higher is cheaper. |
| Shareholding change (points) | The change in a group’s percentage holding between two quarter-ends. 11.8% from 10.0% is +1.8 points. |
| 52-week low | The lowest price of the past year. “Within 10%” means the price is no more than 10% above it. |
| Lease-heavy | Finance costs far higher than reported borrowings explain, usually rent on shops, offices or aircraft. Such companies are kept off three balance-sheet screens. |
Why use screens: advantages and limits
✅ Saves hours
Nine fixed rules applied to every eligible stock after each close. You start from a list instead of a blank page.
✅ Rules you can read
Each rule is published, so you know exactly why a stock is on a list and what would remove it.
✅ Built-in clean-up
The ₹500 crore floor, the one-off quarter check, the lease filter and the ₹10 crore base for profit growth remove many misleading names.
✅ Cross-checking
A name that appears on several screens has passed several different tests. That is a reason to read more, not a verdict.
The limits (please read this part)
- Numbers, not reasons. A screen cannot tell you why profit jumped or the price fell. A one-time gain, a merger or a base effect can all pass a rule.
- The one-off check has a gap. It only works when the median quarterly profit is positive. On 13 Nov 2026, SPARC topped the debt-free, high ROE and Magic Formula lists on the back of one quarter (case 2).
- Fundamentals are old by design. Results arrive up to 45 days after a quarter ends (60 for the March quarter), and balance sheets only twice a year.
- Price is a separate question. Growth screens ignore valuation; value screens ignore momentum. A good company can be a poor buy at the wrong price.
- No proof of returns. This hub does not claim that any list beats the market. Where a screen’s tutorial ran a test, it reports the result honestly; the debt-free list, for example, did about the same as the market over five months in 2026.
A tour of the hub and a screen page
Open Stock screens. The hub is a grid of cards, one per screen, with the day’s count at the top of each.
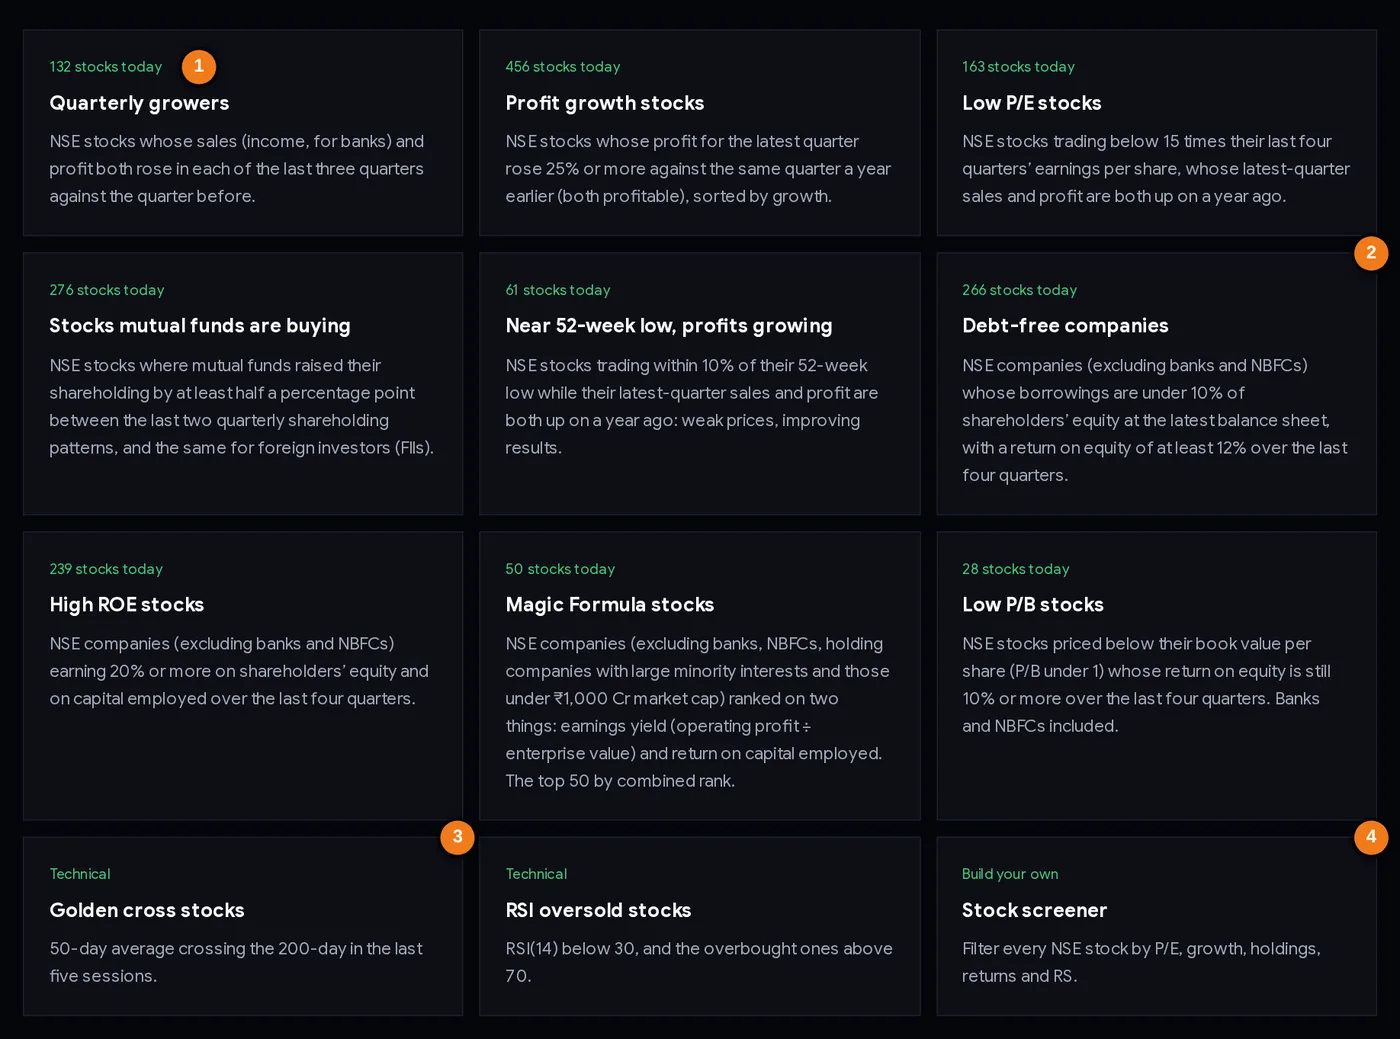
- 1How many stocks match the screen today
- 2The balance-sheet screens start here (debt-free, high ROE, Magic Formula, low P/B)
- 3Technical scanners for F&O stocks
- 4The full stock screener for your own filters
The first nine cards are the screens above, in the same order: five growth and value screens, then four balance-sheet screens. The small green line on each card is how many stocks match after the latest close. The last three cards link out: the two technical scanners and the full stock screener, where you can set your own filters (see the stock screener tutorial).
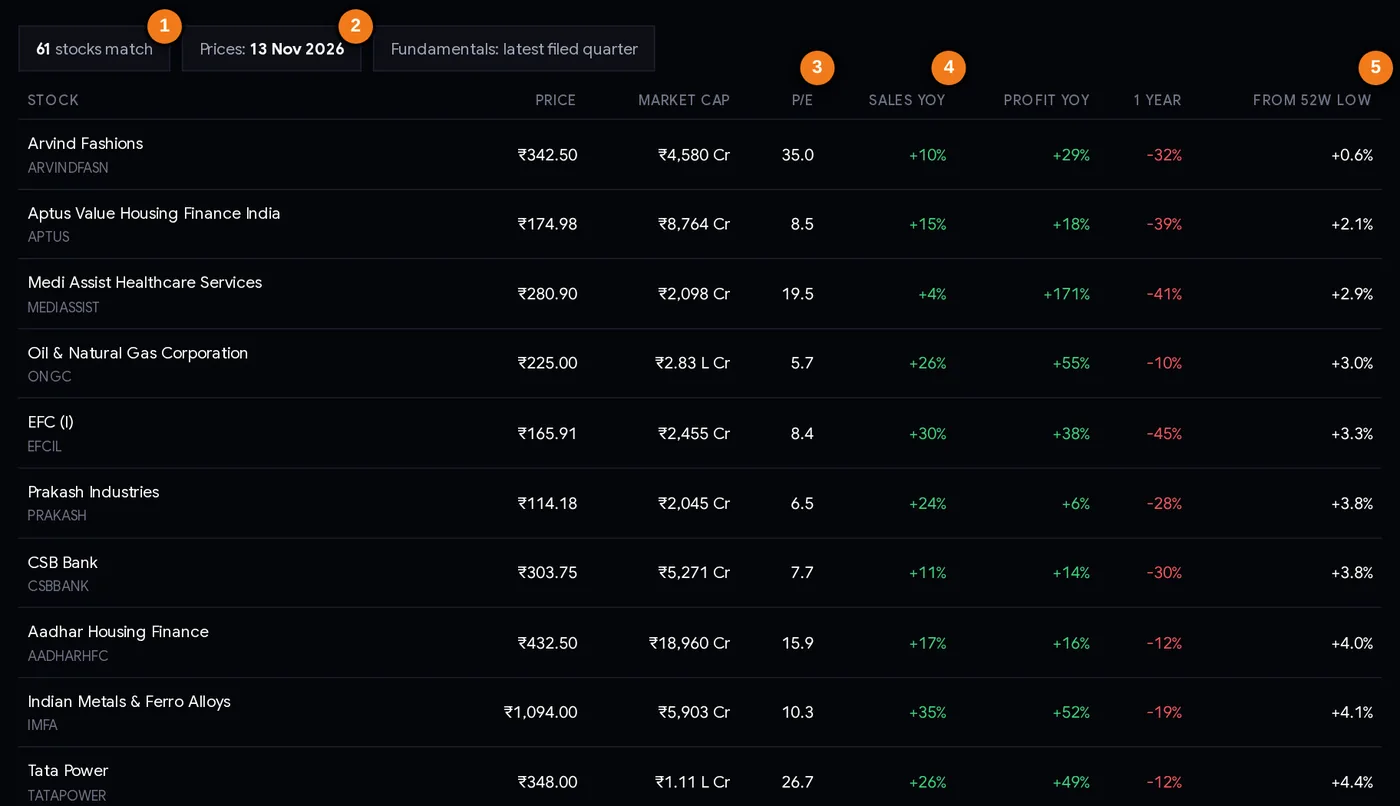
- 1How many stocks match
- 2Date of the prices used
- 3P/E on the last four quarters
- 4Sales and profit growth on a year ago
- 5The screen’s own column: here, distance from the 52-week low
Reading a screen page
Every screen page has the same layout, so once you know one you know all nine. Each screen also has its own detailed tutorial, linked in the tables above and from the screen page. The picture shows near 52-week low, profits growing on 13 Nov 2026.
| Part | What it tells you |
|---|---|
| Count chip | How many stocks match today (61 here). |
| Prices / Fundamentals chips | The date of the prices used, and a reminder that results are from each company’s latest filed quarter. |
| Stock | Company name and NSE symbol. Click to open the stock page. |
| Price, Market cap, P/E | Last close, market value in ₹ crore (“L Cr” = lakh crore), and P/E on the last four quarters. |
| Sales YoY / Profit YoY | Latest quarter against the same quarter a year ago. Red means lower. |
| 1 year | Price change over the past year. |
| Last column | Changes by screen: latest quarter (growers, profit growth), sector (low P/E), stake now and change (mutual fund buying), distance from the 52-week low, ROE, ROE / ROCE, earnings yield / ROCE, or P/B. |
Below the table, three short cards explain what to watch for on that screen, buttons jump to the other screens, and a few questions are answered. Each screen page also has a “How to use this tool” link to its own tutorial.
Step by step: a 30-minute weekly screen routine
- Pick one or two screens that fit your style (see the playbooks below). Do not try to follow all nine.
- Open the hub and note the counts. A sudden jump usually means results season has added new filings.
- Open the screen and read the top 20 names. Skip names you cannot explain in one sentence.
- Check the extremes first. A profit growth of thousands of percent, an ROE above 100% or a P/E below 5 usually has a special reason. Open the quarterly results on the stock page.
- Cross-check with a second screen. Is a low P/E name also debt-free? Is a quarterly grower also being bought by mutual funds? Use the buttons under the table.
- Read the stock page: the pros and cons box, the last eight quarters, the balance sheet and who owns the shares.
- Keep a short watchlist of three to five names in the watchlist, with one line on why each is there.
- Decide risk before any trade: position size, where you would admit you were wrong, and how long you are willing to wait.
Three ways investors combine the screens
Playbook A: quality at a reasonable price
Start from debt-free companies or high ROE stocks, then keep only names whose P/E is close to or below their sector median on the stock page. The Magic Formula list does a version of this automatically by combining a quality rank (ROCE) with a cheapness rank (earnings yield).
Playbook B: growth with confirmation
Take quarterly growers and look for names that also appear in mutual fund buying. Rising results plus institutions adding shares is a stronger starting point than either alone. Then check the price: a grower that has already doubled may have priced the growth in.
Playbook C: patient value
Look at near 52-week low and low P/B together. These are out-of-favour stocks where the results still look fine. Investors who use this approach buy in small instalments, set a maximum position size in advance and accept that a stock near its low can keep falling for months.
Risk first. No screen protects you from a falling price. Keep each stock to a size you can afford to see fall 30–50%, use the position size calculator, and do not put money in just because a name is on several lists.
Case studies from 13 Nov 2026
All numbers are from the screen pages and stock pages on 13 Nov 2026 (prices of that day, results as filed).
1. Hindustan Zinc: on five screens, but not debt-free
Hindustan Zinc appeared on quarterly growers, profit growth, low P/E, high ROE and Magic Formula. Its quarterly sales rose from ₹10,980 crore (Dec 2025) to ₹15,093 crore (Sep 2026) and profit from ₹3,916 crore to ₹6,412 crore, every quarter higher. Sales were up 77% and profit 142% on a year ago, at a P/E of 11.3, with ROE 95% and ROCE 94%. Yet it is not on the debt-free list: borrowings of ₹6,171 crore make its debt/equity 0.21, even though it held ₹17,258 crore of cash. Lesson: each screen tests one thing. Read the rule before reading the absence of a name as a judgement.
2. SPARC: one quarter, three top spots
Sun Pharma Advanced Research Company was first on the debt-free and high ROE lists (ROE 113.4%) and first on the Magic Formula list. Its last four quarterly profits were −₹80 crore, +₹1,761 crore (Mar 2026), −₹21 crore and −₹24 crore. One quarter produced all the profit, and because three quarters were losses the median is negative, so the one-off check does not trigger. Lesson: when a name tops several lists with extreme ratios, read every quarter on its stock page first.
3. Sterlite Technologies: why the ₹10 crore base exists
Sterlite Technologies was a quarterly grower: profit went from a loss in Dec 2025 to ₹59 crore, ₹197 crore and ₹517 crore in the next three quarters, and mutual funds raised their stake by 2.83 points. Its profit growth on a year ago showed as +12,825%, because the same quarter a year earlier earned only ₹4 crore. It is not on the profit growth list, because that screen needs a year-ago profit of at least ₹10 crore. Lesson: huge growth percentages usually mean a tiny base. Look at the rupee amounts.
4. Coal India and Swaraj Engines: near the low, results growing
Coal India was 9.2% above its 52-week low at ₹403.50, with a P/E of 7.5, sales up 46% and profit up 50% on a year ago, and mutual funds had raised their stake by 1.84 points to 11.8%. It appeared on five screens. Swaraj Engines was 6.4% above its low, down 11% in a year, yet its sales had risen in each of the last three quarters (₹473 crore to ₹635 crore) and it was debt-free with an ROE of 49.3%. Lesson: the market may be worried about something the latest results do not show yet. These lists are where to start asking what that is, not proof that the worry is wrong.
Common mistakes
- Buying the top row. The top of a sorted list is often the most unusual company, not the best (case 2).
- Trusting big percentages. +12,825% profit growth came from a ₹4 crore base (case 3).
- Reading a missing name as a red flag. Hindustan Zinc is not “indebted”; it simply has borrowings above 10% of equity (case 1).
- Forgetting the top-150 cap. Five screens had more matches than their table shows on 13 Nov; the mutual fund page lists the 150 biggest stake increases of 276.
- Ignoring the date of the fundamentals. A company that has not yet filed this season’s results is judged on last quarter.
- Mixing screens for banks. Debt-free, high ROE and Magic Formula exclude banks and NBFCs; low P/B includes them.
- Treating the list as advice. ChartMine is not a SEBI-registered adviser; the lists are a starting point for your own research.
Checklist before you act on a screen
- I know the exact rule of the screen I am using.
- I checked the prices date and whether the company has filed its latest results.
- Extreme numbers (huge growth, ROE above 100%, very low P/E) checked quarter by quarter.
- The name passes at least one other relevant screen, or I know why not.
- I read the stock page: pros and cons, eight quarters, balance sheet, shareholding.
- Valuation compared with the sector median.
- Position size and exit rule decided before buying.
Glossary
| Screen | A fixed set of rules applied to every stock to produce a short list. |
| Universe | The stocks a screen looks at: here, actively traded NSE stocks with results on file and market cap of ₹500 crore or more. |
| Market cap | Share price × number of shares, in ₹ crore. |
| Base effect | A large growth percentage caused by a very small or weak comparison period. |
| One-off quarter | A quarter with an unusually large profit, often from a one-time gain. |
| Book value | Shareholders’ equity in the accounts; per share, divided by the number of shares. |
| Enterprise value (EV) | Market cap plus borrowings minus cash: the price of the whole business. |
| Shareholding pattern | The quarterly filing that shows how much promoters, mutual funds, FIIs and the public own. |
| Golden / death cross | The 50-day average crossing above / below the 200-day average. |
| RSI | Relative Strength Index, 0–100; below 30 is called oversold, above 70 overbought. |
Questions
What are stock screens?
A stock screen applies a fixed set of rules, such as P/E under 15 with growing profits, to every stock and gives a short list. ChartMine’s hub has nine ready-made screens built from NSE results, shareholding patterns and prices, rebuilt after every close.
Which stock screens does ChartMine have?
Quarterly growers, profit growth stocks, low P/E stocks, stocks mutual funds are buying, stocks near their 52-week low with growing profits, debt-free companies, high ROE stocks, Magic Formula stocks and low P/B stocks, plus links to golden cross and RSI oversold scanners and a full stock screener.
How often are the stock screens updated?
Prices update after every market close and the lists are rebuilt with each site update. Fundamentals change when companies file new quarterly results or balance sheets, so the lists move most during results season.
Why does a screen show only 150 stocks?
Each table shows the top 150 by its sort order. When more stocks match, as for profit growth (456) and debt-free companies (266) on 13 Nov 2026, the rest are not shown; use the stock screener to see them all.
Why is a well-known company missing from a screen?
Because it fails one exact rule. Hindustan Zinc, for example, was on five screens on 13 Nov 2026 but not on the debt-free list, because its borrowings were 21% of equity even though it held more cash than debt.
Are stocks on these screens good to buy?
Not automatically. A screen is a starting list for research, not a recommendation, and ChartMine is not a SEBI-registered adviser. Check each company’s results, valuation and risks, and decide your position size before investing.
Can I make my own stock screen?
Yes. The stock screener lets you filter every NSE stock by P/E, growth, holdings, returns and relative strength, and is linked from the hub and from every screen page.