
☰ All tutorials
Start here
Tool tutorialsHow to trade with ChartMineStocks
Stock monitorMy watchlistStock scores & checklistMarket & sectors
Nifty 50Bank NiftySensexFin NiftyDaily market reportMarket breadthSector rotationSector heatmapStock screenerRelative strength (RS)MCX commodity pricesFear & Greed IndexWhat happens after…Scanners
Top gainers & losersStocks to watch tomorrowNR7 stocks scannerInside bar stocks52-week high stocksGap up & gap down stocksRSI oversold stocksGolden cross stocksSuperTrend buy stocksScan builderEMA 9/21 crossoverMACD crossoverADX strong trendBollinger breakout / squeezeVolume spike stocksOpen = high / open = lowCandlestick pattern scannerNarrow CPR scannerF&O data
F&O ban listOI build-upOption chainPCR & max painExpiry calendarF&O lot sizesOI build-up heatmapPCR trendMax pain trendFutures basisStock screens
Quarterly growersProfit growth stocksLow P/E stocksMutual fund buyingNear 52-week low, growingDebt-free companiesHigh ROE & ROCEMagic Formula stocksLow price-to-bookSmart money
FII / DII dataShareholding changesBig-money footprintShort selling dataF&O positions by participantBulk & block dealsPromoter buyingDelivery percentageCalendars
Results calendarQuarterly results trackerBoard meetingsCorporate actionsIPO calendarIPO performanceResearch & planning
Strategy testerCompare stocksDividend yield stocksASM / GSM listExpiry-day movesSeasonality & stock historyNSE holidays 2026Position size calculatorOption payoff calculatorPivot point calculatorMore
Stock scanners hubStock screensHow to use the high ROE & ROCE screen
A plain-language tutorial on return on equity and return on capital employed: how they are calculated, why the screen asks for both, how debt, demergers and commodity cycles distort them, a tour of the page and real examples from November 2026.
What ROE and ROCE mean, in plain words
Imagine two shops. Each made ₹10 lakh of profit last year. The first needed ₹50 lakh of its owners’ money to do it; the second needed ₹1 crore. Both made the same profit, but the first is clearly the better business: it earns 20% a year on the owners’ money, the second only 10%.
That is what return ratios measure. They do not ask “how big is the profit?” but “how much profit for every rupee put in?” Two ratios matter most:
- ROE (return on equity): profit for shareholders ÷ shareholders’ equity. It answers: how hard is the owners’ money working?
- ROCE (return on capital employed): operating profit ÷ (equity + borrowings). It answers: how hard is all the money in the business working, whether it came from owners or lenders?
The High ROE & ROCE screen lists NSE companies (excluding banks and NBFCs) whose ROE and ROCE are both 20% or more over the last four quarters. Asking for both at once is the key idea, explained below.
One line to remember: high returns on capital are the fingerprint of a strong business (a brand, a niche, scale or low costs). They say nothing about whether the share price is reasonable.
How ChartMine calculates them (with real examples)
| Ratio | Formula used by the screen |
|---|---|
| ROE | Profit belonging to shareholders over the last four quarters ÷ average shareholders’ equity (latest balance sheet and the one about 12 months earlier; latest only if the older one is missing) |
| ROCE | (Profit before tax + finance costs) over the last four quarters ÷ average capital employed, where capital employed = equity + borrowings |
| Borrowings | Long-term plus short-term borrowings. Lease liabilities are not reported separately in NSE’s filings, so they are not included. |
Results and balance sheets come from the filings each company makes with NSE, consolidated where the company reports consolidated results. Both ratios use the same basis; ChartMine never mixes consolidated profit with a standalone balance sheet. Values outside a plausible range are dropped rather than shown.
Example 1: Hindustan Zinc (balance sheet at 30 Sep 2026)
- Profit of the last four quarters (Oct 2025 to Sep 2026): ₹20,830 crore.
- Equity: ₹29,966 crore now, ₹13,697 crore a year earlier. Average: ₹21,832 crore.
- ROE = 20,830 ÷ 21,832 = 95.4%.
- Operating profit (profit before tax ₹27,867 crore + finance costs ₹602 crore) = ₹28,469 crore.
- Capital employed: ₹36,137 crore now (equity + ₹6,171 crore borrowings) and ₹24,398 crore a year earlier. Average: ₹30,268 crore.
- ROCE = 28,469 ÷ 30,268 = 94.1%.
Notice that equity more than doubled in a year as profits were kept in the business. If profit stays the same, next year’s ROE will be lower simply because the base is bigger. A very high ROE often comes down over time for exactly this reason.
Example 2: TCS (no borrowings)
TCS’s ROE was 45.8% and its ROCE 62.4%. Why is ROCE higher? Because ROCE uses profit before tax and ROE uses profit after tax. For a company with no debt, ROE is roughly ROCE × (1 − tax rate): 62.4% × about 0.75 ≈ 47%, close to the actual 45.8%.
Why ask for both? Four combinations
ROE can be pushed up by borrowing: if a company borrows at 9% and earns 15% on the money, the extra profit goes to shareholders, and ROE rises. That is fine until business slows and the interest still has to be paid. ROCE counts borrowed money as capital too, so it cannot be inflated by borrowing. Reading the two together tells you a lot:
| ROE | ROCE | Usually means |
|---|---|---|
| High | High | A genuinely profitable business. This screen’s target. |
| High | Low | Returns boosted by debt (or a shrinking equity base). Riskier than it looks. |
| Low | High | Good operations, but lots of idle cash or heavy tax/interest. Check what the company does with its cash. |
| Low | Low | The business earns little on its capital, at least right now. |
Rules of the screen
- ROE 20% or more and ROCE 20% or more, both over the last four quarters.
- Regular companies only: banks, NBFCs and other finance companies are left out; for them, borrowing is the business and ROCE does not apply.
- Lease-heavy companies removed: when finance costs are more than 20% of reported borrowings and more than 10% of operating profit, leases are probably hidden from the borrowings figure, which would make ROCE look far too high. Their ROCE is dropped, so they cannot qualify.
- No one-off quarters: if one quarter’s profit is more than three times the median of the last four, the stock is left out.
- Market cap of at least ₹500 crore, and enough trading history and turnover. Sorted by ROE, highest first; up to 150 shown.
- There is no debt rule. A company with high ROE and ROCE can still carry debt; look at it on the stock page.
Advantages and limits (with a short test)
✅ Points to strong businesses
Earning 20%+ on capital is hard. Competitors usually rush in and push returns down; companies that keep high returns often have something others cannot copy.
✅ Growth without new money
A company earning 25% on capital can fund fast growth from its own profits, without borrowing or issuing new shares.
✅ Harder to fake together
Debt can lift ROE, but not ROCE. Requiring both removes most leverage-driven cases.
✅ Easy to verify
Every number links back to the stock page’s balance sheet section, with the filing date.
The limits
- Only one year. The screen uses the last four quarters. Quality investors look for high returns over five to ten years; check the history before trusting one year.
- Cyclical peaks look like quality. Refiners, metal and commodity companies can show huge returns at the top of their cycle (see the case studies).
- Small equity inflates ROE. Big dividends, buybacks, accumulated losses or a demerger shrink equity and push ROE up.
- Price is ignored. The market knows these are good businesses; many trade at high P/Es.
What happened in a five-month test
We rebuilt the list on 1 Jun 2026 with data filed before that day and checked prices on 6 Nov 2026 (price change only, dividends not included):
| Group | Stocks | Median change | Average | Share that rose |
|---|---|---|---|---|
| High ROE & ROCE list | 146 | −3.8% | −1.4% | 43% |
| All eligible stocks | 1,238 | −2.6% | +1.5% | 45% |
In plain words: over those five months the high-ROE list did slightly worse than the market. Quality is a long-term idea, and five months is far too short to judge it, but this is a useful reminder that a list of good businesses is not a list of rising share prices. ChartMine’s balance-sheet history starts in 2025, so a longer test was not possible.
A tour of the screen
Open the High ROE & ROCE page.

- 1The rule: ROE and ROCE both 20%+ over the last four quarters, banks and NBFCs excluded.
- 2How many companies match.
- 3Date of the prices used.
- 4Fundamentals from each company’s latest filings.
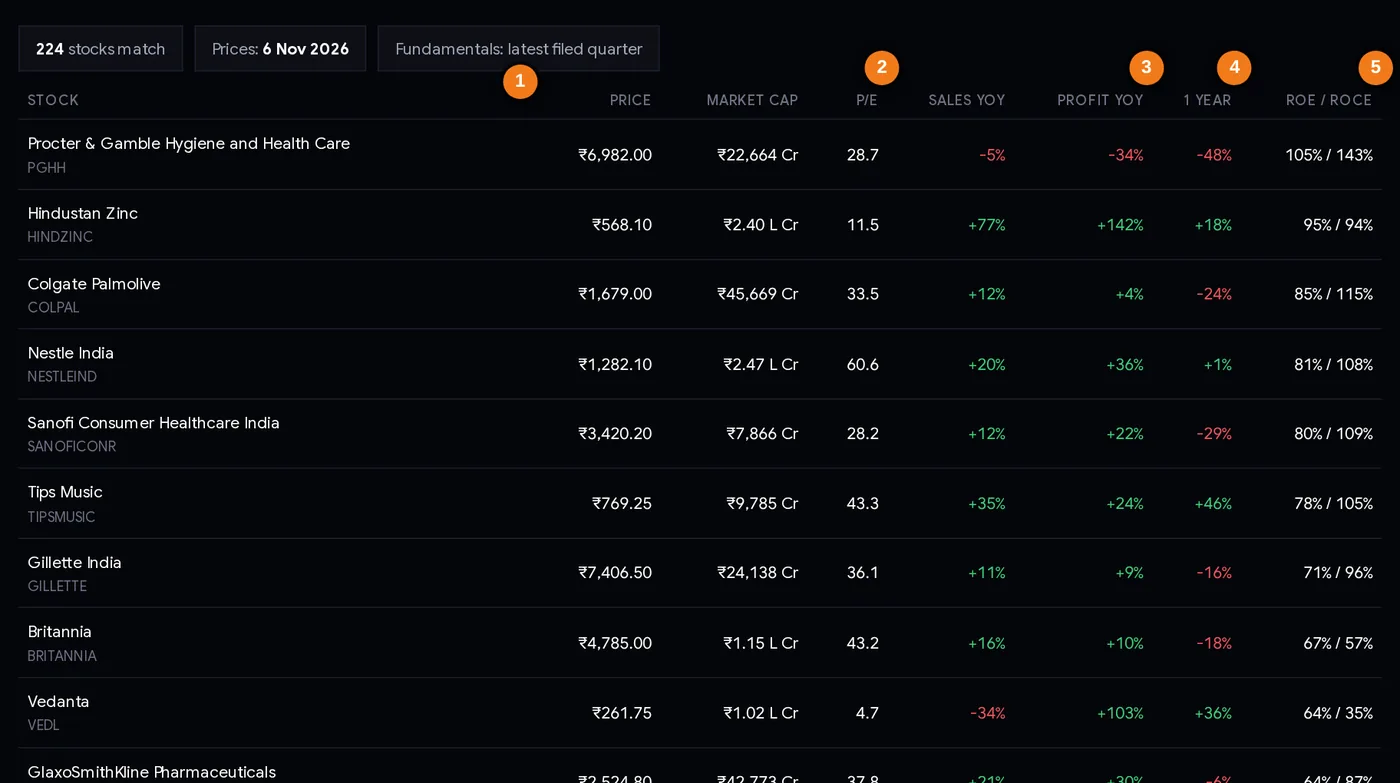
- 1Company and symbol (click for the stock page)
- 2P/E, last four quarters
- 3Profit growth on a year ago: watch for cyclical jumps
- 4Share price change over one year
- 5ROE / ROCE, last four quarters
Every column explained
| Column | What it tells you |
|---|---|
| Stock | Company and NSE symbol; click for the stock page. |
| Price / Market cap | Last close, and the market value in ₹ crore (“L Cr” = lakh crore). |
| P/E | Price ÷ earnings per share of the last four quarters. High-ROE companies often have high P/Es. |
| Sales YoY / Profit YoY | Latest quarter against the same quarter a year earlier. Very large jumps can mean a cyclical upswing. |
| 1 year | Share price change over the last year. |
| ROE / ROCE | Both ratios, last four quarters, rounded. Sorted by ROE. |
The stock page shows how each number was built:
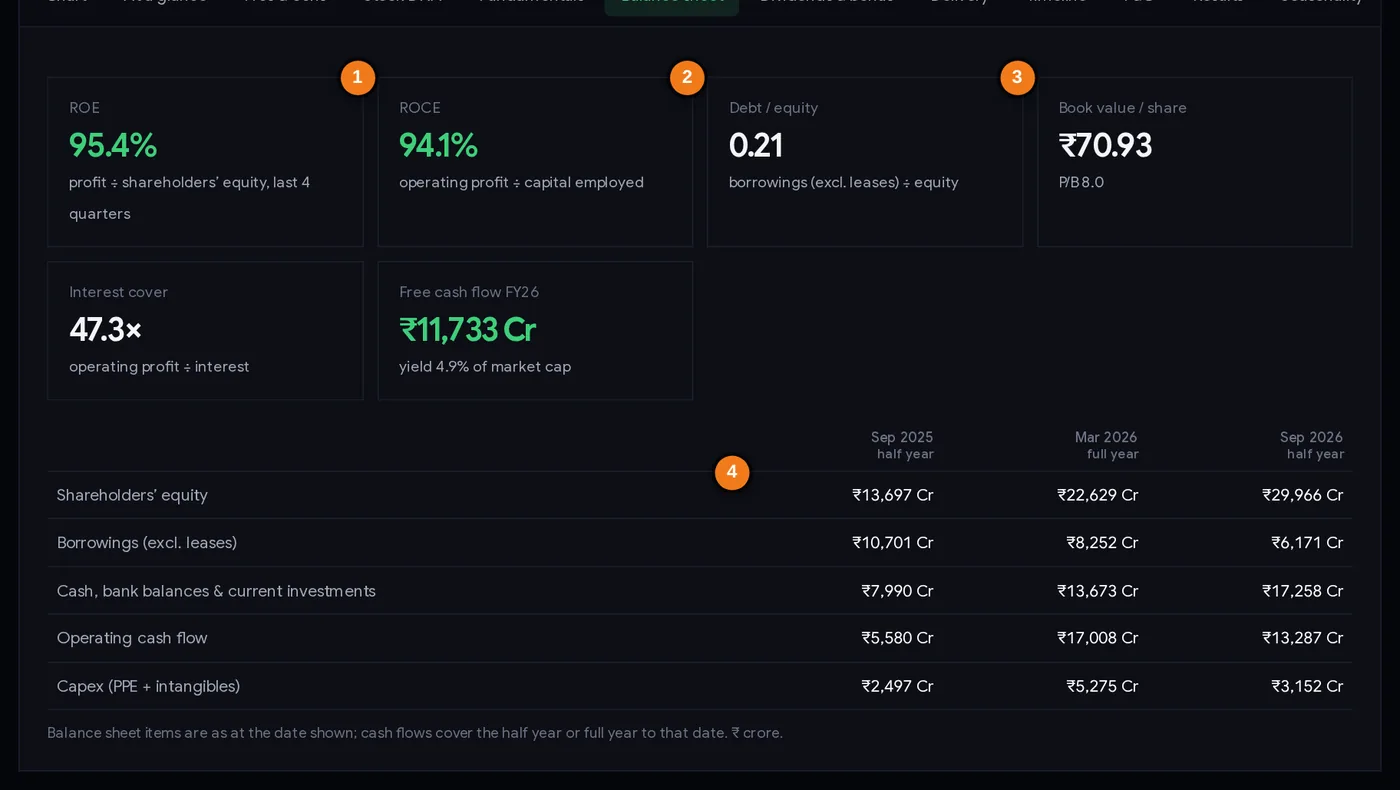
- 1ROE, last four quarters
- 2ROCE
- 3Debt / equity (borrowings excluding leases)
- 4Shareholders’ equity at each date: it more than doubled in a year
Step by step: from list to shortlist
- Open the list and note the count and the price date.
- Look at ROE and ROCE together. When ROE is far above ROCE, debt or a small equity base is doing some of the work. Check debt / equity on the stock page.
- Check the Profit YoY column. Profit up 100%+ often means a cyclical or one-off boost; steady 10–25% is more typical of durable quality.
- Open the stock page and look at equity across the three balance sheet dates. A sudden drop (a demerger, a big special dividend, losses) inflates ROE.
- Look at the quarterly results history on the stock page. Has profit been stable over 8 quarters?
- Check free cash flow and interest cover. Good businesses turn profit into cash and pay interest easily.
- Compare the P/E with the sector median shown on the stock page.
- Write down why you think the returns will last, and what would change your mind.
Three ways investors use this list
Playbook A: quality at a reasonable price
Many long-term investors want the overlap of “good business” and “not too expensive”. Start from this list, then keep only names whose P/E is near or below their sector median and whose sales are growing. The Magic Formula screen does a version of this automatically by ranking return on capital together with earnings yield.
Playbook B: the safest quality
Combine with the debt-free screen: a company that earns 20%+ on capital without borrowing has the most room to survive a bad year. Names like TCS, Colgate-Palmolive and Nestle India were on both lists on 6 Nov 2026.
Playbook C: the cycle check
Use the list to spot cyclical peaks rather than to buy them. When refiners, metal or commodity companies crowd into a high-ROE list with profits up 100%+ and P/Es under 5, history suggests margins are unusually good. Some investors treat that as a reason for caution rather than excitement.
Risk management still applies. A strong business can still see its share price fall 30–50% when growth slows or the valuation resets. Buy in parts, keep each stock to a size you can afford to see fall, and decide your exit rules (for example, returns falling below 15% for two years, or a change in the business) before buying.
Case studies from the 6 Nov 2026 data
1. Hindustan Zinc: quality, cycle, or both?
ROE 95%, ROCE 94%, sales up 77% and profit up 142% on a year earlier (Jul–Sep 2026 quarter), P/E 11.5. Those are extraordinary numbers. Part of it is a strong business; part is metal prices, which move in cycles; and part is a small equity base a year earlier (₹13,697 crore). Equity has since more than doubled, so ROE will fall even if profit holds. Lesson: very high returns deserve the question “how much of this is the cycle?”
2. Vedanta: a shrinking denominator
Vedanta appeared on the list with ROE 64% and ROCE 35%, P/E 4.7. But its equity fell from ₹49,652 crore (31 Mar 2026) to ₹12,761 crore (30 Sep 2026), after a demerger with an ex-date of 30 Apr 2026, and its debt / equity was 2.37. ROE is calculated on average equity, and two of the four quarters of profit are from before the demerger. Lesson: after a demerger, merger or large payout, return ratios mix “before” and “after” and can mislead for a year. The gap between ROE (64%) and ROCE (35%) was the clue.
3. Chennai Petroleum: refining at a peak
ROE 50%, ROCE 58%, P/E 3.7, profit up 218% on a year earlier. A P/E under 4 alongside 50%+ returns is the market saying it does not expect these profits to last: refining margins swing widely. The share price was up 51% over the year, so the market had already noticed the improvement. Lesson: a high-ROE list mixes durable quality with cyclical peaks; the P/E and the profit jump help you tell them apart.
4. Nestle India: quality the market already prices in
ROE 81%, ROCE 108%, sales up 20% and profit up 36%, borrowings under 10% of equity: by most measures an excellent business. Its P/E was 60.6, meaning investors paid about ₹60 for each ₹1 of yearly profit. The share price was up just 1% over the year. Lesson: when everyone knows a business is great, the price often reflects it already.
Common mistakes
- Reading ROE alone. Without ROCE and debt, you cannot tell good business from borrowed returns.
- Trusting one year. The screen uses the last four quarters; look at longer history before calling it quality.
- Ignoring the cycle. Commodity, metal and refining returns rise and fall with prices.
- Missing corporate events. Demergers, buybacks and special dividends shrink equity and inflate ROE.
- Paying any price. A great company at a P/E of 60 needs years of strong growth just to justify the price.
- Expecting banks on the list. Finance companies are excluded; compare banks by ROE and P/B on the low P/B screen.
Research checklist
- ROE and ROCE both high, and not far apart (or I know why).
- Debt / equity on the stock page is low, or the debt is clearly manageable.
- Equity has not shrunk suddenly (demerger, buyback, losses).
- Profit growth is steady, not a 100%+ cyclical jump.
- Returns have been high for more than one year.
- Free cash flow positive; interest cover comfortable.
- P/E compared with sector and growth.
- Position size and exit rules written down.
Glossary
| ROE | Return on equity: profit to shareholders ÷ average equity, last four quarters. |
| ROCE | Return on capital employed: (profit before tax + finance costs) ÷ average (equity + borrowings). |
| Equity | Assets minus liabilities; the owners’ share in the accounts (net worth, book value). |
| Capital employed | Equity plus borrowings: all the long-term money in the business. |
| Leverage | Using borrowed money to increase returns (and risk). |
| Cyclical company | A business whose profits rise and fall with an economic or commodity cycle. |
| Demerger | Splitting a business into separate listed companies; the parent’s equity falls. |
| Interest cover | Operating profit ÷ interest. How many times the company can pay its interest bill. |
| Moat | A lasting advantage (brand, cost, network, licence) that protects high returns from competitors. |
Questions
What is a good ROE for Indian stocks?
Many investors look for 15–20% or more, sustained over several years. ChartMine’s screen uses 20% or more for both ROE and ROCE over the last four quarters. For banks, an ROE of 12–18% is usually considered healthy.
What is the difference between ROE and ROCE?
ROE divides profit after tax by shareholders’ equity only. ROCE divides operating profit (before interest and tax) by equity plus borrowings. Debt can raise ROE but not ROCE, so the two together show whether returns come from the business or from borrowing.
Which stocks have the highest ROE in India?
On 6 Nov 2026 data, the top of ChartMine’s high ROE list included Procter & Gamble Hygiene (105%), Hindustan Zinc (95%), Colgate-Palmolive (85%) and Nestle India (81%). Very high figures often reflect small equity bases or cyclical profits, so check the stock page.
How is ROCE calculated on ChartMine?
Profit before tax plus finance costs over the last four quarters, divided by average capital employed (shareholders’ equity plus borrowings, from the latest balance sheet and the one a year earlier). Lease liabilities are not included because NSE filings do not report them separately; lease-heavy companies are excluded.
Is a high ROE stock always a good investment?
No. High ROE can come from debt, a shrinking equity base or a cyclical peak, and good businesses are often expensive. In ChartMine’s five-month test (Jun to Nov 2026) the high ROE list did slightly worse than the market.
Why are banks not on the high ROE list?
Banks and NBFCs borrow as their business, so ROCE and debt measures do not apply to them in the same way. They are excluded from this screen; the low price-to-book screen includes them.