
☰ All tutorials
Start here
Tool tutorialsHow to trade with ChartMineStocks
Stock monitorMy watchlistStock scores & checklistMarket & sectors
Nifty 50Bank NiftySensexFin NiftyDaily market reportMarket breadthSector rotationSector heatmapStock screenerRelative strength (RS)MCX commodity pricesFear & Greed IndexWhat happens after…Scanners
Top gainers & losersStocks to watch tomorrowNR7 stocks scannerInside bar stocks52-week high stocksGap up & gap down stocksRSI oversold stocksGolden cross stocksSuperTrend buy stocksScan builderEMA 9/21 crossoverMACD crossoverADX strong trendBollinger breakout / squeezeVolume spike stocksOpen = high / open = lowCandlestick pattern scannerNarrow CPR scannerF&O data
F&O ban listOI build-upOption chainPCR & max painExpiry calendarF&O lot sizesOI build-up heatmapPCR trendMax pain trendFutures basisStock screens
Quarterly growersProfit growth stocksLow P/E stocksMutual fund buyingNear 52-week low, growingDebt-free companiesHigh ROE & ROCEMagic Formula stocksLow price-to-bookSmart money
FII / DII dataShareholding changesBig-money footprintShort selling dataF&O positions by participantBulk & block dealsPromoter buyingDelivery percentageCalendars
Results calendarQuarterly results trackerBoard meetingsCorporate actionsIPO calendarIPO performanceResearch & planning
Strategy testerCompare stocksDividend yield stocksASM / GSM listExpiry-day movesSeasonality & stock historyNSE holidays 2026Position size calculatorOption payoff calculatorPivot point calculatorMore
Stock scanners hubStock screensHow to use the Fear & Greed Index
A plain-language tutorial on ChartMine’s Fear & Greed Index for India: what market mood means, the inputs behind each tab, how to read every part of the page, how traders use it as context, and real case studies from 2026.
What the Fear & Greed Index is, in plain words
Markets swing between two moods. When people are fearful, they sell, buy protection and move money into safe assets like gold. When they are greedy, they chase rising prices and ignore risk. Most of the time the mood is somewhere in between.
A fear and greed index turns that mood into one number from 0 to 100. Near 0, investors are acting scared. Near 100, they are acting greedy. The number is built from what people actually do with their money (prices, volatility, option positions, futures positions), not from surveys or news headlines.
ChartMine’s Fear & Greed Index does this for India, every trading evening, from end-of-day NSE and MCX data. It has three tabs:
- Nifty 50: the mood of the whole market, built around NIFTY 50.
- Bank Nifty: the mood around banks.
- Midcap & smallcap: the mood around smaller companies (stocks outside the NIFTY 100).
One line to remember: the index tells you how today’s market feels compared with its own past year. It does not tell you what the market will do next.
It is end-of-day, not live. The line under the page title says when the page was last updated and which trading session the numbers belong to.
What goes into the number: the inputs and the three tabs
Each tab averages several inputs (also called components). Each input is a reading that tends to rise when traders are confident and fall when they are nervous, or the other way round. Here are the seven inputs of the Nifty 50 tab, with the readings for 11 Nov 2026:
| Input | What it measures | Greedy when… | 11 Nov 2026 |
|---|---|---|---|
| FII index-futures positioning | Of all index futures held by foreign investors (FIIs), the % that are long (bets on a rise) | the long share is high for the past year | 31.0% long, score 100 |
| India VIX | NSE’s volatility index: how big a NIFTY move option prices expect over 30 days | VIX is low (calm) | 17.56, score 19 |
| NIFTY momentum | Gap between NIFTY’s 30-day and 90-day exponential moving averages | the fast average is well above the slow one | −0.01%, score 61 |
| Market breadth | % of the most traded NSE stocks closing above their own 50-day average | most stocks are above trend | 46.6%, score 57 |
| 52-week highs vs lows | % of stocks at a new 1-year high minus % at a new 1-year low | many new highs, few new lows | +2.6 pts, score 68 |
| Safe-haven demand | NIFTY’s 20-session return minus MCX gold’s | stocks are beating gold | +16.41 pts, score 100 |
| NIFTY put-call ratio (PCR) | Open puts divided by open calls, all NIFTY expiries | PCR is high (see the note below) | 0.98, score 51 |
A note on PCR. In the US, a high PCR usually means people are buying puts for protection, a fearful sign. In India most index option open interest comes from option writers (sellers), and on ChartMine’s data the PCR has tended to rise on up days. So here a higher PCR counts as greed. This is a judgment call, which is why every input is shown separately; see the PCR trend tutorial for more.
How the other two tabs differ
| Tab | Inputs | Why |
|---|---|---|
| Bank Nifty | FII positioning and India VIX (shared with the market tab), Bank Nifty momentum, breadth and 52-week highs vs lows among 40 listed banks, Bank Nifty vs gold, Bank Nifty PCR | Banks react first to interest rates and loan worries, so their mood can differ from the market’s. |
| Midcap & smallcap | India VIX, momentum of an equal-weight series of 643 smaller stocks, their breadth and 52-week highs vs lows, how they did against NIFTY 50 over 20 sessions, and their share of total turnover | Smaller stocks swing harder. Money crowding into them is a classic sign of greed; FII index futures say little about them, so they are left out. |
How the score is built and what the zones mean
You never need to calculate it yourself, but knowing the method stops you reading too much into one number.
- Rank each input against its own past year. Today’s reading is compared with the last 250 trading sessions of the same series and turned into a percentile: higher than every other day = 100, lower than every other day = 0. This is what lets a VIX of 17 and a breadth of 47% be compared on the same 0–100 scale.
- Point every score the same way. Higher always means greedier. India VIX is flipped, because a low VIX means calm: on 11 Nov 2026 VIX was higher than 81% of the past year, so it scored 100 − 81 = 19.
- Average them with equal weights. A day needs at least 4 inputs. On 11 Nov 2026 the Nifty 50 tab was (100 + 19 + 61 + 57 + 68 + 100 + 51) ÷ 7 = 65.1.
| Zone | Score | What it usually looks like |
|---|---|---|
| Extreme fear | 0–25 | Most inputs near the gloomy end of their year at once: falling prices, high VIX, few stocks above trend, gold beating stocks. |
| Fear | 25–45 | More worried than usual. |
| Neutral | 45–55 | Mixed or middling signals. |
| Greed | 55–75 | More confident than usual. |
| Extreme greed | 75–100 | Most inputs near the happy end of their year at once. |
“Extreme” is relative to the past year, not to all of history. After a long calm year, a modest jump in VIX can already score as fear. And a score of 100 on one input just means “the highest of the past 250 sessions”, not that anything in particular must follow.
From 25 Mar 2025 to 11 Nov 2026 the Nifty 50 tab spent 28 days in extreme fear, 127 in fear, 107 in neutral, 141 in greed and only 1 in extreme greed. Greed readings are common; extreme greed has been rare on this tab.
Why traders watch it: advantages and limits
✅ Context in one glance
When every headline sounds alarming, the index shows whether the market’s actual behaviour is fearful, or just the news.
✅ Every input shown
You see which inputs drive the number and can disagree with any of them.
✅ Three markets, not one
Banks and small caps often have a different mood from NIFTY 50.
✅ History you can check
Each tab has a daily history (CSV download) and a table of what followed past zones.
The limits (please read this part)
- It describes, it does not predict. Markets can stay greedy for months in an uptrend, and fear can deepen for weeks in a sell-off (case 1).
- Short history. The Nifty 50 and Bank Nifty tabs start on 25 Mar 2025 and the Midcap tab on 28 May 2025: about 1.5 years. Some inputs start even later (India VIX from 21 Nov 2025, gold from 4 Mar 2026).
- Overlapping days. Fear comes in spells. 28 extreme-fear days on the Nifty 50 tab come from only 14 separate spells, so they are not 28 independent cases.
- End of day. It does not move during the session.
- Judgment calls. Equal weights, a 250-session window and the PCR direction are choices. Different choices give a different number.
What followed past zones (as on 11 Nov 2026)
The page’s own study groups past days by zone and shows how the index moved over the next 5, 20 and 60 sessions. For the 20-session column:
| Tab and zone | Average next 20 sessions | Higher | All scored days |
|---|---|---|---|
| Nifty 50, extreme fear (14 spells) | +1.21% | 69% of 26 days | +0.08%, higher 59% |
| Nifty 50, greed | −0.67% | 48% of 135 days | +0.08%, higher 59% |
| Bank Nifty, extreme fear (18 spells) | +3.12% | 79% of 42 days | +0.44%, higher 58% |
| Midcap & smallcap, extreme fear (5 spells) | +6.88% | 90% of 30 days | +0.55%, higher 54% |
The pattern so far: periods after extreme fear have done better than average, and greed has not. But read the small print. The Nifty 50 extreme-fear row lost money over the next 5 sessions (−0.45% average) and over the next 60 (−1.11%). The midcap row is really 5 episodes, and its equal-weight series has survivorship bias (today’s stock list, so past losers are missing). This is a description of 1.5 years, not a rule.
A tour of the page
Open the Fear & Greed Index. The top of the page shows the headline readings.
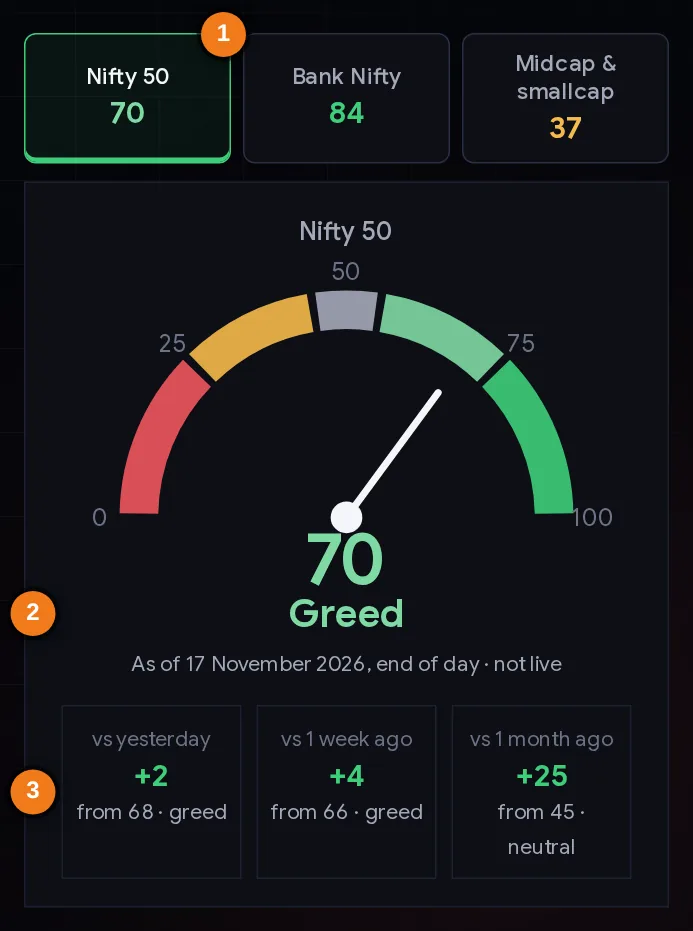
- 1Tabs with each tab’s score; click to switch
- 2Gauge and zone for the selected tab
- 3Change against yesterday, 1 week and 1 month ago
The gauge
- Tabs with each tab’s score in its zone colour. Click one to switch the whole page; the address bar changes to #bank-nifty or #midcap, so you can share a link to a tab.
- Gauge and zone name, with the date of the data (“end of day · not live”).
- Change boxes: today’s score against yesterday, 1 week ago and 1 month ago, with the old score and zone. On 11 Nov 2026 the Nifty 50 tab was +41 points from a month earlier (24, extreme fear).
Below the gauge, “Show the details for:” repeats the tabs. Everything under it belongs to the tab you pick.
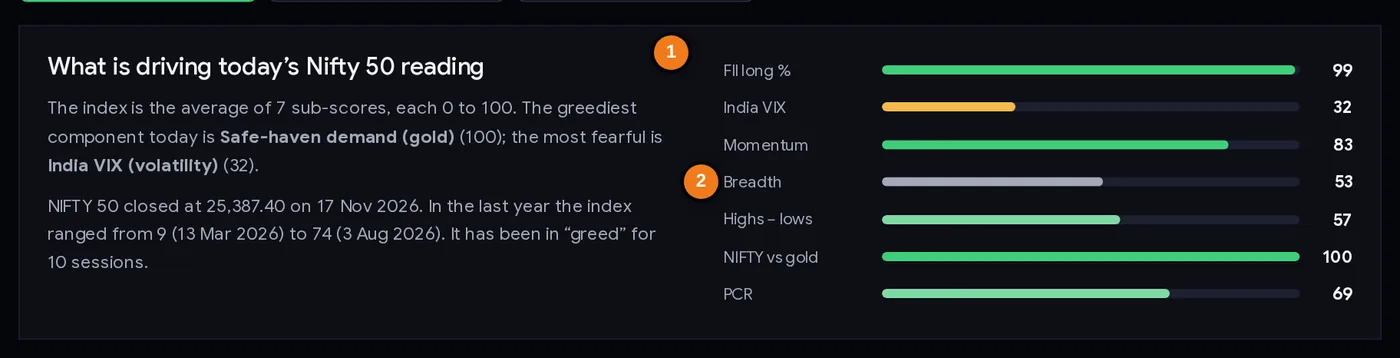
- 1Greediest and most fearful input, index level, year’s range and days in the zone
- 2Each input’s score out of 100, in its zone colour
What is driving today’s reading
A short paragraph names the greediest and the most fearful input, the index level, the past year’s range of the score, and how many sessions it has stayed in the current zone. Next to it, one bar per input shows its 0–100 score. This is the fastest way to see why the number is what it is: on 11 Nov 2026, two inputs at 100 (FII positioning and NIFTY vs gold) were pulling the score up while VIX (19) pulled it down.
The chart
The index (top) drawn over the price (bottom), every day since the tab’s start, with 3M, 6M, 1Y and All buttons. Use it to see how long past fear and greed spells lasted.
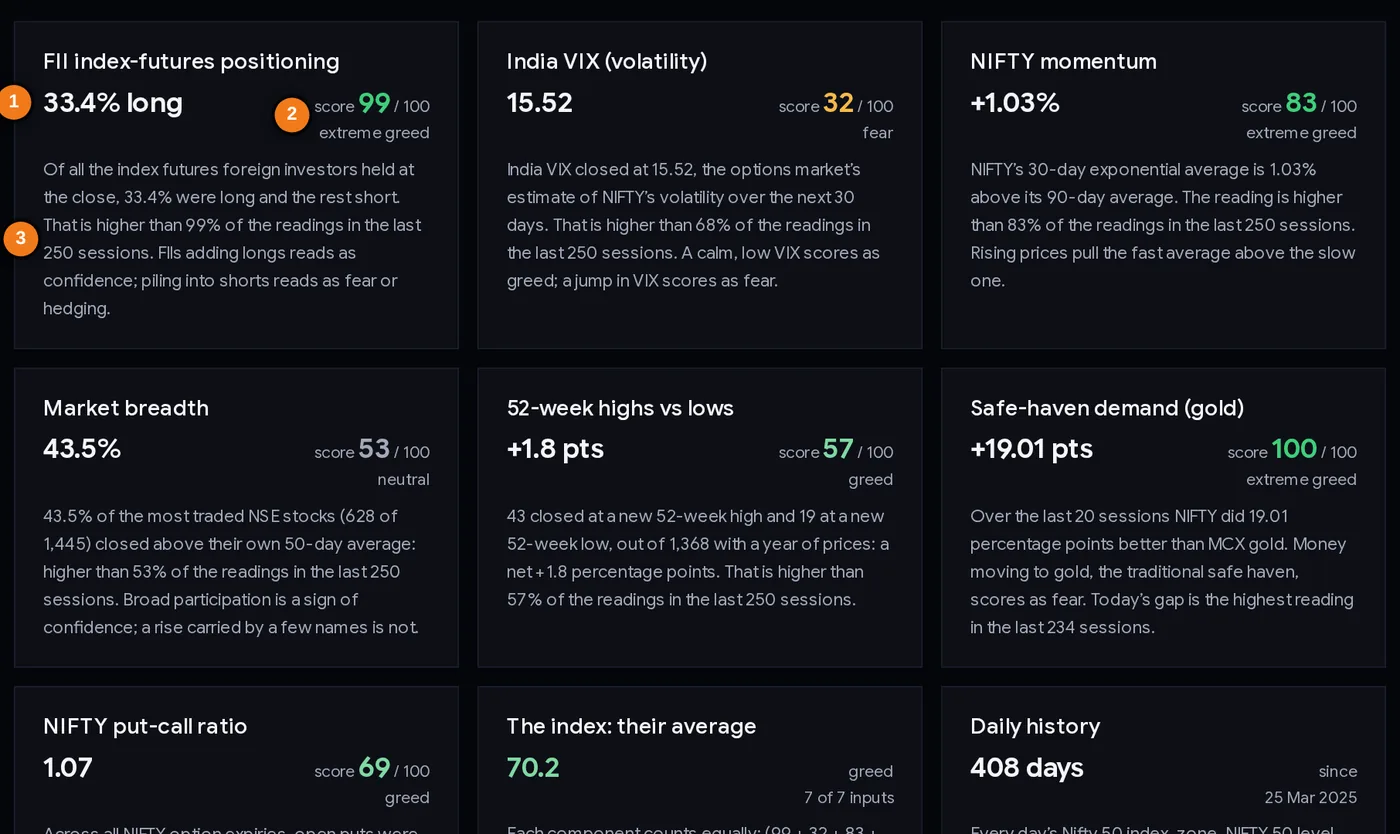
- 1Raw value of the input
- 2Its score out of 100 (percentile against the past year)
- 3What the reading means, in words
The component cards
One card per input: the raw value, the score out of 100 with its zone, and a sentence explaining the reading in words. The last card shows the average worked out, so you can check the arithmetic.
History, study and method
| Part | What it gives you |
|---|---|
| Daily history | The last 30 sessions: date, index, zone, change, index close, the index’s day move and how many inputs were available. “Download the CSV” gives every day with every input’s raw value and score. |
| What followed each zone | Forward returns after each zone over 5, 20 and 60 sessions: average, median, % of times higher and the number of days (n), with the number of separate spells. |
| How the version is built | On the Bank Nifty and Midcap tabs, which inputs change and why, with the start date of each input. |
| Understanding the index | The method and a worked example for the latest day. |
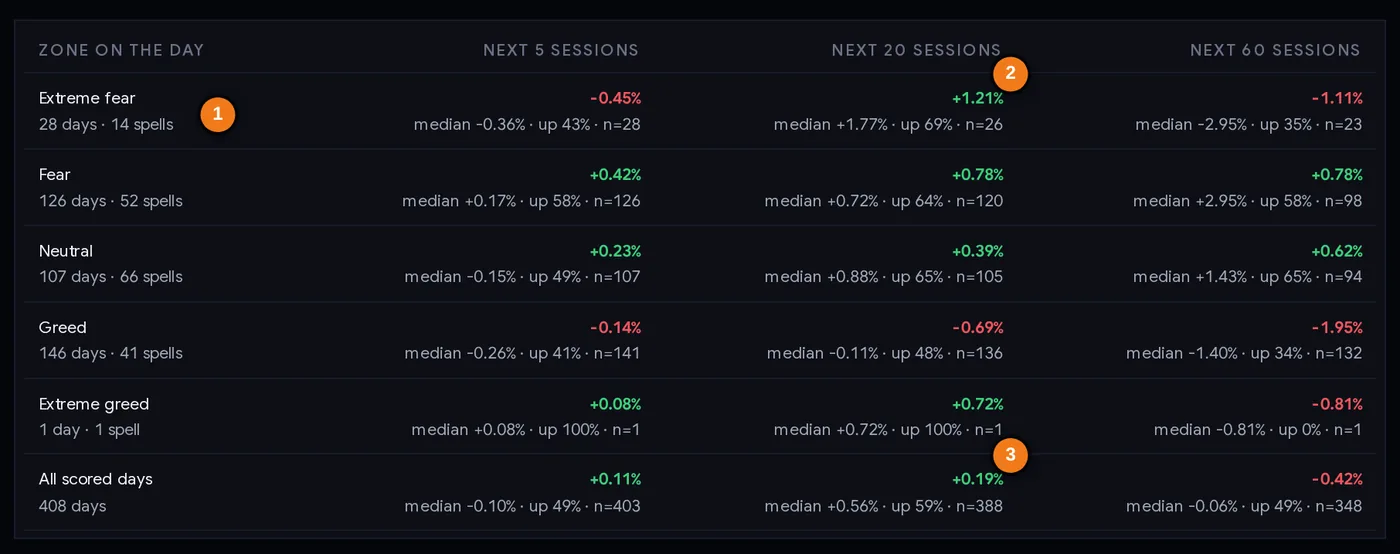
- 1Zone, with the number of days and separate spells
- 2Next 20 sessions: average, median, % higher and n
- 3All scored days, for comparison
Step by step: a 5-minute evening routine
- Read the three tab scores together. Are they in the same zone? A big gap (case 4) tells you the market is split.
- Check the change boxes. A jump of 15–20 points in a day or a week means the mood shifted fast. Find out what moved.
- Open the drivers. Which input is at an extreme? A score pulled up by one or two inputs is weaker than one where most inputs agree.
- Read the raw values on the cards. A score of 19 for VIX means “higher than 81% of the past year”, not that VIX is at a crisis level. Look at the raw number too.
- Look at the chart. How long has the current zone lasted? How did past spells end?
- Cross-check with the tools behind the inputs: market breadth, PCR trend, FII F&O positions, and the evening market report.
- Write one line in your journal: “Mood: greed 65, driven by FII longs and gold; VIX still high.” Over months, this shows you how your own decisions line up with the crowd’s mood.
Three playbooks
Playbook A: the anti-panic check (for investors)
When the market falls hard and the Nifty 50 tab enters extreme fear, use it as a reminder that many investors are already scared, not as a signal that the fall is over. Many investors use such phases to review their long-term list and to add in small, planned steps rather than all at once, with money they will not need soon. In case 1, NIFTY fell another 2.8% in the week after the lowest reading of the year.
Playbook B: the greed brake (for traders)
When the index is in greed and rising, check your risk: are your positions larger than your plan, are stops in place, are you chasing stocks that have already run? Greed is not a sell signal (the market can keep rising), but it is a good moment to stick to position-size rules. Use the position size calculator.
Playbook C: the divergence watch
Compare the tabs. If Nifty 50 and Bank Nifty are in greed while Midcap & smallcap is in fear, the rally is being carried by large companies. Traders who deal in smaller stocks often keep position sizes smaller in such phases and check the midcap tab’s “vs NIFTY 50” and turnover-share cards before adding risk.
Whatever the playbook: the index is context. Every trade still needs its own reason, a stop loss and a position size you can afford to lose.
Case studies from 2026
Real readings from the page’s history. NIFTY and Bank Nifty closing levels.
1. March 2026: the lowest reading, and the fall continued
On 13 Mar 2026 the Nifty 50 tab hit 9, its lowest reading of the past year, with NIFTY at 23,151.10. Bank Nifty’s tab read 6. The fear did not end there: on 23 Mar NIFTY closed at 22,512.65 (−2.8%), with the index still at 26. By 16 Apr, 20 sessions after the low, NIFTY was at 24,196.75 (+4.5% from 13 Mar) and the index read 63 (greed). Lesson: extreme fear can get deeper before it turns. Nobody could have known the 9 was the low on the day.
2. August 2026: the high of the year faded
On 3 Aug 2026 the Nifty 50 tab read 74, its highest reading of the past year (just below extreme greed), with NIFTY at 24,774.30. Twenty sessions later, on 31 Aug, NIFTY was at 24,080.40 (−2.8%) and the index at 45; sixty sessions later, on 29 Oct, at 22,936.75 (−7.4%). Lesson: a high reading told you the mood was confident; it did not tell you when that would change. Traders who kept stops and sensible sizes were protected either way.
3. October to November 2026: from fear to greed in a month
The Nifty 50 tab was in fear or extreme fear on every session from 29 Sep to 30 Oct 2026, with lows of 19 on 8 Oct (NIFTY 22,231.80) and 23 on 21 and 23 Oct. Then the mood turned: 47 on 2 Nov, 59 on 4 Nov, 66 on 5 Nov. By 6 Nov NIFTY was at 25,030.35, up 12.6% from 8 Oct, and on 11 Nov the index read 65 against 24 a month earlier. Lesson: fear lasted about five weeks. Someone using fear as a buy signal on day one would have had to sit through more weeks of fear first; the change boxes and the chart help you see such shifts as they happen.
4. 11 November 2026: three tabs, three moods
On 11 Nov 2026 the tabs read 65 (Nifty 50, greed), 74 (Bank Nifty, greed) and 36 (Midcap & smallcap, fear): 38 points between the highest and the lowest. The midcap tab’s “Smaller stocks vs NIFTY 50” card showed the equal-weight series 10.81 points behind NIFTY 50 over 20 sessions (score 1), and smaller stocks took 49.4% of turnover over 10 sessions (score 26). Meanwhile Bank Nifty PCR (1.20, score 96) was near its year’s high and 27 of 40 banks closed above their 50-day average. Lesson: “the market is greedy” was true for large caps and banks, not for smaller stocks. Pick the tab that matches what you trade.
Common mistakes
- Treating extreme fear as a buy signal. In March 2026 the market fell another 2.8% after the year’s lowest reading (case 1).
- Treating greed as a sell signal. The index spent 141 days in greed since March 2025; markets often rise for weeks in that zone.
- Reading only the headline number. Two inputs at 100 can lift the average while others are weak. Open the drivers.
- Using the wrong tab. If you trade small caps, the Nifty 50 tab may not describe your market (case 4).
- Forgetting it is end of day. A big intraday move will show only after the close.
- Trusting a short history too much. About 1.5 years of data, with few independent spells; the study table describes the past, it does not forecast.
- Ignoring the raw values. A score is relative to the past year; the raw number on the card tells you the actual level.
Checklist before you let market mood affect a decision
- I looked at the tab that matches what I trade.
- I know which inputs drive today’s score, and their raw values.
- I checked the change boxes and how long the zone has lasted.
- I read the study table with its spell counts, not just the averages.
- My trade has its own reason, independent of the mood reading.
- Stop loss and position size are decided before I act.
Glossary
| Fear & Greed Index | A 0–100 summary of market mood built from market data. |
| Input / component | One of the readings averaged into the index (FII positioning, VIX, momentum, breadth…). |
| Percentile | Where today’s value stands against the past 250 sessions: 80 = higher than 80% of them. |
| India VIX | NSE’s volatility index, from NIFTY option prices: the expected size of NIFTY’s moves over the next 30 days. |
| Breadth | How many stocks take part in a move, here the % above their 50-day average. |
| EMA | Exponential moving average: an average of past closes that gives more weight to recent days. |
| PCR | Put-call ratio: open interest in puts divided by open interest in calls. |
| FII | Foreign institutional investor (also FPI): overseas funds investing in India. |
| Safe haven | An asset people buy when worried, such as gold. |
| Equal-weight series | An index where every stock counts the same, regardless of size. |
| Spell | A run of consecutive days in the same zone. |
| Survivorship bias | Looking only at today’s survivors, which makes the past look better than it was. |
Questions
What is the Fear and Greed Index for India?
A 0–100 reading of Indian market mood. ChartMine builds it every trading evening from NSE and MCX data such as India VIX, FII index-futures positions, NIFTY momentum, market breadth, 52-week highs and lows, gold and the put-call ratio. Near 0 means fear, near 100 means greed.
Is there a Fear and Greed Index for Nifty?
There is no official one from NSE. ChartMine’s page has a Nifty 50 tab for the whole market, plus separate Bank Nifty and Midcap & smallcap tabs, each with every input shown and a daily history.
How is the Fear and Greed Index calculated?
Each input is ranked against its own last 250 trading sessions to get a 0–100 percentile, flipped where needed so higher always means greedier (India VIX is flipped). The index is the simple average of the inputs available that day, with at least 4 needed.
What do extreme fear and extreme greed mean?
Extreme fear (0–25) means most inputs are near the gloomy end of their past year at the same time; extreme greed (75–100) means most are near the confident end. They describe the mood, not what happens next.
Should I buy when the Fear and Greed Index shows extreme fear?
The index is not a buy or sell signal. On ChartMine’s data, periods after extreme fear did better than average over 20 sessions, but the history is short and fear sometimes deepened first, as in March 2026. Use it as context with your own plan and risk limits.
Is the Fear and Greed Index live?
No. It is built from end-of-day data after each trading session. The page shows the date of the session the numbers belong to.
Why can Bank Nifty and midcap readings differ from Nifty 50?
They use inputs aimed at their own market: bank breadth and Bank Nifty options for banks, and the breadth, relative strength and turnover share of smaller stocks for midcaps. On 11 Nov 2026 they read 74 and 36 while the Nifty 50 tab read 65.