
☰ All tutorials
Start here
Tool tutorialsHow to trade with ChartMineStocks
Stock monitorMy watchlistStock scores & checklistMarket & sectors
Nifty 50Bank NiftySensexFin NiftyDaily market reportMarket breadthSector rotationSector heatmapStock screenerRelative strength (RS)MCX commodity pricesFear & Greed IndexWhat happens after…Scanners
Top gainers & losersStocks to watch tomorrowNR7 stocks scannerInside bar stocks52-week high stocksGap up & gap down stocksRSI oversold stocksGolden cross stocksSuperTrend buy stocksScan builderEMA 9/21 crossoverMACD crossoverADX strong trendBollinger breakout / squeezeVolume spike stocksOpen = high / open = lowCandlestick pattern scannerNarrow CPR scannerF&O data
F&O ban listOI build-upOption chainPCR & max painExpiry calendarF&O lot sizesOI build-up heatmapPCR trendMax pain trendFutures basisStock screens
Quarterly growersProfit growth stocksLow P/E stocksMutual fund buyingNear 52-week low, growingDebt-free companiesHigh ROE & ROCEMagic Formula stocksLow price-to-bookSmart money
FII / DII dataShareholding changesBig-money footprintShort selling dataF&O positions by participantBulk & block dealsPromoter buyingDelivery percentageCalendars
Results calendarQuarterly results trackerBoard meetingsCorporate actionsIPO calendarIPO performanceResearch & planning
Strategy testerCompare stocksDividend yield stocksASM / GSM listExpiry-day movesSeasonality & stock historyNSE holidays 2026Position size calculatorOption payoff calculatorPivot point calculatorMore
Stock scanners hubStock screensHow to use the Gap up and gap down stocks scanner
A plain-language tutorial on price gaps: how the scanner measures them, the four classic gap types, what one year of data says about gap fills and follow-through, a tour of the screen, and three playbooks with real case studies.
What a gap is, in plain words
The stock market closes at 3:30 PM and opens again at 9:15 AM the next trading day. A lot can happen overnight: company results, news, a big move in US markets, a policy announcement. When the price opens at a very different level from where it closed, the chart shows an empty space between the two candles. That empty space is a gap.
- A gap up: today’s open is higher than yesterday’s close.
- A gap down: today’s open is lower than yesterday’s close.
Gaps matter because they show a sudden change in what buyers and sellers are willing to pay, before anyone could trade. Traders watch what happens after the open: does the price keep going in the direction of the gap, or does it come back and fill the gap?
One line to remember: a gap tells you something changed overnight. Whether it was important is decided by what the price does in the hours and days after.
The Gap up stocks scanner lists every F&O stock and main index that opened at least 1% above or below the previous close, every evening, and marks the gaps the price never came back to.
How the scanner measures a gap (with a real example)
| Tab | Rule |
|---|---|
| Gap up | (Today’s open ÷ yesterday’s close − 1) is +1% or more. |
| Gap down | The same, −1% or less. |
| Unfilled gaps | A gap up whose day low stayed above yesterday’s high, or a gap down whose day high stayed below yesterday’s low. The price never went back into yesterday’s range. |
Example: HCL Technologies, 3 Jul 2026
- Previous day (2 Jul): high ₹1,082.90, close ₹1,078.10.
- 3 Jul: open ₹1,127.10, so the gap was (1,127.10 ÷ 1,078.10 − 1) = +4.55%.
- The day’s low was ₹1,115.10, still above the previous high of ₹1,082.90, so the gap was unfilled. It closed at ₹1,139 on 3.5 times its usual volume.
What “filling the gap” means
Traders use two definitions. The strict one: the price trades back to the previous close (₹1,078.10 here). The loose one: it trades back into the previous day’s range (below ₹1,082.90). The scanner’s “Unfilled” tab uses the range; our statistics below use the previous close.
Types of gaps
Chart books describe four classic gaps. The scanner cannot label them for you (that needs the chart and the news), but knowing them helps you read the list.
| Type | Where it appears | What it often means |
|---|---|---|
| Common gap | Inside a sideways range, small, no big news | Noise. Usually filled soon. |
| Breakaway gap | Out of a long range or past a key level, often on news and heavy volume | The start of a new move. Less likely to be filled quickly. |
| Runaway (continuation) gap | In the middle of a strong trend | The trend accelerating. |
| Exhaustion gap | After a long, fast move | A last burst before the move tires. Often filled and reversed. |
Market-wide gaps vs stock gaps
This difference is the most important one on the scanner. On 3 Feb 2026, 209 of the roughly 217 F&O stocks in our study opened 1% or more higher; on 2 Mar 2026, 202 opened 1% or more lower. On days like that the gap is about the whole market (global cues, a policy event), not the company. A stock that gaps 5% when everything gaps 2% is the one with its own story.
Gap and go vs gap fill
- Gap and go: the price keeps moving in the gap’s direction and closes near the day’s extreme.
- Gap fill: the price reverses during the day or the following days and trades back to the previous close.
Why traders watch gaps: advantages and limits
✅ Finds the news
Gaps point you straight to the stocks where something happened overnight.
✅ Clear reference levels
The previous close, the previous high and the gap day’s open give objective levels for entries and stops.
✅ Unfilled tab
Shows where demand or supply was strong enough to keep the price away from yesterday’s range all day.
✅ Context columns
Volume, RSI, 200-DMA and 52-week distance help separate a breakaway gap from an exhaustion gap.
The limits: what our own data says
We rebuilt the scanner’s list for every session from 27 Oct 2025 to 6 Nov 2026 (256 trading days, 217 F&O stocks, same adjusted data and code): 4,386 gaps up and 3,597 gaps down.
| What happened | Gap up (1%+) | Big gap up (3%+) | Gap down (1%+) |
|---|---|---|---|
| Filled the same day (back to previous close) | 37.8% | 12.9% | 35.8% |
| Filled within 5 sessions (incl. the gap day) | 69.4% | 43.2% | 72.0% |
| Closed beyond its open (gap and go) | 50.9% | 44.7% | 49.6% |
| Average move over the next 20 days | +2.52% | +4.48% | +2.12% |
| Same, versus the average F&O stock | +0.40% | +0.56% | +0.12% |
- Most 1% gaps get filled within a week (about 70%). Small gaps are weak reference levels.
- Big gaps are different: only 13% of 3%+ gaps up were filled the same day and fewer than half within five sessions.
- Gap and go was a coin toss on the gap day itself: about half closed beyond the open.
- The raw numbers flatter gaps. Big gaps up were followed by +4.48% on average over 20 days, which looks impressive. But gaps cluster on strong market days, and the whole market recovered after several of them. Against the average F&O stock on the same days, the extra return was only +0.56%, and fewer than half beat the average. The same was true of unfilled gaps (+0.38%).
Lesson: always compare a gap with what the market did. A gap is a reason to look closer, not an edge by itself. The edge, if any, comes from the story behind it (results, orders, guidance), the volume, and your risk control.
A tour of the scanner screen
Open the Gap up stocks scanner. The table is sorted by the size of the gap, largest first.

- 1Scan for: pick a scan date; the latest is first.
- 2Gap up: opened 1%+ higher.
- 3Gap down: opened 1%+ lower.
- 4Unfilled gaps: price never came back into yesterday’s range.
On 6 Nov 2026 there were 12 gaps up, 54 gaps down and 8 unfilled gaps. When one side is several times the other, the market as a whole opened in that direction.
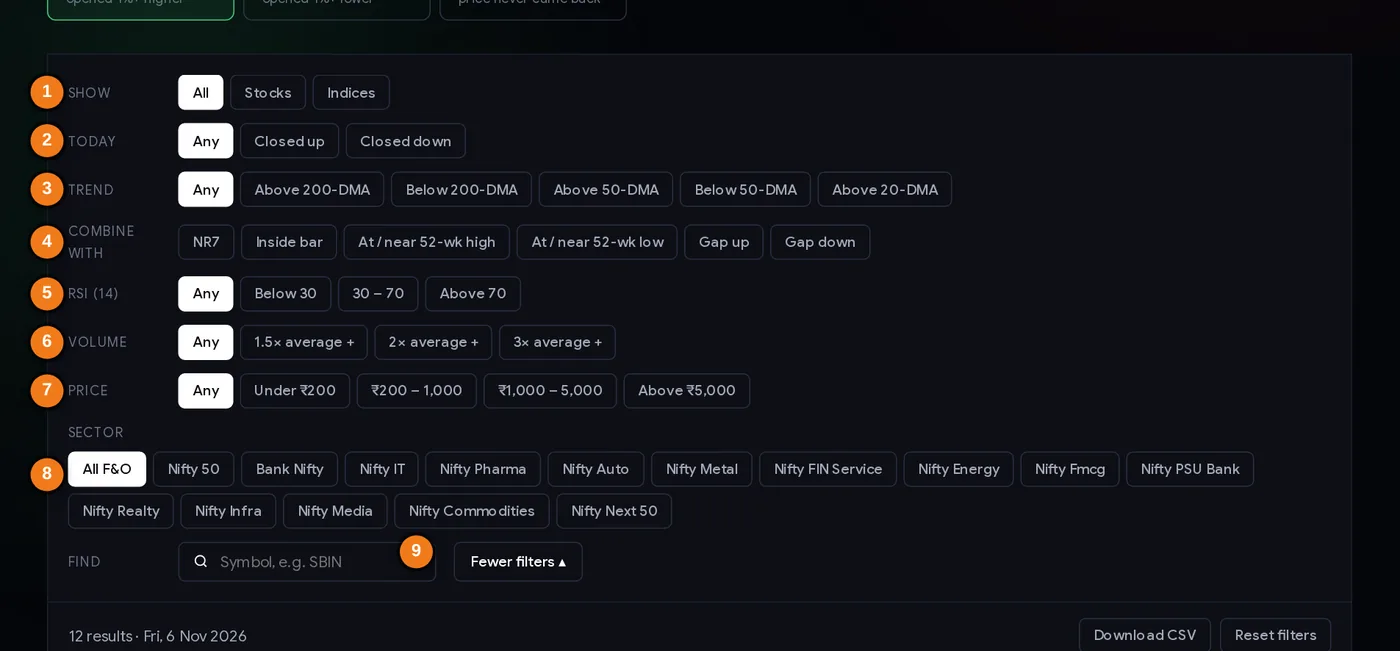
- 1Show: stocks or indices
- 2Today: closed up or down
- 3Trend: versus the 20-, 50- or 200-day average
- 4Combine with another setup
- 5RSI (14)
- 6Volume versus the 20-day average
- 7Price band
- 8Sector (index membership)
- 9Find a symbol
The filters
- Show: stocks, indices or both.
- Today: closed up or closed down. A gap up that closed down is a possible fade; a gap up that closed up held its gain.
- Trend: close versus the 20-, 50- or 200-day average.
- Combine with: 52-week high or low, NR7, inside bar on the same day.
- More filters: RSI, volume (1.5×, 2×, 3× average), price band and sector.
- Find a symbol; filters stay in the page address.
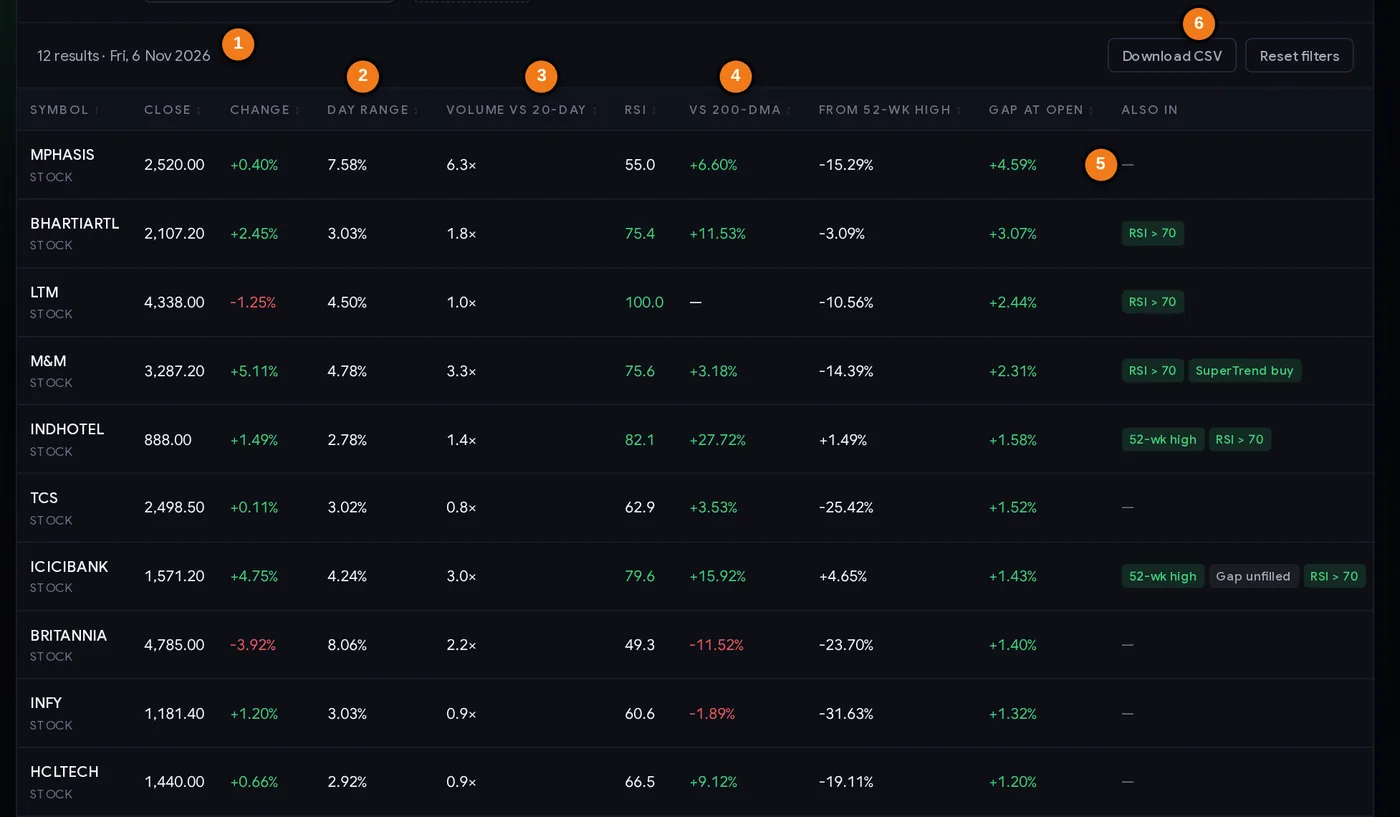
- 1Result count and scan date
- 2Day range %
- 3Volume versus the 20-day average
- 4Distance from the 200-day average
- 5Other scans the stock matched today
- 6Download the list as CSV
Every column explained
| Column | What it tells you |
|---|---|
| Close / Change | The close and the % change from yesterday’s close (gap plus the rest of the day). |
| Day range | (High − Low) ÷ Close. A wide range after a gap means a fight between buyers and sellers. |
| Volume vs 20-day | 2× or more on a gap day suggests real news and real participation. |
| RSI | A gap up with RSI already above 75–80 may be late in a move (possible exhaustion). |
| vs 200-DMA | Gap in the direction of the long-term trend, or against it? |
| From 52-wk high | A gap to a new high is a possible breakaway gap. |
| Gap at open | The gap size: the default sort. |
| Also in | Other scans matched today. “Gap unfilled” means the price never traded back into yesterday’s range. |
Compare Gap at open with Change: a +4% gap that ends +1% gave back most of it during the day; a +4% gap that ends +6% kept going.
Step by step: an evening routine
- Open the scanner in the evening (after about 8 PM IST). Check the date.
- Compare the counts. If dozens of stocks gapped the same way, note it as a market-wide day and focus on the outliers.
- Open the “Unfilled gaps” tab and add Volume 2×+. These are the strongest gaps of the day.
- Find the reason. Results? Check results moves and quarterly results. Block deals? Check bulk and block deals. No news usually means a weaker gap.
- Read Gap vs Change. Did the stock hold the gap into the close?
- Write the levels: gap day high, gap day low, previous close (the fill level).
- Decide the plan for tomorrow: continuation above the gap day high, or a fill toward the previous close, with a stop for each.
Three playbooks
Playbook A: gap and go (continuation)
- Unfilled gap up, volume 2×+, close near the day’s high, a clear reason (results, order win).
- Next day: entry only above the gap day’s high, after the first 15–30 minutes.
- Stop: below the gap day’s low. If the price falls back into the gap, the idea is weakening.
- Exit: trail the stop. Big gaps were filled within a week less than half the time in our data, so the gap day low is a meaningful line.
Playbook B: the gap fill
Small gaps (1–2%) without news, against the market trend, often come back. About 70% of 1% gaps in our data were filled within five sessions. Traders wait for the gap day to close weak (Change much smaller than Gap), then plan a trade toward the previous close with a stop above the gap day’s high. Remember the 30% that do not fill.
Playbook C: wait for the retest
After a strong gap up, instead of chasing, some traders wait for the price to drift back to the top of the gap (the previous day’s high). If it holds there and turns up, that is the entry, with a stop below the gap.
Gaps make stops jump. A stock can open far beyond your stop, and the loss will be bigger than planned. Keep position sizes smaller on gap trades and use the position size calculator.
Case studies from 2026
Four real gaps, prices in ₹ from NSE’s daily files.
1. HCL Technologies, 3 Jul 2026: the gap that held
Gap up 4.55% (open 1,127.10 after a 1,078.10 close), unfilled, volume 3.5× average, close 1,139. Over the next ten sessions the lowest price was 1,121, so the gap was never filled. Twenty sessions after the gap day the stock was 18.3% higher. A breakaway gap in action.
2. Infosys, 15 Sep 2026: the unfilled gap that filled later
Gap up 4.56% (open 1,085 after 1,037.70), unfilled on the day, volume 1.8×, close 1,077. The next day it slipped 1.6%, and within five sessions it traded as low as 1,019.20, below the pre-gap close. The gap was filled within a week and the stock was 4.4% below the gap day close five sessions later. Lesson: “unfilled” describes the gap day only.
3. Bajaj Finance, 31 Jul and 3 Aug 2026: two gaps, two outcomes
On 31 Jul it gapped up 3.94% to 1,095, made a new 52-week high and closed at 1,141.20 on 4.9× volume, unfilled. On 3 Aug it gapped up again, 3.08%, to 1,176.30, but that open was the high of the day; it closed at 1,153 and traded down to 1,140.20, filling the second gap the same day. Twenty sessions after 31 Jul the stock was 5.4% lower. Lesson: a second gap after a big move, which immediately fails, looks like an exhaustion gap.
4. Apollo Hospitals, 2 Jun 2026: the gap down that filled in a day
Gap down 3.61% (open 7,816 after 8,108.50). The price rose all day to 8,120, above the previous close, filling the gap, and closed at 8,089.50. The next day it rose 2.5%, and it did not trade below 8,109.50 for the next five sessions. Gap-down sellers at the open were caught on the wrong side.
Common mistakes
- Chasing at 9:15. The first minutes after a gap are the most volatile. Half of all gaps closed against their open.
- Ignoring the market. On 3 Feb 2026 almost every F&O stock gapped up. That is not 200 setups.
- Assuming every gap fills. Most 1% gaps did, but most 3%+ gaps did not fill within a week.
- Assuming “unfilled” is permanent. Infosys filled its unfilled gap within five sessions.
- Not knowing the reason. A results gap and a no-news gap behave differently.
- Normal position size on gap trades. Stops can be jumped; size down.
- Judging by raw returns. Compare with the market over the same days, as our study does.
Pre-trade checklist
- Scan date is the latest trading day; market-wide gap count noted.
- The gap is larger than the market’s own gap that day.
- Reason known (results, news, deal) or consciously accepted as unknown.
- Gap size, volume and the Gap-vs-Change relationship checked.
- Levels written down: gap day high and low, previous close.
- Plan chosen (continuation or fill) with entry and stop for that plan.
- Position size reduced for gap risk.
- No further event (results, AGM) before your planned exit, or the risk is accepted.
Glossary
| Gap up / gap down | Today’s open above / below yesterday’s close (here by 1% or more). |
| Gap fill | The price trading back to the previous close. |
| Unfilled gap | On the gap day, the price never traded back into yesterday’s range. |
| Breakaway gap | A gap out of a range or past a key level, often the start of a move. |
| Exhaustion gap | A gap late in a fast move that soon reverses. |
| Gap and go | The price continuing in the gap’s direction after the open. |
| Pre-open session | NSE’s 9:00–9:15 AM order matching that sets the opening price. |
| Volume ratio | Today’s volume divided by the 20-day average. |
Questions
What is a gap up in the stock market?
A gap up is when a stock opens above the previous day’s closing price, leaving an empty space on the chart. ChartMine’s scanner lists F&O stocks and indices that opened at least 1% higher (or lower, for gap downs) each day.
Do all gaps get filled?
No. In ChartMine’s study of 4,386 gaps up (Oct 2025 to Nov 2026), 69% were filled within five sessions, but only 43% of gaps of 3% or more were. Big gaps on news fill less often.
What is an unfilled gap?
A gap up whose low for the day stayed above the previous day’s high (or a gap down whose high stayed below the previous low). The price never went back into yesterday’s range that day, a sign of strong demand or supply.
Is a gap up stock a good buy?
Not automatically. About half of gaps closed against their open on the day, and after adjusting for the market, gap-up stocks did only slightly better than average over 20 days. The reason for the gap, the volume and a stop loss matter more.
What causes a gap up or gap down?
Anything that changes value overnight: quarterly results, news, orders, global markets, policy decisions or index events. The opening price is set in NSE’s pre-open session from 9:00 to 9:15 AM.
How do you trade a gap down?
Traders either look for continuation (a break below the gap day’s low, stop above its high) or a fill (a rise back to the previous close when the gap day closes strong). Both need a stop, and gap trades deserve smaller position sizes.