
☰ All tutorials
Start here
Tool tutorialsHow to trade with ChartMineStocks
Stock monitorMy watchlistStock scores & checklistMarket & sectors
Nifty 50Bank NiftySensexFin NiftyDaily market reportMarket breadthSector rotationSector heatmapStock screenerRelative strength (RS)MCX commodity pricesFear & Greed IndexWhat happens after…Scanners
Top gainers & losersStocks to watch tomorrowNR7 stocks scannerInside bar stocks52-week high stocksGap up & gap down stocksRSI oversold stocksGolden cross stocksSuperTrend buy stocksScan builderEMA 9/21 crossoverMACD crossoverADX strong trendBollinger breakout / squeezeVolume spike stocksOpen = high / open = lowCandlestick pattern scannerNarrow CPR scannerF&O data
F&O ban listOI build-upOption chainPCR & max painExpiry calendarF&O lot sizesOI build-up heatmapPCR trendMax pain trendFutures basisStock screens
Quarterly growersProfit growth stocksLow P/E stocksMutual fund buyingNear 52-week low, growingDebt-free companiesHigh ROE & ROCEMagic Formula stocksLow price-to-bookSmart money
FII / DII dataShareholding changesBig-money footprintShort selling dataF&O positions by participantBulk & block dealsPromoter buyingDelivery percentageCalendars
Results calendarQuarterly results trackerBoard meetingsCorporate actionsIPO calendarIPO performanceResearch & planning
Strategy testerCompare stocksDividend yield stocksASM / GSM listExpiry-day movesSeasonality & stock historyNSE holidays 2026Position size calculatorOption payoff calculatorPivot point calculatorMore
Stock scanners hubStock screensHow to read FII and DII data
A plain-language guide to FII and DII cash-market flows: who the institutions are, what net buying and selling means, how to read every part of the page (today’s answer, the monthly tables, the biggest days, the history and the positions), what our 2026 tests found, and real case studies.
What FII and DII data is, in plain words
Every trading day, crores of rupees of shares change hands on NSE and BSE. Most of it is traded by a few big groups of investors. The FII / DII data tells you what two of the biggest groups did today: how much they bought, how much they sold, and the difference, called the net.
- FII (Foreign Institutional Investor), now officially called FPI (Foreign Portfolio Investor): money from outside India. Overseas pension funds, global mutual funds, sovereign funds, hedge funds and foreign banks.
- DII (Domestic Institutional Investor): big Indian institutions. Mainly mutual funds (where your monthly SIP money goes), insurance companies such as LIC, pension funds such as the NPS and EPFO managers, and Indian banks.
The arithmetic is simple: Net = Bought − Sold. If FIIs bought shares worth ₹30,456 crore and sold ₹16,706 crore, their net is +₹13,750 crore: they were net buyers. A minus sign means net sellers. Those are the real numbers for Friday 6 Nov 2026.
One line to remember: net buying means a group put more money into Indian shares than it took out that day. It tells you who was pushing, not where the market goes next.
The FII / DII data page collects these numbers every trading evening. Since 10 November 2026 it opens with a one-paragraph answer for the latest session, then adds totals for the last 5, 10 and 20 sessions, a month-by-month table for the year with NIFTY’s move beside each month, the five biggest buying and selling days, the full daily history, and how the same groups are positioned in index futures and options (from a second NSE file). You see one day in context instead of a single headline number.
Who is who: FIIs, DIIs, pros and clients
NSE splits market participants into four groups. The cash-market flow data covers the first two; the futures and options positions (the bottom half of the page) cover all four.
| Group | Who they are | How they usually behave |
|---|---|---|
| FII / FPI | Foreign funds registered with SEBI to invest in India. | Large and fast. Their buying and selling responds to global events: US interest rates, the dollar, oil, other emerging markets. They often hedge their share holdings by selling index futures. |
| DII | Indian mutual funds, insurers (LIC and private insurers), pension funds, banks. | Steady buyers. Monthly SIP inflows and insurance premiums must be invested, so DIIs often buy when FIIs sell. |
| Pro (proprietary) | Brokers and trading firms trading with their own money, not clients’. | Very active in futures and options, often short-term or arbitrage trades. |
| Client | Everyone else who trades through a broker: retail traders, wealthy individuals (HNIs), companies, trusts. | Often called “retail” on charts, but it also includes big individuals and corporates. |
In 2026 the pattern was striking. In the 214 sessions recorded this year (1 Jan to 13 Nov), FIIs were net sellers of about ₹3,68,926 crore while DIIs were net buyers of about ₹6,53,367 crore. On 168 of those 214 days (79%) the two groups were on opposite sides: one buying, the other selling.
What net buying and selling in the cash market really means
The “cash market” is ordinary share buying and selling, where you take delivery of shares (as opposed to futures and options). Three things trip beginners up.
1. Every share bought was sold by someone
If FIIs were net buyers of ₹13,750 crore, somebody sold them those shares: DIIs, retail investors, promoters, or others. Net buying does not mean “new money entered the market” in total. It means this group was on the buying side more than the selling side.
2. Bought and sold are both huge; the net is small
On 6 Nov 2026 FIIs traded ₹47,161 crore in total (bought plus sold) for a net of ₹13,750 crore. A small net on big volume is noise; a large net, or many days in a row with the same sign, is more meaningful.
3. The data is provisional
The daily figures come from NSE’s evening “FII/DII trading activity” release. They are provisional: the official FPI numbers published later by the depositories (NSDL) can differ, for example because they include primary-market purchases such as IPO allotments. Use the daily number as a fast first read, not an audited total.
| Reading | What it means |
|---|---|
| FII + and DII + | Both institutions buying: broad institutional demand. 42 of 214 sessions in 2026 (about one day in five). |
| FII − and DII + | Foreign money leaving, Indian funds absorbing it. The most common 2026 pattern: 141 of 214 sessions. |
| FII + and DII − | Foreign money arriving, Indian funds taking profits or meeting redemptions. 27 sessions in 2026, including every session from 30 Oct to 13 Nov. |
| FII − and DII − | Both selling: shares are going to retail, promoters or others. Only 4 sessions in 2026. |
| Combined | FII net + DII net. Tells you whether institutions as a whole were buyers or sellers. |
Why traders watch it: advantages and limits
✅ Context for the day
A big fall with heavy FII selling tells a different story from a big fall on light flows. The data helps you understand who moved the market.
✅ Trend of money
Month and year totals show whether foreign money has been coming in or going out for weeks, which shapes sentiment and news.
✅ Totals already added up
The page sums the last 5, 10 and 20 sessions, each month of the year and the year so far, so you do not need a spreadsheet to see a streak.
✅ Positions in one place
The same page shows how FIIs, DIIs, pros and clients are long or short in index futures, so you can compare cash flows with derivative bets.
The limits (please read this part)
We tested the 2026 history on the page (all 214 recorded sessions, 1 Jan to 13 Nov 2026) against NIFTY 50’s daily closes.
| Test | Result |
|---|---|
| Same day: did NIFTY close in the direction of FII net (up on buy days, down on sell days)? | 58% of days (124 of 214). Correlation 0.38: a loose link. |
| Next day after an FII buy day: NIFTY up | 51% (68 days) |
| Next day after an FII sell day: NIFTY up | 48% (145 days) |
| Next day on any day: NIFTY up | 49% (the base rate) |
| Correlation of FII net with the next day’s NIFTY change | 0.01: practically no link |
| Biggest 10% of FII buy days (net ₹2,446 crore or more): next day up | 67% (only 21 days) |
| Biggest 10% of FII sell days (net −₹7,986 crore or worse): next day up | 67% (only 21 days) |
What this means in plain words:
- Today’s FII number does not predict tomorrow. After buy days and sell days, NIFTY rose next day about equally often, close to the 49% base rate.
- Even the same-day link is loose. FIIs sold on 145 of 214 days, yet NIFTY rose on many of them because DIIs and others bought.
- Monthly totals did not decide direction either. FIIs were net sellers in every month from January to October 2026, yet NIFTY rose in four of those months (April +7.5%, June +1.4%, July +2.2%, October +1.9%).
- The extreme days do not help either. NIFTY rose the next day after 67% of the biggest buy days and after 67% of the biggest sell days, so the size of the number did not point the way. Each group has only 21 days, and they cluster: almost half of the big buy days (10 of 21) come from one stretch (27 Oct to 12 Nov), and half the big sell days from March–April. That is far too few to trust.
So how should you use it? As context and a sentiment gauge, not a signal. It explains what happened and shows long-running trends of money. Your entries, exits and stop losses should come from price, levels and your own plan. Two more practical limits: the history on the page starts in January 2026, and it covers every trading session since then except the one-hour Muhurat session of 8 Nov (214 sessions to 13 Nov, including the Sunday 1 Feb Budget session). And the figures are provisional, as explained above.
A tour of the FII / DII page
Open the FII / DII data page. From top to bottom it has: today’s answer and summary cards with a 30-session chart, the “this month” and monthly tables, the biggest days of the year, the history table with filters, and the futures and options positions at the bottom. The pictures show data for Friday 13 Nov 2026.
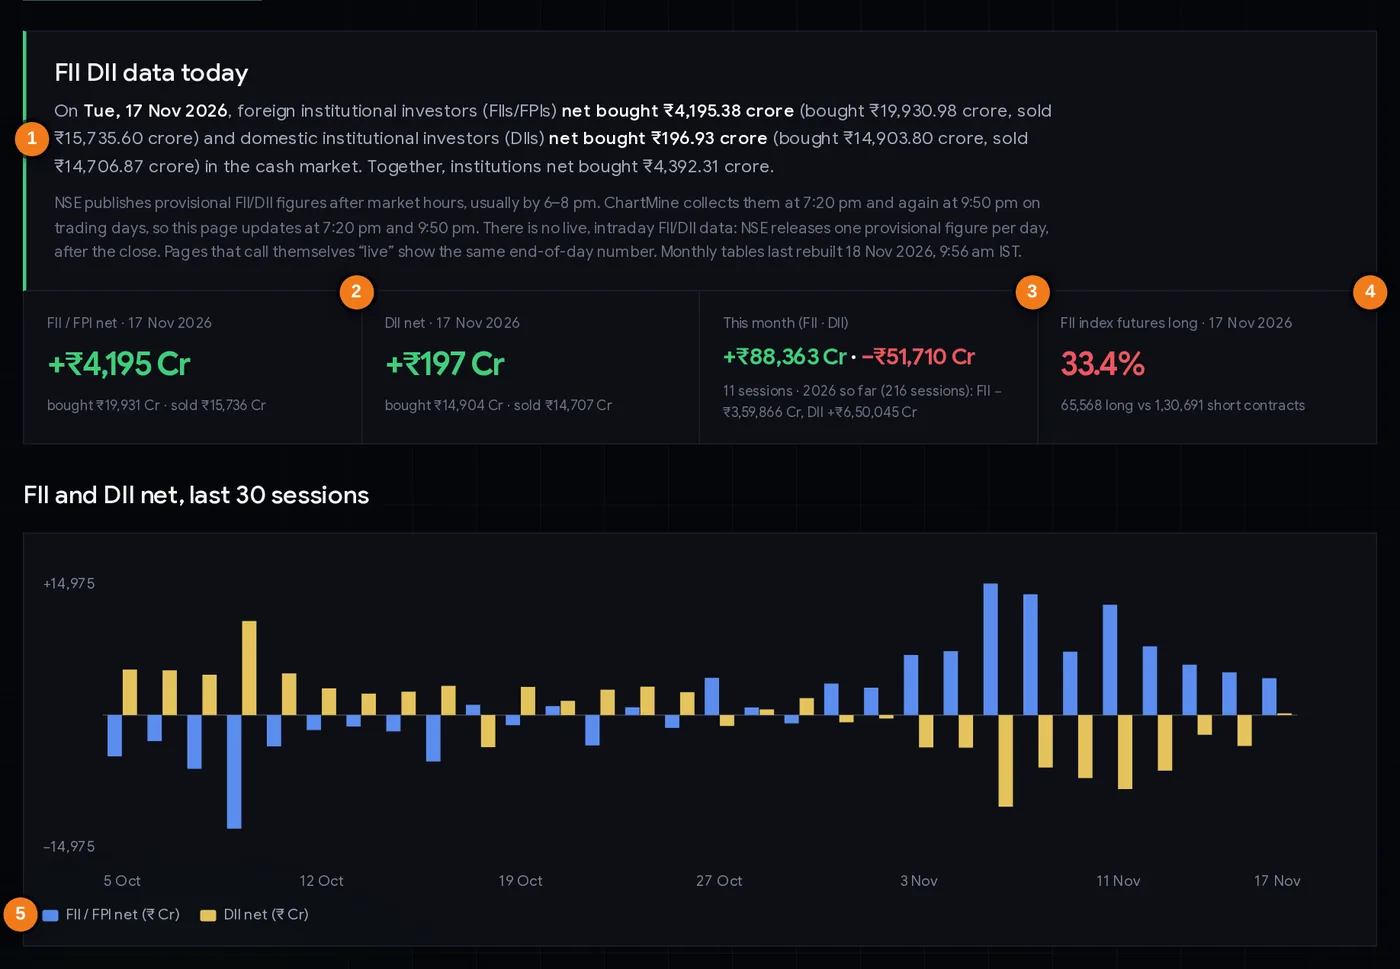
- 1Today’s answer: FII and DII net with gross bought and sold.
- 2FII / FPI net card for the latest session (the DII card is next to it).
- 3This month (FII · DII) and the year-to-date totals below.
- 4FII index futures long % from NSE’s participant-wise open interest.
- 5Bar chart of FII (blue) and DII (yellow) net for the last 30 sessions.
The box at the top answers “what did FIIs and DIIs do today?” in one paragraph, with gross bought and sold: on 13 Nov FIIs net bought ₹5,736.55 crore (bought ₹18,339.57 crore, sold ₹12,603.02 crore), DIIs net sold ₹2,253.58 crore, and together institutions net bought ₹3,482.97 crore. The grey line under it says when the numbers arrive.
The cards repeat the latest session, add “this month” (+₹79,303 crore FII, −₹48,388 crore DII in 9 sessions) with year-to-date totals, and FII index futures long % (34.6%). The bar chart shows the last 30 sessions: blue bars for FIIs, yellow for DIIs, above the line for buying and below for selling. On the right of the picture, blue bars sit above the line and yellow below: the two groups on opposite sides.
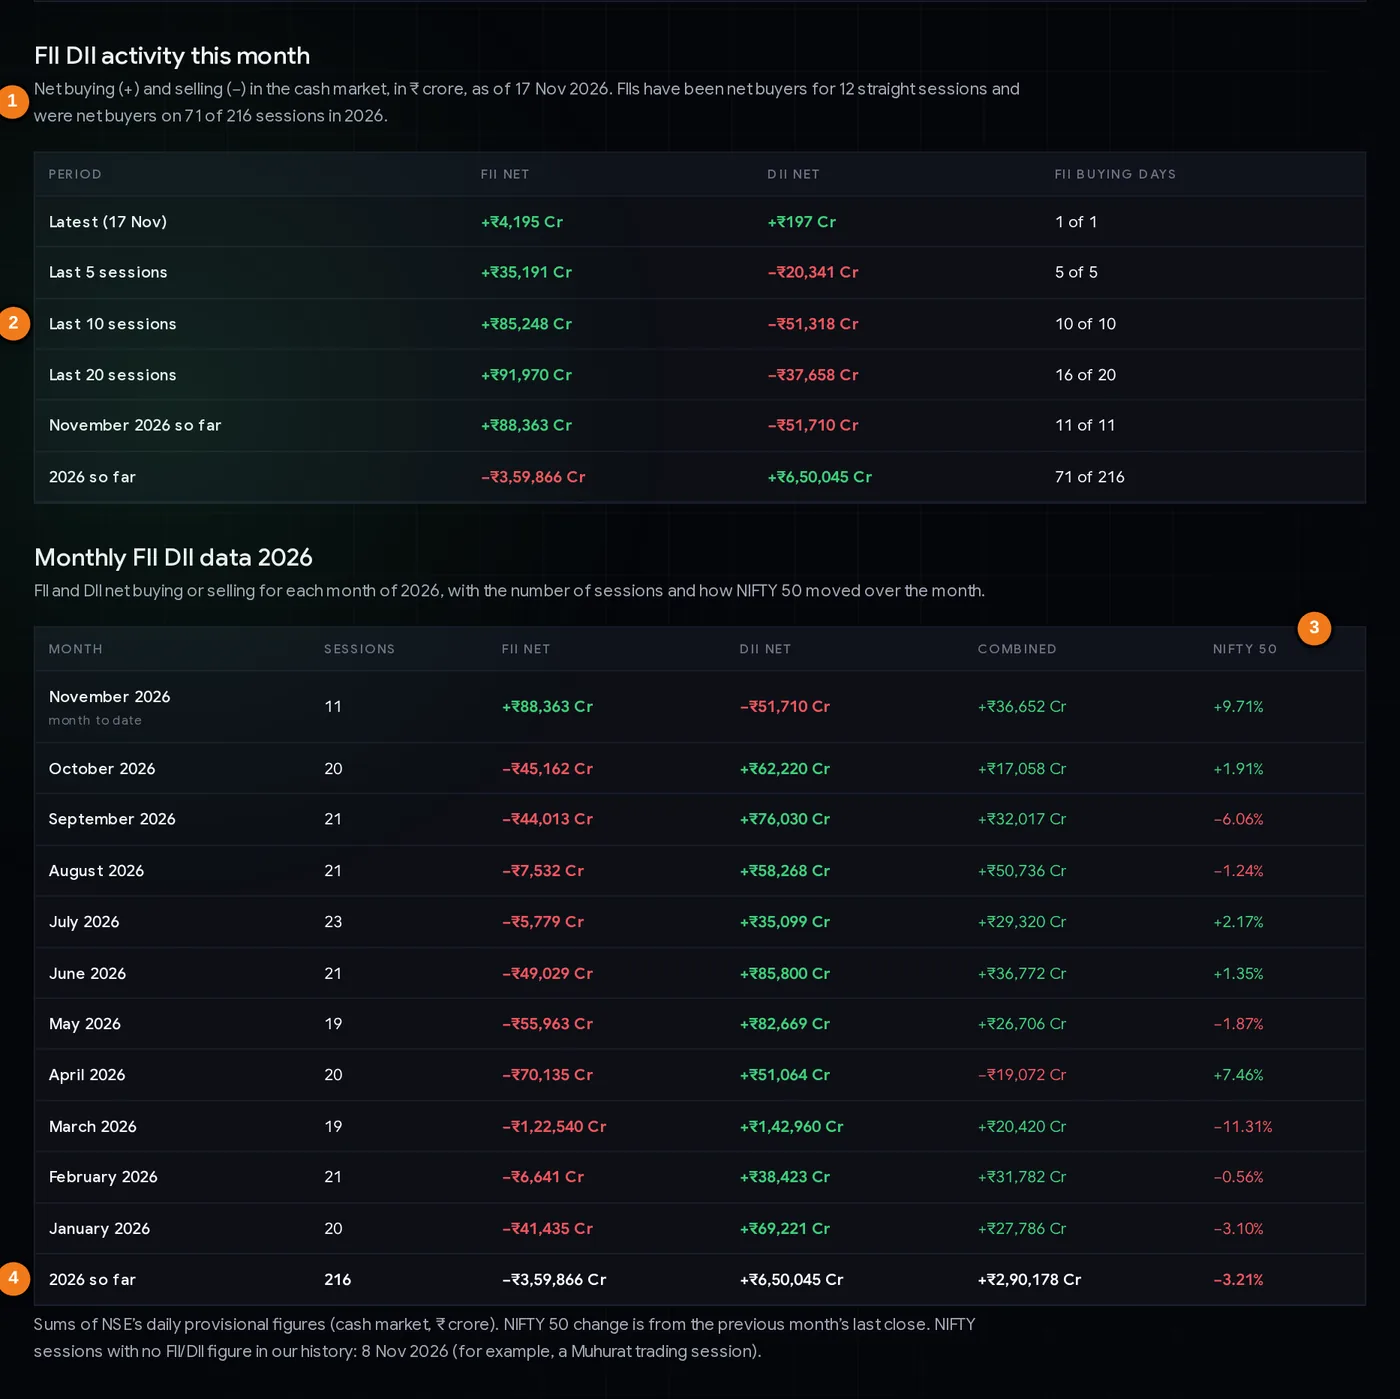
- 1The streak: sessions in a row on the same side.
- 2Rolling totals for the last 5, 10 and 20 sessions.
- 3NIFTY 50’s change over each month.
- 4The year-so-far total row.
The “this month” and monthly tables
| Row or column | What it tells you (13 Nov 2026) |
|---|---|
| Streak sentence | How many sessions in a row FIIs have been on the same side, and their buying days this year: net buyers for 10 straight sessions, and on 69 of 214 sessions in 2026. |
| Latest, last 5, 10, 20 sessions | Rolling totals. Last 10 sessions: FIIs +₹82,901 crore, DIIs −₹49,206 crore, FIIs buying on 10 of 10 days. Last 20: +₹78,791 crore, but buying on only 15 of 20. |
| Monthly table | One row per month of the year: sessions, FII net, DII net, combined, and NIFTY 50’s change over the month (from the previous month’s last close). October 2026: FIIs −₹45,162 crore, DIIs +₹62,220 crore, NIFTY +1.91%. |
| 2026 so far | The total row. The note under the table lists NIFTY sessions with no flow figure, such as the Muhurat session of 8 Nov. |
The monthly table makes a key point for you: FIIs sold in every month from January to October, yet the NIFTY column is green in four of them.
The biggest days of the year
Four lists of the year’s five biggest FII and DII buying and selling days, each with NIFTY’s move that day. On 13 Nov the FII buying list was all November: 5 Nov (+₹14,975 crore, NIFTY +2.40%), 6 Nov (+₹13,750 crore), 11 Nov (+₹12,563 crore), 12 Nov and 4 Nov. The top FII selling day was still 29 May (−₹21,106 crore, NIFTY −1.50%). The top two DII buying days, 29 May and 30 Mar, were also big FII selling days, and NIFTY fell on both.
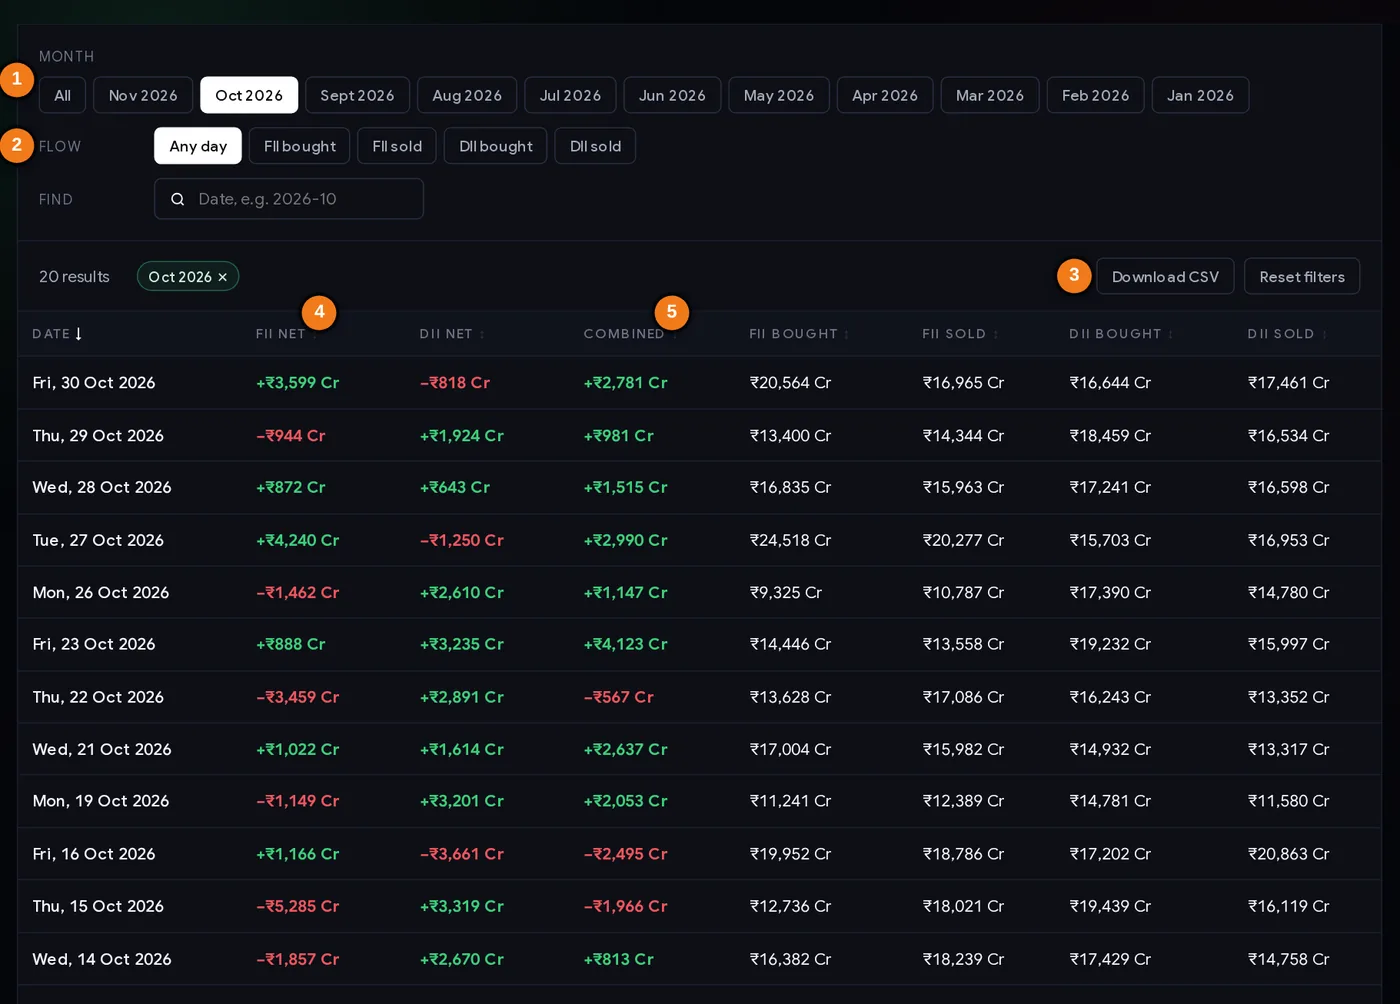
- 1Month: one month or all of them.
- 2Flow: only FII-buy, FII-sell, DII-buy or DII-sell days.
- 3Download CSV of the rows you see.
- 4FII net and DII net per session (₹ crore).
- 5Combined: FII net + DII net.
The filters and the history table
- Month: show one month only (the screenshot shows October 2026), or All.
- Flow: only days when FIIs bought, FIIs sold, DIIs bought or DIIs sold.
- Find: type a date or part of one, such as 2026-10.
- Download CSV: save the filtered rows to a spreadsheet. Reset filters clears everything.
| Column | What it tells you |
|---|---|
| Date | The trading session. Newest first by default; click any header to sort. |
| FII net | FII bought − FII sold, in ₹ crore. Green = net buying, red = net selling. |
| DII net | DII bought − DII sold, in ₹ crore. |
| Combined | FII net + DII net: institutions as a whole. |
| FII bought / sold, DII bought / sold | The gross amounts. Large gross with a small net means a busy but balanced day. These columns hide on phones. |
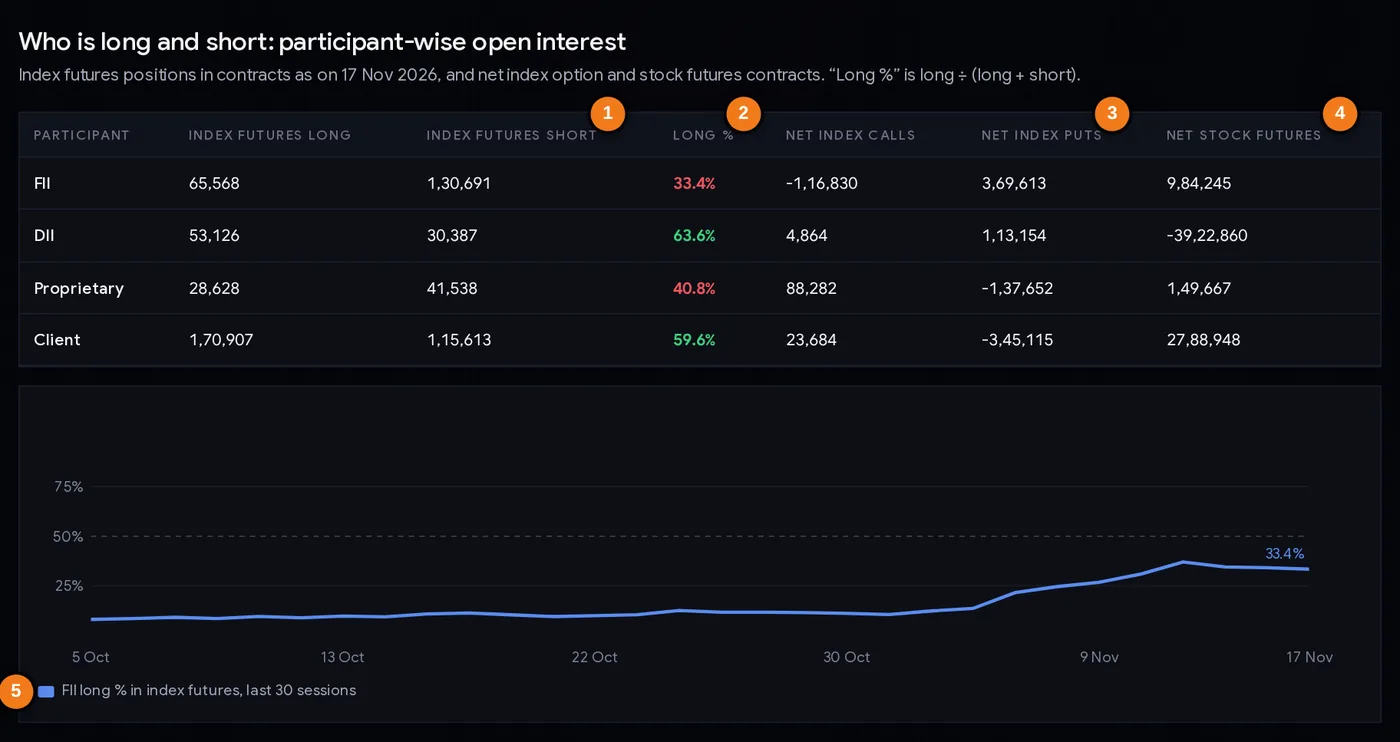
- 1Index futures long and short contracts for each group.
- 2Long %: long ÷ (long + short).
- 3Net index calls and puts (bought − sold).
- 4Net stock futures (DII shorts are mostly arbitrage hedges).
- 5FII long % in index futures, last 30 sessions.
Who is long and short (the bottom table)
This comes from NSE’s participant-wise open interest file. It counts contracts, not rupees, held by each group at the end of the day.
| Column | What it tells you |
|---|---|
| Index futures long / short | Open contracts betting the index goes up (long) or down (short). |
| Long % | Long ÷ (long + short). Below 50% = more shorts than longs. On 13 Nov 2026 FIIs were 34.6% long, up from 24.6% on 6 Nov. |
| Net index calls / puts | Index option contracts bought minus sold. FIIs are almost always net buyers of puts (insurance). |
| Net stock futures | Stock futures long minus short. DIIs show a large negative number because mutual-fund arbitrage schemes buy shares and sell futures at the same time; it is hedged, not a bearish bet. |
The line under the table shows the FII long % for the last 30 sessions; in the picture it climbs from below 25% in October to 34.6%. For the full history since 2024 and charts for all four groups, use F&O positions by participant.
Step by step: a 10-minute evening routine
- After about 7:30 PM, open the page. NSE releases the numbers in the evening and ChartMine collects them at 7:20 PM and again at 9:50 PM on trading days. Check that the date in the answer box and the cards is today.
- Read the two nets and the size. Is today’s FII net large compared with the last 30 bars? A ₹500 crore day is routine; ₹10,000 crore either way is rare (nine times in the 2026 data).
- Check the streak. The sentence above the “this month” table gives it, and the last 5, 10 and 20 session rows show whether it is building or fading. Five or more days on the same side says more than one day.
- Compare with price. Did NIFTY fall on heavy FII selling (agreement) or rise despite it (DIIs absorbing)? Use the market report for the day’s move and market breadth for how many stocks rose.
- Look at the bottom table. Is FII long % in index futures moving? A rising long % with cash buying means FIIs are adding bets in both segments.
- Write one sentence in your journal, for example “FIIs sold for the 8th day; DIIs absorbed all of it; NIFTY flat.”
- Do not change tomorrow’s trading plan because of one evening’s flow number. Your plan comes from price levels, stop losses and position size.
Three ways traders and investors use it
Playbook A: the swing trader’s sentiment filter
Some swing traders only take fresh long trades when both the price trend and the flow trend agree: NIFTY above its 50-day average and FIIs net buyers over the last 10 sessions (the “Last 10 sessions” row gives this directly). When the two disagree they trade smaller or wait. This does not make trades win more often by itself (our tests found no next-day edge); it simply keeps you out during long stretches of foreign selling. Always keep your normal stop loss and use the position size calculator.
Playbook B: the long-term investor’s “who is selling?” check
When the market falls 5–10%, investors ask whether to keep their SIPs going. The flow page shows who sold. In March 2026 FIIs sold about ₹1,22,540 crore while DIIs bought ₹1,42,960 crore: the fall came from foreign selling while Indian funds kept buying. That tells you the reason for the fall, not when it ends. Investors use it to stay calm and stick to their asset allocation, not to time the bottom.
Playbook C: spotting a change in behaviour
The most useful moment is when a long pattern breaks. After FIIs sold in every month from January to October 2026, they bought for ten recorded sessions in a row from 30 Oct to 13 Nov, and all five of the year’s biggest FII buying days came in that stretch. Traders treat such a change as a reason to watch more closely (check FII index futures positions, sector strength in the sector rotation tool and the stocks with rising delivery %) rather than as a buy signal. A change can reverse just as quickly.
Risk first. Flow data is about the whole market. Your trade is in one stock with its own news. Decide your stop loss and how much you can lose before you enter, whatever the FIIs did.
Case studies from the 2026 data
Four real episodes from the page’s own history, with NIFTY 50 closes from NSE. Amounts in ₹ crore.
1. March 2026: flows and price agreed
FIIs were net sellers on all 19 sessions in March, part of a 27-session selling run from 26 Feb to 9 April (about ₹1,73,187 crore). March was the biggest month of FII selling in the data: about ₹1,22,540 crore net sold. DIIs bought about ₹1,42,960 crore, more than FIIs sold. NIFTY still fell from 25,178.65 (27 Feb) to 22,331.40 (30 Mar): −11.3%. Lesson: heavy DII buying did not stop the fall. “DIIs are buying, so the market cannot fall” is a myth; prices also move through futures, options and the many participants not in these two groups.
2. April 2026: heavy selling, rising market
April was the second-biggest month of FII selling, after March: about ₹70,135 crore net sold, on 16 of its 20 sessions, with DIIs buying about ₹51,064 crore. Yet NIFTY rose 7.5%, from 22,331.40 to 23,997.55 (30 Apr). Lesson: the flow number and the market’s direction can disagree for a whole month. Anyone who shorted because “FIIs are selling” lost money.
3. 29 May and 8 October 2026: the two biggest selling days
The largest one-day sale in the 2026 data came on 29 May: net −₹21,106 crore, with DIIs buying a net ₹16,764 crore. NIFTY fell 1.50% to 23,547.75, and five sessions later it was at 23,366.70 (−0.8%). The second largest came on 8 October: net −₹12,944 crore, with DIIs buying a net ₹10,703 crore. NIFTY fell 1.64% to 22,231.80, and five sessions later it was at 22,997.35 (+3.4%). Lesson: two scary headline numbers, two different weeks afterwards. The number told you what happened that day, not what came next.
4. 30 Oct to 13 Nov 2026: foreign money turns
FIIs bought on ten straight recorded sessions, about ₹82,901 crore in total, including +₹14,975 crore on 5 Nov and +₹13,750 crore on 6 Nov, the two biggest FII buying days of the year. DIIs were net sellers on all ten days (about −₹49,206 crore). In the first part, NIFTY rose from 22,936.75 (29 Oct) to 25,030.35 (6 Nov): +9.1%. Note the order: the two biggest FII buying days came after NIFTY had already risen about 4.5%. Then FIIs kept buying, ₹33,343 crore more from 9 to 13 Nov (including +₹12,563 crore on 11 Nov, the third biggest day of the year), yet NIFTY went only from 25,030.35 to 25,144.30, about +0.5%, and on 13 Nov it fell 0.61% on a day FIIs bought ₹5,737 crore. Lesson: big buying after a rally is part of the rally, not a promise of more. Flows followed price as much as they led it.
Common mistakes
- Trading tomorrow on tonight’s number. Our test: after FII buy days NIFTY rose next day 51% of the time, after sell days 48%.
- Reading the net without the gross. ₹1,000 crore net on ₹45,000 crore traded is small; check the bought and sold columns.
- Believing “DII buying = support”. March 2026: DIIs bought more than FIIs sold and NIFTY still fell 11%.
- Looking for “live” FII data during the day. NSE publishes one provisional figure per session, in the evening. A page showing “live FII buying” at noon is showing yesterday’s number or a guess.
- Treating provisional data as final. The official FPI numbers from the depositories arrive later and can differ.
- Calling “Client” retail only. It also includes wealthy individuals and companies.
- Reading DII stock futures shorts as bearish. They are mostly arbitrage hedges by mutual funds.
- Applying market-wide flows to one stock. A stock can rise on a day FIIs sold heavily overall. For a single stock, see bulk and block deals and shareholding changes.
Checklist before you act on flow data
- The card date is today’s session (data arrives in the evening).
- I compared today’s net with the last 30 bars: is it actually large?
- I checked the streak and the last 5, 10 and 20 session totals, not just one day.
- I compared the flow with what NIFTY and breadth actually did.
- I looked at FII index futures long % and whether it is rising or falling.
- I remember the data is provisional and does not predict the next day.
- My entry, stop loss and position size come from my own trading plan.
- For a single stock, I checked stock-specific data (deals, results, news).
Glossary
| FII / FPI | Foreign Institutional / Portfolio Investor: overseas funds investing in Indian markets. |
| DII | Domestic Institutional Investor: Indian mutual funds, insurers, pension funds, banks. |
| Pro | Proprietary traders: brokers and firms trading their own money. |
| Client | All other traders through brokers: retail, HNIs, corporates. |
| Cash market | Buying and selling shares for delivery, as opposed to futures and options. |
| Net | Bought − sold, in ₹ crore. Plus = net buyer, minus = net seller. |
| Gross | The total bought or total sold, before netting. |
| Provisional | Reported quickly by the exchange; final figures can differ. |
| Open interest (OI) | The number of futures or options contracts still open at the end of the day. |
| Long % (long-short ratio) | Long contracts ÷ (long + short). Below 50% = net short. |
| Arbitrage | Buying shares and selling their futures together to earn the small price gap, with little market risk. |
| Crore / lakh | 1 crore = 100 lakh = 10 million. ₹1,000 crore = ₹10 billion. |
Questions
What is FII DII data?
It is the daily amount foreign institutional investors (FIIs, also called FPIs) and domestic institutions (DIIs: mutual funds, insurers, pension funds) bought and sold in Indian cash markets, and the net (bought minus sold). NSE releases provisional figures every trading evening.
What time is FII DII data released?
NSE publishes the provisional figures after market hours, usually by 6–8 PM. ChartMine collects them at 7:20 PM and again at 9:50 PM IST on trading days, and the page updates after each collection.
Does FII selling mean the market will fall?
Not reliably. In ChartMine’s test of 2026 data (214 sessions to 13 Nov), NIFTY rose the next day after 48% of FII selling days and 51% of FII buying days, about the same as the 49% base rate. FIIs sold every month from January to October 2026 and NIFTY still rose in four of those months.
Who are DIIs in the stock market?
Domestic Institutional Investors: Indian mutual funds (including SIP money), insurance companies such as LIC, pension funds such as NPS and EPFO managers, and Indian banks and financial institutions.
What is the difference between FII and FPI?
FPI (Foreign Portfolio Investor) is the current SEBI category name; FII is the older name. In daily market data the two are used for the same group of foreign funds.
Is FII DII data final?
No. The exchange figures are provisional. Official FPI investment data is published later by the depositories (NSDL) and can differ, for example because of primary-market purchases and settlement timing.
Where can I see monthly FII DII data for 2026?
On ChartMine’s FII / DII data page. A table lists every month of 2026 with FII net, DII net, the combined figure and NIFTY 50’s change that month. October 2026, for example: FIIs −₹45,162 crore, DIIs +₹62,220 crore, NIFTY +1.91%.
What does FII long percentage in index futures mean?
It is FIIs’ long index futures contracts divided by their total long and short contracts, from NSE’s participant-wise open interest. On 13 Nov 2026 it was 34.6% (62,546 long, 1,18,466 short), meaning FIIs held about two short contracts for every long one.