
☰ All tutorials
Start here
Tool tutorialsHow to trade with ChartMineStocks
Stock monitorMy watchlistStock scores & checklistMarket & sectors
Nifty 50Bank NiftySensexFin NiftyDaily market reportMarket breadthSector rotationSector heatmapStock screenerRelative strength (RS)MCX commodity pricesFear & Greed IndexWhat happens after…Scanners
Top gainers & losersStocks to watch tomorrowNR7 stocks scannerInside bar stocks52-week high stocksGap up & gap down stocksRSI oversold stocksGolden cross stocksSuperTrend buy stocksScan builderEMA 9/21 crossoverMACD crossoverADX strong trendBollinger breakout / squeezeVolume spike stocksOpen = high / open = lowCandlestick pattern scannerNarrow CPR scannerF&O data
F&O ban listOI build-upOption chainPCR & max painExpiry calendarF&O lot sizesOI build-up heatmapPCR trendMax pain trendFutures basisStock screens
Quarterly growersProfit growth stocksLow P/E stocksMutual fund buyingNear 52-week low, growingDebt-free companiesHigh ROE & ROCEMagic Formula stocksLow price-to-bookSmart money
FII / DII dataShareholding changesBig-money footprintShort selling dataF&O positions by participantBulk & block dealsPromoter buyingDelivery percentageCalendars
Results calendarQuarterly results trackerBoard meetingsCorporate actionsIPO calendarIPO performanceResearch & planning
Strategy testerCompare stocksDividend yield stocksASM / GSM listExpiry-day movesSeasonality & stock historyNSE holidays 2026Position size calculatorOption payoff calculatorPivot point calculatorMore
Stock scanners hubStock screensHow to use the High delivery stocks page
A plain-language guide to delivery percentage: what it measures, who is behind delivered and intraday trades, how ChartMine finds big-buyer days, how to read every part of the page, and what two years of NSE data say about “high delivery means genuine buying”.
What delivery percentage is, in plain words
Every share that trades on NSE ends the day in one of two ways. Either the buyer keeps it and it moves into their demat account on the settlement day (T+1, the next working day), or the same person buys and sells it within the day, so nothing changes hands at settlement. The first kind is a delivered trade; the second is an intraday (squared-off) trade.
Delivery percentage is simply the share of the day’s traded quantity that was delivered:
Delivery % = deliverable quantity ÷ total traded quantity × 100
Example from 6 Nov 2026: 19.86 crore Groww shares traded and NSE reported 53.71% as deliverable, so about 10.66 crore shares actually changed owners. The rest was bought and sold again within the day.
The idea behind watching it: day traders create volume but leave no footprint, because they end the day flat. Investors who buy to hold, or sell to exit, create delivery. So delivery is the part of the volume that tells you about ownership changing hands.
The High delivery stocks page shows the delivery % of every actively traded NSE stock for the latest session, highlights big-buyer days (delivery far above the stock’s normal), finds stocks with a streak of them, and charts the market-wide delivery pulse for two years.
Delivered vs intraday: who is behind each
Delivery and intraday volume come from different kinds of market participants. Knowing who tends to be on each side is what makes the number meaningful.
| Delivered trades | Intraday (squared-off) trades | |
|---|---|---|
| Typical participants | FPIs (foreign funds), DIIs (mutual funds, insurers, pension funds), long-term retail investors, promoters and large holders selling stakes | Retail day traders, proprietary (prop) trading desks, high-frequency and algorithmic traders |
| Why | Institutions are not allowed to day-trade in the cash market, so every share they trade is delivered. Investors buy to hold. | They trade price moves within the day and end flat, often with leverage (intraday margin). |
| What it shows | Shares moving to new owners: accumulation, or a holder exiting | Activity and liquidity, but no change in who owns the company |
A normal day sits in the middle. On 6 Nov 2026 the median delivery % was 46% across the 1,421 stocks on the page. Large, steady companies often run 50–70%; popular trading stocks and those in the news often run 20–35%. That is why the page compares each stock with its own normal rather than with a fixed number.
Why “high delivery with a price rise” is read as genuine buying
If a stock rises 3% and most of the volume is intraday, the move was mostly traders pushing the price around; by the close many of them had already sold. If it rises 3% and an unusually large number of shares is delivered, someone was taking shares home at higher prices. Traders call that “genuine” or “delivery-based” buying, and read it as a sign of conviction. As you will see in the limits section, the data supports a milder version of this idea than many people assume.
The numbers on the page: delivery %, delivery vs normal, big-buyer day
The page uses NSE’s daily bhavcopy with delivery data (traded quantity, deliverable quantity and delivery % for every EQ-series stock). From it, ChartMine works out three things:
| Measure | How it is calculated | What it tells you |
|---|---|---|
| Delivery % | Deliverable quantity ÷ traded quantity, as NSE reports it | What share of today’s volume changed owners. |
| Delivered shares | Traded quantity × delivery % | How many shares changed owners. |
| Delivery vs normal | Today’s delivered shares ÷ the stock’s median delivered shares of the previous 50 sessions | 3.0× means three times the usual number of shares changed owners. |
| Big-buyer day | Delivered shares ≥ 3× normal and delivery % ≥ three-quarters of its own 50-session median and turnover of at least ₹0.5 crore that day | A day when large investors were most likely buying or selling. |
| Streak (accumulation) | 3 or more big-buyer days in the last 10 sessions | Repeated heavy delivery, possibly a slow build-up (or a slow exit). |
Why the second rule matters
On a frantic news day volume can explode ten-fold. Even with a low delivery %, the delivered shares then look huge. The second rule filters out these intraday frenzies. Example: on 6 Nov 2026, 3M India delivered 8.8× its normal number of shares while falling 5.98%, but only 24% of its volume was delivered against a normal of about 47%. The page did not count it as a big-buyer day.
Which stocks are included
Companies on NSE’s equity list (plus every F&O stock) with at least 120 days of history and a median daily turnover of ₹1 crore or more over the last 60 sessions. F&O stocks are always included. Tiny, illiquid stocks are left out because one trade can swing their delivery %.
Why delivery matters: advantages and limits
✅ Separates investors from churn
Volume alone mixes day traders and investors. Delivery isolates the shares that really changed owners.
✅ Each stock against its own normal
“Delivery vs normal” makes a heavy day stand out even in a stock whose delivery % is usually low.
✅ Free, official, daily
It comes from NSE’s own files every evening, for every stock.
✅ Market-wide clue
The pulse chart shows when heavy delivery hits hundreds of stocks at once, which often marks index events and big market days.
The limits: what two years of data say
We tested the idea on about 6 lakh stock-days from Oct 2024 to Oct 2026 (stocks with ₹1 crore+ median turnover, days with a split, bonus or missing data removed). For each day we compared the stock’s next 20 sessions with the median stock on the same day, so a rising or falling market does not flatter the result.
| Day type | Cases | Beat the median stock over 20 sessions |
|---|---|---|
| Any up day of 2% or more | 93,090 | 48% |
| Up 2%+ with delivery of 70% or more | 2,906 | 54% |
| Up 2%+ with delivery below 25% | 12,534 | 43% |
| Big-buyer day on an up day (2%+) | 11,318 | 50% |
| Big-buyer day on a down day (−2% or worse) | 9,319 | 53% |
| Down 2%+ with delivery of 70% or more | 4,149 | 53% |
What this means in plain words:
- The clearest signal is a warning, not a buy signal. Rallies made mostly of intraday trading (delivery below 25%) lagged the market afterwards: only 43% beat the median stock. That held in both years of the test.
- High delivery on a rise helped a little. 54% against 48% for all up days: a mild tilt, not a reliable signal. Nearly half of these stocks still did worse than average.
- A big-buyer day with a rise was a coin toss (50%).
- Heavy delivery on a fall did not mean more falling. Those stocks did slightly better than average (53%). Someone sold, but someone else bought every one of those shares.
Things that inflate delivery without anyone “buying with conviction”
- Block and bulk deals. When a promoter, private-equity fund or other large holder sells a big stake, all those shares are delivered. A “big-buyer day” is just as much a big-seller day.
- Index rebalancing. When MSCI, FTSE or NSE’s own indices change their constituents, index funds buy and sell large blocks at the close, all for delivery. Many of the busiest days in the pulse chart fall on these dates.
- F&O arbitrage. Funds buy shares in the cash market and sell futures to earn the price gap, holding the shares until expiry. Those shares are delivered, but the position has no view on direction. (In our data the market-wide effect is small: median delivery of F&O stocks was 49.6% on expiry days against 48.9% on other days; it matters more for individual stocks.)
So how should you use it? As evidence about who was active, read together with the price, the market and the news. Treat a low-delivery rally with suspicion; treat a high-delivery rally as one supporting point, not a reason on its own. Always check whether a deal or index event explains the day.
A tour of the High delivery stocks page
Open the High delivery stocks page. It has three parts: the summary cards, the big-buyer table and the market delivery pulse.
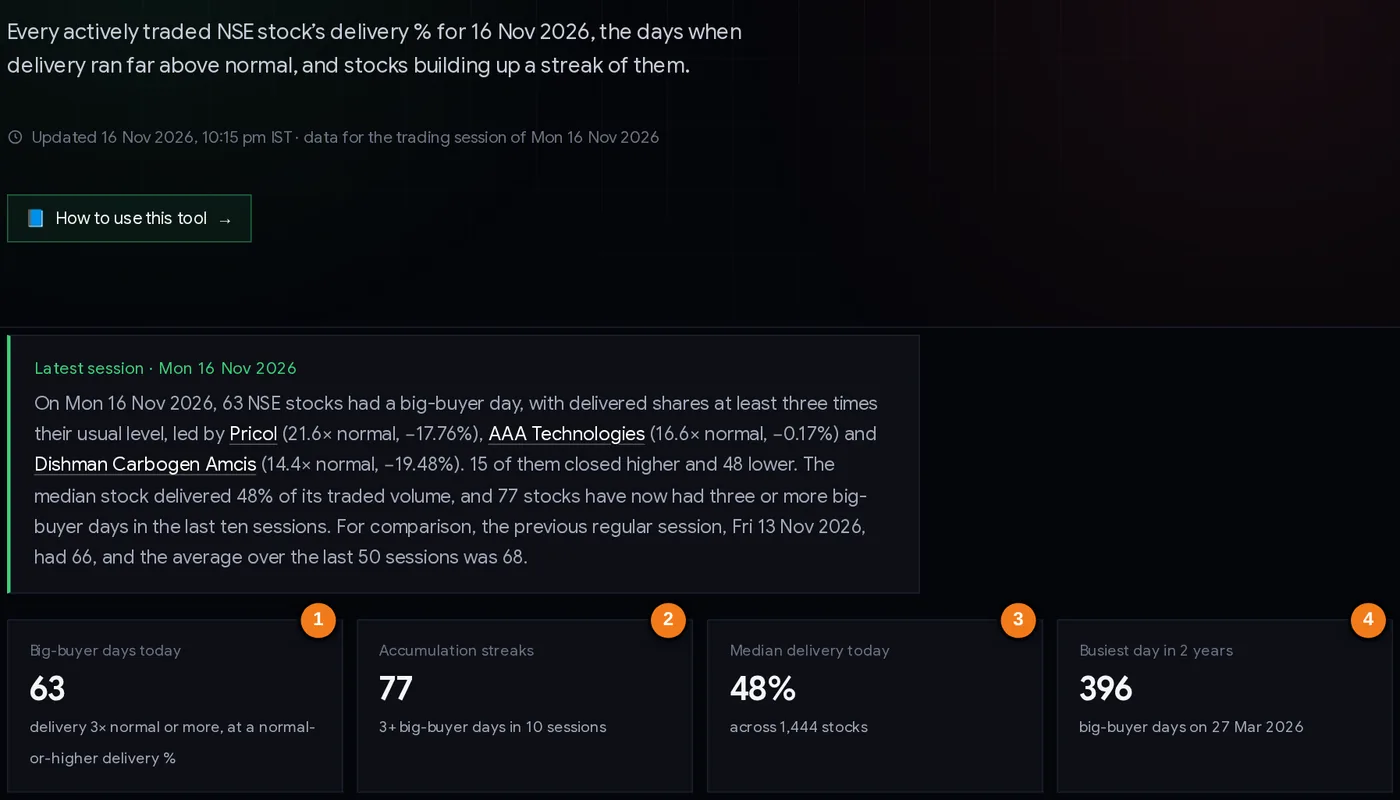
- 1Big-buyer days today: stocks whose delivered shares were 3× normal or more (with a normal-or-higher delivery %).
- 2Accumulation streaks: stocks with 3+ big-buyer days in the last 10 sessions.
- 3Median delivery today: the middle delivery % across all stocks on the page.
- 4Busiest day in 2 years: the most big-buyer days in one session, and when.
A normal day has a few dozen big-buyer days (the median since January 2025 is 66). A number in the hundreds means a market-wide event, such as an index rebalancing or a sharp market move; read individual stocks with extra care on those days.
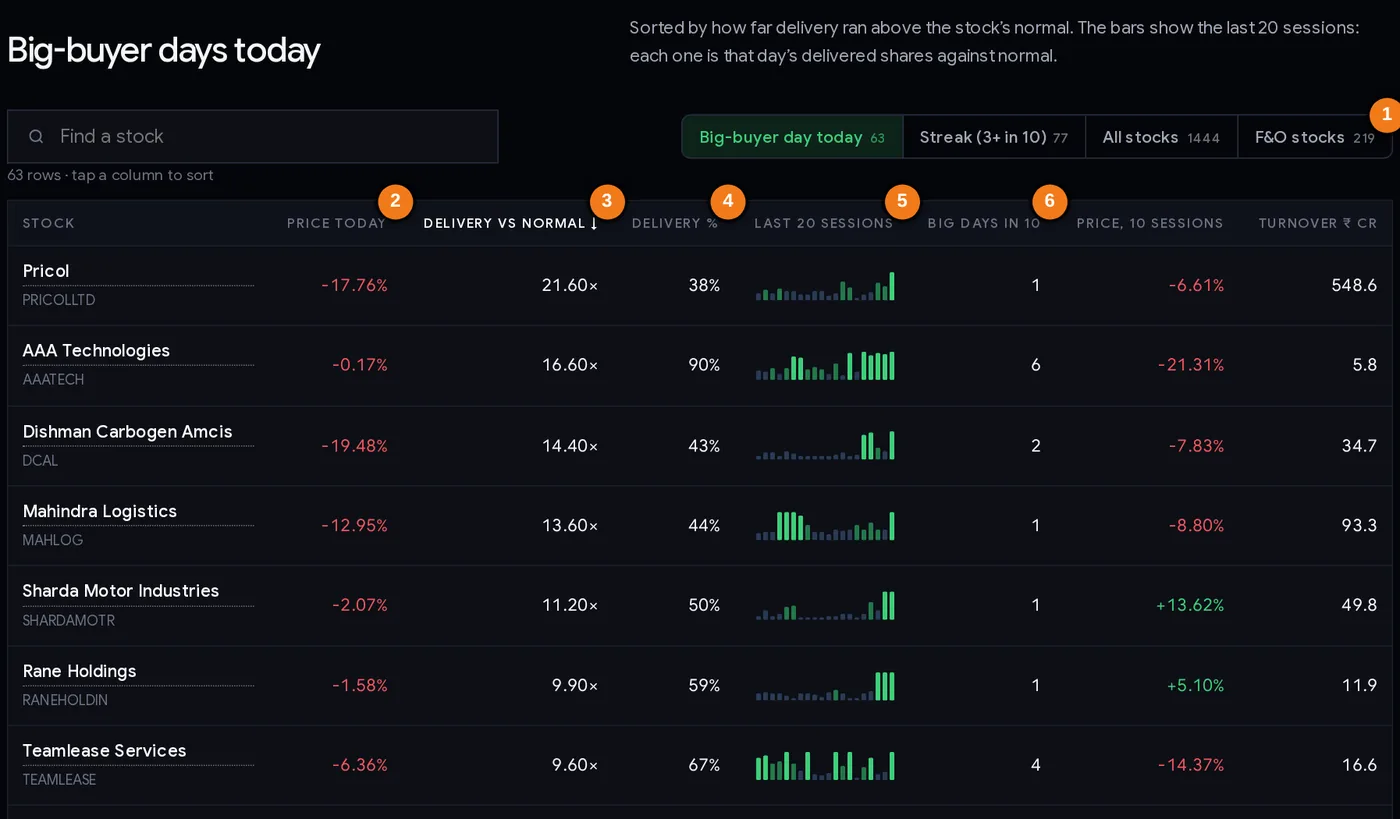
- 1Filters: big-buyer day today, streak, all stocks, F&O stocks.
- 2Price change today.
- 3Delivered shares against the 50-session median.
- 4Delivery % today.
- 5Last 20 sessions: one bar per day, delivered shares against normal.
- 6Big-buyer days in the last 10 sessions.
The filter buttons
- Big-buyer day today (default): only stocks that met all the big-buyer rules in the latest session.
- Streak (3+ in 10): stocks with three or more big-buyer days in the last ten sessions.
- All stocks: every stock on the page, so you can look up any delivery %.
- F&O stocks: only stocks with futures and options.
- Find a stock: type a name or symbol.
Every column explained
| Column | What it tells you |
|---|---|
| Stock | Name and symbol; click to open the stock’s page with its full delivery history. |
| Price today | Close-to-close change in the latest session. Read every delivery number together with this. |
| Delivery vs normal | Delivered shares ÷ the 50-session median. The table is sorted by this, highest first. |
| Delivery % | Share of today’s volume that was delivered. |
| Last 20 sessions | Small bars, one per session: each day’s delivered shares against normal. A single tall bar on the right is a fresh spike; several tall bars are a streak. Hover a bar to see the multiple. |
| Big days in 10 | Big-buyer days in the last ten sessions. |
| Price, 10 sessions | Price change over the last ten sessions, to see whether the heavy delivery came with a rise or a fall. |
| Turnover ₹ Cr | Value traded today in ₹ crore. Small turnover means fewer, larger trades can drive the numbers. |
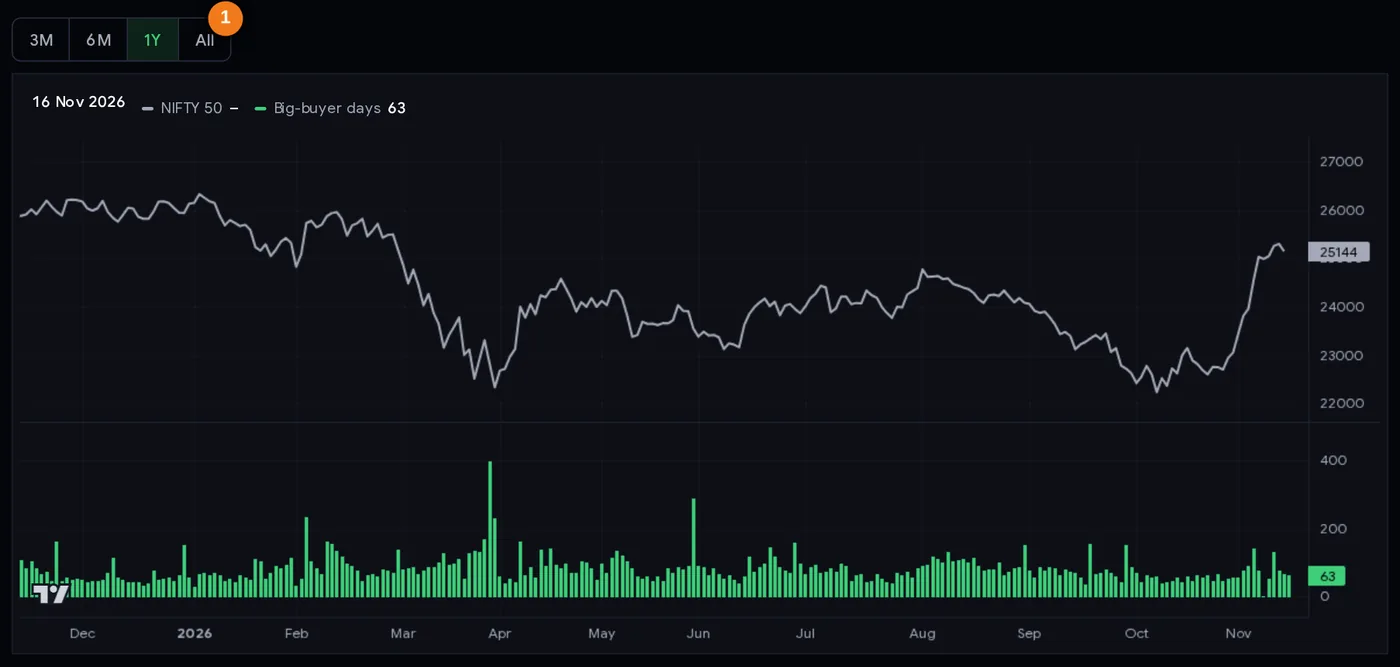
- 1Range buttons: 3 months, 6 months, 1 year or all.
The pulse chart plots the number of big-buyer days across the market each session (green bars) against NIFTY 50 (grey line). Switch the range with 3M / 6M / 1Y / All. The busiest day in two years was 27 Mar 2026, with 391 big-buyer days, when NIFTY fell 2.09%.
Step by step: a 15-minute evening routine
- After the evening update, open the page and check the date in the heading.
- Read the summary cards. If big-buyer days run into the hundreds, it was a market-wide event; be slower to read meaning into single stocks.
- Start with “Big-buyer day today”. Note the price column: split the list mentally into heavy delivery on up days and on down days.
- Check for deals. For every name you care about, open bulk and block deals. A large holder selling explains many top entries.
- Check for events. Results (results calendar), board meetings, index changes, F&O expiry.
- Switch to “Streak (3+ in 10)”. Look at “Price, 10 sessions”: a streak with a rising price looks like accumulation; a streak with a falling price looks like distribution (holders exiting).
- Look at the chart and trend. Open the stock page. Is the stock above its key moving averages? Did it break out of a range on the heavy-delivery day?
- For F&O stocks, check futures. OI build-up: long build-up (price up, OI up) alongside heavy delivery means the cash and futures markets agreed.
- Write a shortlist of 3–5 names with the reason, the level where the idea is wrong, and the event dates. Then wait for price to confirm.
Three playbooks
Playbook A: the delivery-backed breakout (swing traders)
- Find a stock that has been in a range for weeks.
- Wait for a close above the range high with a big-buyer day and a delivery % above the stock’s normal.
- Check there is no block deal or index event behind it, and no results in the next few days unless you accept that risk.
- Enter only if the price holds above the old range high the next day or two. Stop loss below the breakout day’s low or back inside the range.
- Our test says this tilts the odds only slightly, so keep position size modest and exit if the price falls back into the range.
Playbook B: the low-delivery warning (everyone)
When a stock you hold or are watching jumps on very low delivery (say below 25%, and well below its own normal), treat the rally with suspicion. In our data these moves lagged the market afterwards more often than not. It is a reason not to chase, or to tighten a stop; it is not a reason to short.
Playbook C: the accumulation watchlist (investors)
Every week, look at the “Streak (3+ in 10)” filter. Note the companies you would be happy to own, with a rising “Price, 10 sessions”. Then do the real work: results trend (quarterly growers), shareholding changes (shareholding), valuation. Delivery points you to where large investors are active; it does not tell you whether the business is good.
Risk management. Decide in advance how much of your capital you can lose on one idea (for example 1%), and use the position size calculator with your entry and stop loss. Delivery data changes how confident you feel, not how much you can afford to lose.
Case studies from NSE data
Five real examples from NSE’s bhavcopy and deal data. They were chosen to show the signal working, failing, and being misread, not to show only winners. Prices in ₹.
1. TVS Motor, 30 Jul 2026: the textbook case that worked
The stock rose 3.26% to 4,208.40. 18.1 lakh shares were delivered, 3.4× normal, with delivery at 62.3% against a normal of about 56%: a big-buyer day on a clean rise. It added 2.5% the next day; five sessions later it was at 4,375 (+4.0%) and twenty sessions later at 4,409.80 (+4.8%).
2. TCS, 2 Jun 2026: the textbook case that failed
Up 6.51% to 2,446.90, 58.8 lakh shares delivered (3.2× normal, delivery 52%). It looked exactly like “genuine buying”. The very next day the stock fell 8.39%, also on heavy delivery (3.7× normal), and twenty sessions later it was at 1,982.60, 19% below the big-buyer day’s close. Lesson: heavy delivery on a rise is one piece of evidence; a stop loss below the breakout day would have limited the damage.
3. 29 May 2026: when the whole market had “big-buyer days”
286 stocks had a big-buyer day, more than four times the usual 66, while NIFTY fell 1.50%. Power Grid delivered 77% of its volume (9.1× normal) and fell 3.20%; Reliance delivered 74% (3.8× normal) and fell 2.17%. Twenty sessions later both were still about 1.5% lower. 29 May was the last trading day of May, the date on which MSCI’s semi-annual index changes usually take effect; we cannot see fund-level trades in NSE’s data, but index funds trading at the close produce exactly this pattern. Lesson: check the pulse chart before reading a single stock’s spike.
4. 6 Nov 2026: big-buyer days that were big-seller days
The top of the 6 Nov table was JSW Cement at 27.9× normal delivery. NSE’s bulk-deal data shows Synergy Metals Investments Holding selling 1.91 crore shares at 120.50, with Nomura Funds Ireland buying 1.2 crore. Groww (9.6× normal, delivery 53.7%, price −3.93%) saw Peak XV Partners sell 6.02 crore shares at 215.20 in a bulk deal, while Goldman Sachs Bank Europe (ODI) bought 3.55 crore. Lesson: heavy delivery means shares changed owners; it does not say the buyers were the ones in a hurry. Always check bulk and block deals.
5. Wipro, 29 Sep 2026: heavy delivery on a fall, then a rally
Wipro fell 2.95% to 156.79 with 87.6% of its volume delivered: 14.4 crore shares, 32× normal. It was also the monthly F&O expiry day. Anyone reading that as “investors dumping” would have been wrong: twenty sessions later the stock was at 190.10 (+21.2%). Lesson: high delivery on a fall is not automatically bearish; our two-year test agrees (53% did better than the median stock).
Common mistakes
- Treating high delivery as a buy signal. Delivery counts both sides: every delivered share has a seller too.
- Comparing delivery % across stocks. 40% is high for a heavily traded stock and low for a quiet one. Use “Delivery vs normal”.
- Ignoring the price move. Heavy delivery on a rise and on a fall mean different things, and even a rise is only a mild tilt.
- Missing block deals and index days. Cases 3 and 4 show how often the top of the list is mechanical.
- Chasing low-delivery rallies. Our data’s clearest finding: they lagged.
- Using delivery for intraday trades. The data arrives after the close; it describes the day that ended.
- No stop loss because “institutions are buying”. Case 2 fell 19%.
Checklist before acting on a high-delivery day
- The date is the latest session, and the market-wide count of big-buyer days looks normal.
- Delivery is high against the stock’s own normal, not just a high-looking %.
- I know the price move: up, down, or flat.
- No block or bulk deal, OFS or index rebalancing explains the day.
- No results or major event in the next few sessions (or I accept that risk).
- The chart agrees: breakout from a range or a trend, not a spike into resistance.
- For F&O stocks, futures OI agrees (long build-up on a rise).
- Entry after confirmation; stop loss and position size decided first.
Glossary
| Delivery % | Deliverable quantity ÷ traded quantity × 100. |
| Deliverable quantity | Shares that actually move between demat accounts at settlement. |
| Intraday trade | A position opened and closed within the same day; nothing is delivered. |
| T+1 settlement | Shares and money change hands one working day after the trade. |
| Big-buyer day | Delivered shares ≥ 3× the 50-session median, with delivery % at least three-quarters of normal. |
| Accumulation / distribution | Large investors steadily buying / steadily selling over days or weeks. |
| Bulk deal | A trade in which one client buys or sells more than 0.5% of a company’s shares in a day; disclosed by NSE. |
| Block deal | A large trade done in a special trading window; disclosed by NSE. |
| Index rebalancing | An index provider changing its constituents or weights; index funds then trade at the close. |
| FPI / DII | Foreign portfolio investors; domestic institutional investors (mutual funds, insurers). |
| Prop desk | A broker’s or firm’s own-money trading team, often very active intraday. |
| Bhavcopy | NSE’s end-of-day file with every stock’s prices, volume and delivery. |
Questions
What is a good delivery percentage?
There is no single good number: it depends on the stock. Across NSE stocks the median is in the mid-40s (46% on 6 Nov 2026). Compare a stock with its own normal; the page’s “Delivery vs normal” column does this for you.
Is high delivery percentage bullish?
Not by itself. In ChartMine’s test from Oct 2024 to Oct 2026, up days with 70%+ delivery beat the median stock over 20 sessions 54% of the time, against 48% for all up days: a mild tilt. Heavy delivery on a fall was not bearish either (53%).
What does low delivery with a price rise mean?
Most of the buying was intraday trading, not investors taking shares home. In our data, rises of 2% or more on delivery below 25% beat the median stock only 43% of the time over the next 20 sessions.
Where does NSE publish delivery data?
In its daily security-wise delivery position and full bhavcopy, released after the close. ChartMine downloads it every evening and calculates delivery vs normal and big-buyer days for each stock.
What is a big-buyer day?
A session when a stock’s delivered shares are at least 3 times its median of the previous 50 sessions and its delivery % is at least three-quarters of its usual level. It often coincides with block deals or index rebalancing, so check those first.
Why do so many stocks show high delivery on some days?
Market-wide events: index rebalancing (when index funds trade large blocks at the close), sharp market falls or rallies, and sometimes F&O expiry. The pulse chart on the page shows these days; the busiest in two years was 27 Mar 2026 with 391 big-buyer days.