
☰ All tutorials
Start here
Tool tutorialsHow to trade with ChartMineStocks
Stock monitorMy watchlistStock scores & checklistMarket & sectors
Nifty 50Bank NiftySensexFin NiftyDaily market reportMarket breadthSector rotationSector heatmapStock screenerRelative strength (RS)MCX commodity pricesFear & Greed IndexWhat happens after…Scanners
Top gainers & losersStocks to watch tomorrowNR7 stocks scannerInside bar stocks52-week high stocksGap up & gap down stocksRSI oversold stocksGolden cross stocksSuperTrend buy stocksScan builderEMA 9/21 crossoverMACD crossoverADX strong trendBollinger breakout / squeezeVolume spike stocksOpen = high / open = lowCandlestick pattern scannerNarrow CPR scannerF&O data
F&O ban listOI build-upOption chainPCR & max painExpiry calendarF&O lot sizesOI build-up heatmapPCR trendMax pain trendFutures basisStock screens
Quarterly growersProfit growth stocksLow P/E stocksMutual fund buyingNear 52-week low, growingDebt-free companiesHigh ROE & ROCEMagic Formula stocksLow price-to-bookSmart money
FII / DII dataShareholding changesBig-money footprintShort selling dataF&O positions by participantBulk & block dealsPromoter buyingDelivery percentageCalendars
Results calendarQuarterly results trackerBoard meetingsCorporate actionsIPO calendarIPO performanceResearch & planning
Strategy testerCompare stocksDividend yield stocksASM / GSM listExpiry-day movesSeasonality & stock historyNSE holidays 2026Position size calculatorOption payoff calculatorPivot point calculatorMore
Stock scanners hubStock screensHow to use the Stock scanners
A plain-language map of every scanner on ChartMine: what each one finds, which stocks it covers, how a scanner page works, what the scanners showed on 13 Nov 2026, and how to combine them in an evening routine.
What the stock scanners hub is, in plain words
A stock scanner checks many stocks at once for one specific condition and hands you the list that passes. Instead of opening 200 charts every evening to find which stocks made a new 52-week high or had an unusually quiet day, you open one page.
The stock scanners hub is the front door to every scanner on ChartMine. Each card opens one scanner. There are three families:
- Pattern scanners on F&O stocks: NR7, inside bar, 52-week high and low, gaps, RSI, golden cross, SuperTrend, candlestick patterns and the narrow CPR scanner.
- Indicator scanners on all actively traded stocks (new on 14 Nov 2026): 9/21 EMA crossover, MACD crossover, ADX strong trend, Bollinger breakout and squeeze, volume spike, and open = high / open = low.
- Lists and tools: stocks to watch tomorrow, top gainers and losers, and the scan builder for making your own scan.
All of them use end-of-day data: the official daily prices from NSE, adjusted for splits and bonuses, refreshed in the evening after each trading day. They are built for preparing a watchlist for the next session, not for live intraday signals.
One line to remember: each scanner answers one question about yesterday’s candle. None of them tells you what the price will do tomorrow. They tell you where to look.
Which stocks each scanner covers
This is the most important thing to know before comparing scanners: they do not all look at the same stocks.
| Universe | Which scanners | How many | Why it matters |
|---|---|---|---|
| F&O stocks + indices | NR7, inside bar, 52-week high/low, gap up/down, RSI, golden cross, SuperTrend, candlestick patterns, narrow CPR | 221 F&O stocks and 4 indices on 13 Nov 2026 (NIFTY, BANK NIFTY and others) | Large, liquid stocks with futures and options. Lists are short and every name is easy to trade. |
| All actively traded NSE stocks | EMA crossover, MACD crossover, ADX, Bollinger, volume spike, open = high/low, scan builder | About 1,300 (1,304 on 13 Nov 2026), including 199 tagged as F&O stocks | Includes small and mid caps. Lists are much longer, and some names are thinly traded. |
| Liquid NSE stocks | Stocks to watch tomorrow | Stocks trading at least ₹5 crore a day | A ranking, not a yes/no scan. |
You can see the universe on every scanner page in the small badge above the heading: “every F&O stock and index” for the first family, “every actively traded NSE stock” for the second.
Do not compare counts across universes. On 13 Nov 2026 the RSI scanner found 31 overbought F&O stocks, while 75 stocks across the whole market had RSI above 70. Both are right; they looked at different groups.
The pattern scanners on F&O stocks
Each of these runs on the F&O universe after the close. Tap a name to open the scanner; the tutorial link explains it in depth.
| Scanner | What it finds | Tabs | Tutorial |
|---|---|---|---|
| NR7 stocks | Today’s high-low range was the narrowest of the last 7 sessions: a quiet, coiled day. | All NR7; NR7 + inside bar | NR7 guide |
| Inside bar stocks | The whole day stayed inside the previous day’s high and low (the “mother bar”). | All inside bars; inside bar + NR7 | Inside bar guide |
| 52-week high / low | New 52-week high or low today, or a close within 2% of one, with volume. | New high; near high; new low; near low | 52-week guide |
| Gap up / gap down | Opened 1%+ above or below the previous close, and whether the gap stayed open. | Gap up; gap down; unfilled gaps | Gap guide |
| RSI oversold / overbought | 14-day RSI below 30 or above 70. | Oversold; deeply oversold (below 20); overbought | RSI guide |
| Golden cross / death cross | 50-day average crossed above (or below) the 200-day in the last 5 sessions. | Golden cross; crossed today; death cross | Golden cross guide |
| SuperTrend buy / sell | Daily SuperTrend (10, 3) flipped up or down in the last 3 sessions. | Buy; turned up today; sell | SuperTrend guide |
| Candlestick patterns | Fifteen classic patterns (doji, hammer, engulfing, harami, stars, marubozu and more), each with a two-year test. | One page per pattern | See the scanner page |
| Narrow CPR scanner | Tomorrow’s tightest Central Pivot Ranges with trend, pivot levels and OI build-up. | Filters by CPR type, trend, build-up | CPR guide |
The six all-stock scanners, plus lists and tools
These six went live on 14 Nov 2026 and scan about 1,300 stocks. They use standard indicator settings on daily closes.
| Scanner | What it finds | Tabs | 13 Nov 2026 |
|---|---|---|---|
| EMA 9/21 crossover | The 9-day EMA crossed the 21-day EMA in the last 3 sessions: a short-term trend turn. | Bullish; crossed today; bearish | 225 bullish, 23 bearish |
| MACD crossover | MACD (12, 26, 9) crossed its signal line in the last 3 sessions. | Bullish; bullish below zero; bearish | 119 bullish, 48 bearish |
| ADX strong trend | ADX (14) at 25+, split by direction with +DI and −DI; and stocks whose ADX is rising. | Strong uptrend; very strong (ADX 40+); strong downtrend; strengthening | 404 up, 188 down |
| Bollinger breakout / squeeze | Close above the upper or below the lower band (20, 2); and the narrowest bands in 120 sessions. | Upper breakout; squeeze; lower break | 86 above, 5 below, 13 squeezes |
| Volume spike | Volume at least 2× (or 3×) the 20-session average. | 2×; 3×; 2× price up; 2× price down | 142 at 2×, 81 at 3× |
| Open = high / open = low | The open was the day’s high (never traded above it) or the day’s low (never traded below it). | Open = low; open = high; open = low with 1.5× volume | 245 open = high, 35 open = low |
Guides for these scanners: volume spike guide. For the others, the explanation cards on each scanner page cover the basics, and the scan builder lets you combine all of their signals.
Notice how lopsided 13 Nov was: 245 stocks had open = high (sellers from the first trade) against 35 with open = low. Counts like these are a quick read of the day’s mood, but they say nothing about any single stock.
Lists and tools
Stocks to watch tomorrow
Every liquid NSE stock ranked by its measured chance of a 5%+ move in the next session, up or down, with a daily scorecard. Read the guide.
Top gainers and losers
The day’s biggest NSE gainers and losers, stocks trading far above their usual volume, and NIFTY 50 movers at the close.
Scan builder
Your own scan: combine price, volume, delivery, RSI, MACD, ADX, Bollinger, moving-average and candlestick conditions on about 1,300 stocks. Save it or share the link. Read the guide.
The scanners are fixed questions; the scan builder is where you ask your own. If you find yourself using “Combine with” on a scanner page every evening, that combination is a good candidate for a saved scan.
Why use scanners: advantages and limits
✅ Saves hours
One page replaces opening hundreds of charts. Most scanners finish their lists in the evening, so you can plan before the next open.
✅ Objective rules
Each scanner uses an exact, published rule (for example “RSI(14) below 30”). No opinions, no guessing what “oversold” means.
✅ Context in one row
Volume, RSI, distance from the 200-day average and from the 52-week high, gap and other scans sit next to every result.
✅ Combinable
Filters, “Combine with” buttons and the scan builder let you stack conditions.
The limits
- A setup is not a prediction. Each tutorial reports its own test honestly. For example, our two-year test of volume spikes found no next-day direction edge: after 2× volume days stocks closed up 47% of the time, the same as an ordinary day.
- End of day only. The lists describe yesterday. Gaps and news overnight can cancel a setup before the open.
- Market-wide days distort counts. On a very quiet or very strong day, hundreds of stocks can fire the same signal. That is a market story, not hundreds of setups.
- Different universes. F&O scanners miss smaller stocks; all-stock scanners include thin ones. Check liquidity.
- Signals lag. Moving-average signals (golden cross, EMA, MACD, SuperTrend) confirm a move after it has started.
A tour of the hub and a scanner page
Open the stock scanners hub. Every card is a scanner; the small line at the top says when it updates.
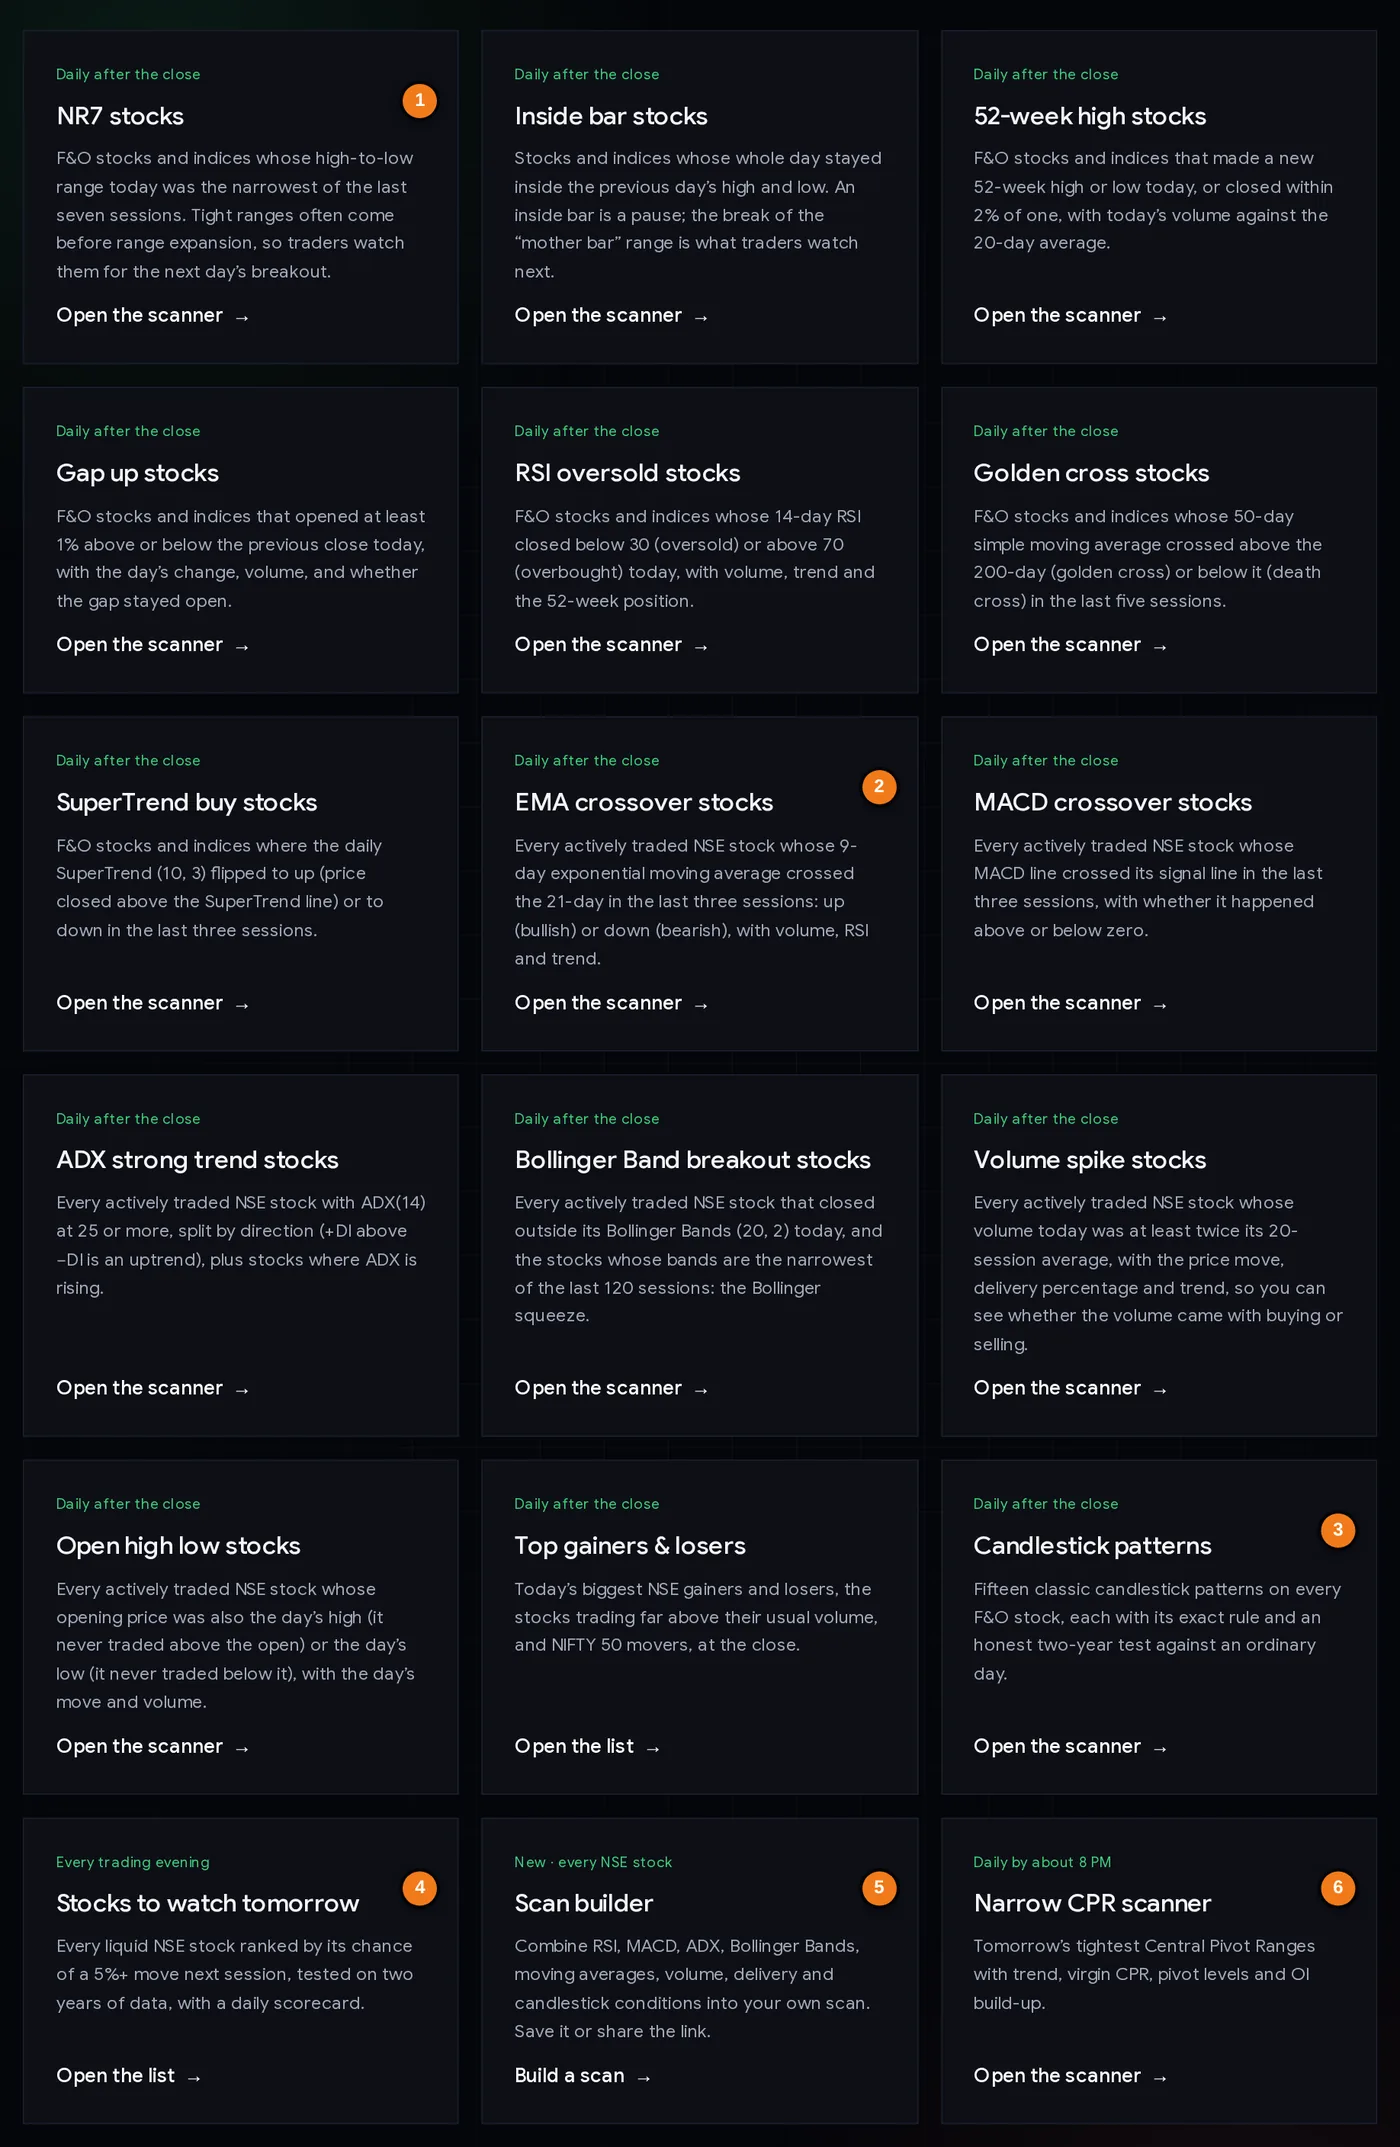
- 1Pattern scanners on F&O stocks start here (NR7, inside bar, 52-week, gaps, RSI, golden cross, SuperTrend).
- 2The six indicator scanners on all stocks start here (EMA, MACD, ADX, Bollinger, volume, open high low).
- 3Candlestick patterns.
- 4Stocks to watch tomorrow.
- 5Scan builder: make your own scan.
- 6Narrow CPR scanner.
Every pattern and indicator scanner page has the same layout, so once you learn one you can read them all. The badge tells you the universe.
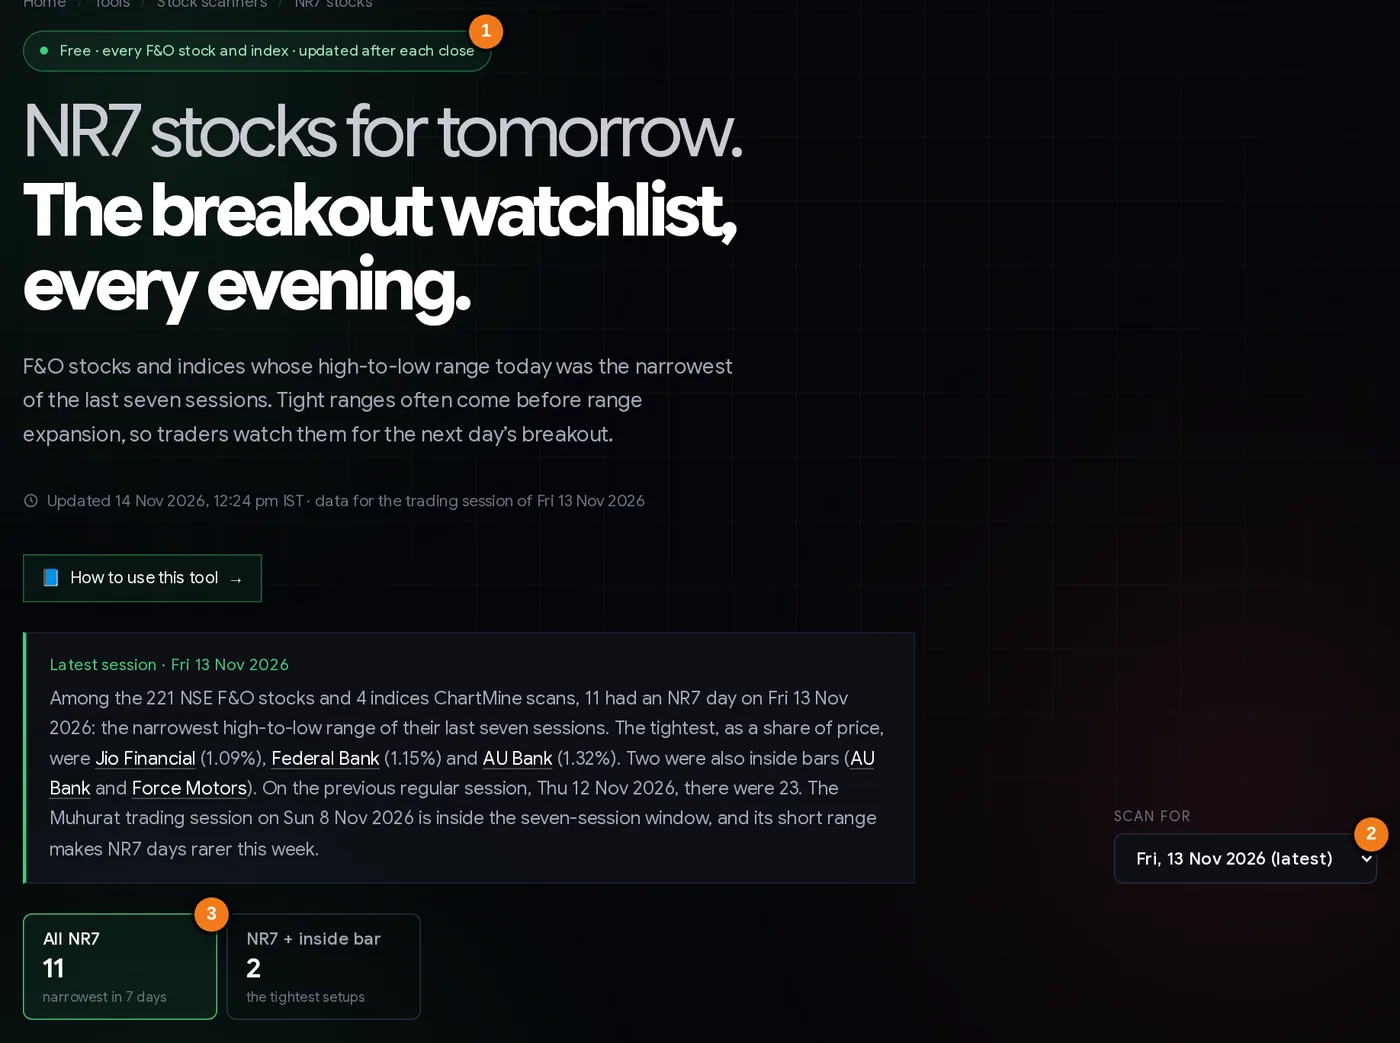
- 1Universe badge: F&O stocks and indices.
- 2Scan for: choose the session.
- 3Tabs with today’s counts.
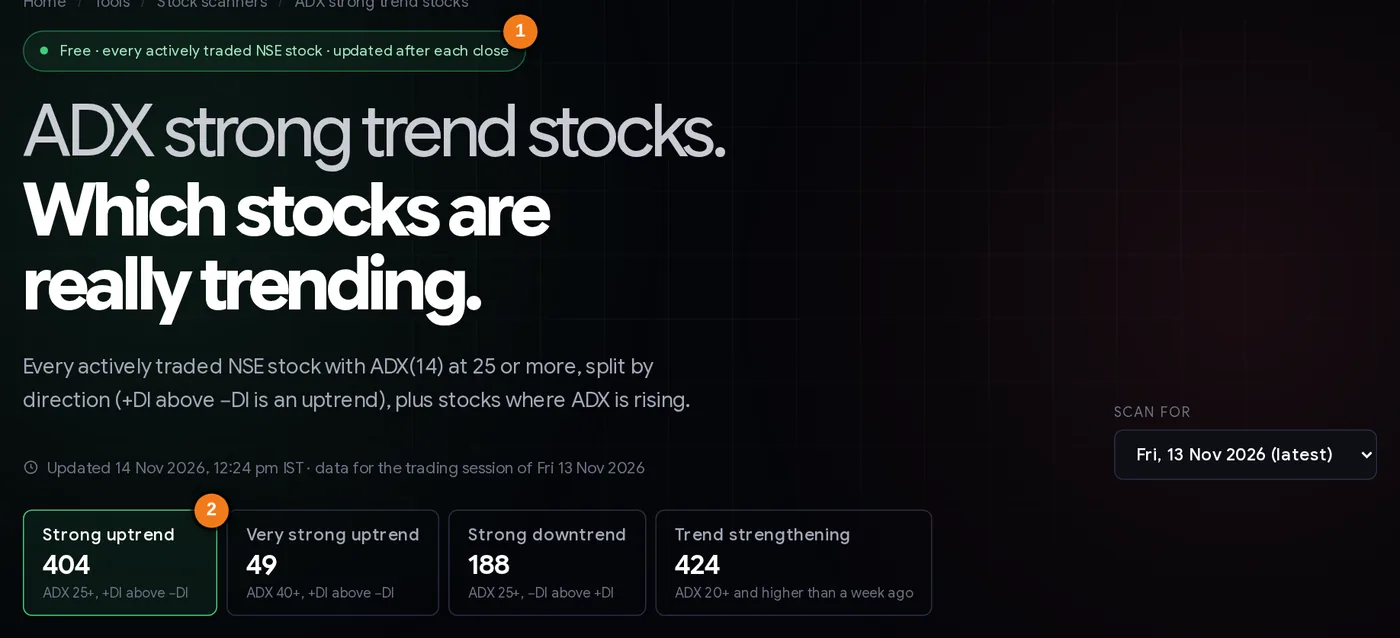
- 1Universe badge: every actively traded NSE stock.
- 2Four tabs, each with its count for the session.
The common parts of a scanner page
| Part | What it does |
|---|---|
| Scan for | Pick the session. The latest is selected by default; older scans stay available for review. |
| Tabs | The variants of the scan, each with its count for the chosen day. |
| Show / Today / Trend | Stocks or indices; closed up or down; above or below the 200-day or 50-day average. |
| Combine with | Keep only results that also had an NR7, inside bar, 52-week high or low nearby, or a gap. |
| More filters | RSI band, minimum volume (1.5×, 2×, 3×), price band, and sector (members of NIFTY sector indices). |
| Table | Symbol, close, change, day range, volume vs 20-day average, RSI, distance from the 200-DMA, distance from the 52-week high, gap at open, and “Also in” (other scans the stock is in today). |
| CSV / Reset | Download the filtered list; clear all filters. Filters stay in the address bar, so a link reopens the same view. |
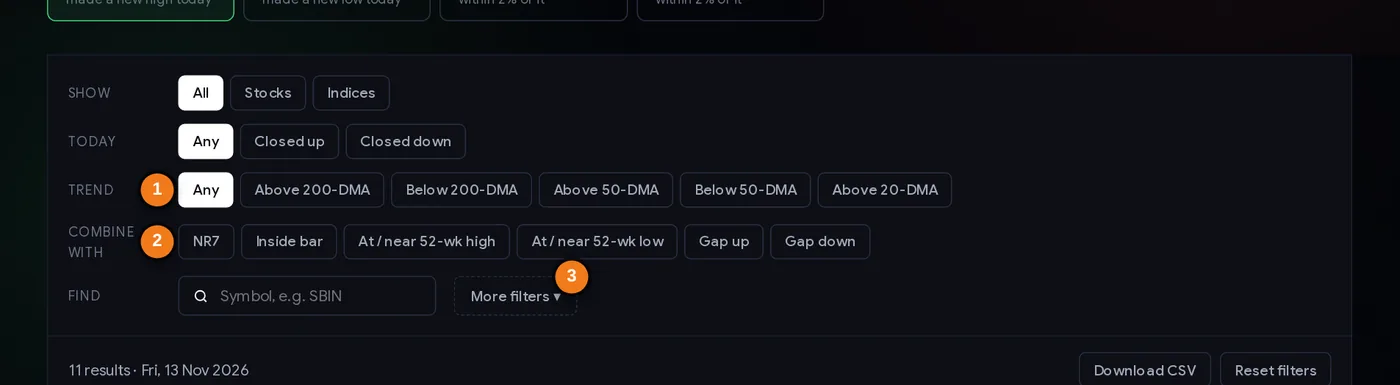
- 1Trend: above or below the 200-day or 50-day average.
- 2Combine with: NR7, inside bar, 52-week high/low, gap up/down.
- 3More filters: RSI, volume, price, sector.
The “Combine with” row is how you stack two scanners without the scan builder. On the 52-week high page, for example, adding NR7 keeps stocks near their high that also had a very quiet day.
What the scanners showed on 13 Nov 2026
Real results for the session of Friday 13 Nov 2026, to show how the scanners fit together. Prices in ₹. None of this is a recommendation.
The day at a glance (F&O universe)
| Scanner | Count |
|---|---|
| New 52-week high / near high | 11 / 10 |
| New 52-week low / near low | 0 / 1 |
| RSI overbought / oversold | 31 / 2 |
| Gap up / gap down | 2 / 14 |
| NR7 / inside bar | 11 / 23 |
| SuperTrend buy / sell (last 3 sessions) | 24 / 1 |
| Golden cross / death cross (last 5 sessions) | 1 / 3 |
| Narrow CPR list for the next session | 167 of 240 instruments |
Read together: many strong stocks (31 overbought, 11 new highs, no new lows), but a soft open (14 gap downs against 2 gap ups) and sellers active early across the wider market (245 open = high).
1. One stock, five scanners: Hitachi Energy India
Gap up of 5.06% that never filled, close +10.68% at 31,595, volume 5.89× its average, SuperTrend turned up that day, and a close above the upper Bollinger Band. It appeared in the gap, SuperTrend, EMA crossover, Bollinger and volume scanners at once. Lesson: when a stock shows up in several unrelated scanners, something real happened; the “Also in” column makes that visible. It also means the move is already large: RSI 61.9 and a 7.28% day range.
2. The bearish mirror: Page Industries
RSI 29.6 (oversold), SuperTrend sell flip, MACD and EMA bearish crossovers, a close below the lower Bollinger Band and 8.83× volume, at 31,325 (−1.65%). The RSI scanner calls it “oversold”, but every trend scanner says “down”. Lesson: an oversold reading inside a fresh downtrend is a warning, not a bargain sign. The RSI guide covers this.
3. The tightest coil: AU Bank and Force Motors
Only two F&O stocks were both NR7 and inside bar: AU Bank (day range 1.32%, close 967) and Force Motors (1.63%, close 19,600). Both are the “NR7 + inside bar” tab on the NR7 page. Lesson: combining two quiet-day scanners shrinks a list of 23 to a list of 2, the kind of short list you can actually plan.
4. A slow signal meets a quiet stock: HCL Tech
The only golden cross in the F&O list (the 50-day average crossed above the 200-day two sessions earlier) was HCL Tech, which also sat in a Bollinger squeeze (band width 5.9%) along with TCS, Infosys and Tech Mahindra. Lesson: a golden cross on a stock that is barely moving says the long-term averages caught up, not that a move has begun. Watch for the squeeze to resolve.
Step by step: an evening scanner routine (20 minutes)
- After about 8 PM IST, open the hub. Check that the scanners show the latest session.
- Read the mood first (2 minutes). Count new highs versus new lows, overbought versus oversold, gap ups versus gap downs. If the market is one-sided, prefer setups that agree with it.
- Pick one primary scanner that matches your style: trend followers start with ADX strong uptrend or the 52-week high page; breakout traders with NR7 or inside bar; swing traders with EMA or MACD crossovers.
- Add the trend filter: “Above 200-DMA” for long ideas, “Below 200-DMA” for short ones.
- Stack one more condition with “Combine with” or More filters (volume 1.5×+, or a nearby 52-week high).
- Check “Also in” for overlaps and contradictions (an oversold stock with a SuperTrend sell, for example).
- Remove event risk: results, board meetings and big deals. Check the results calendar and bulk and block deals.
- For the final 3 to 5 names, open the narrow CPR scanner or pivot point calculator for tomorrow’s levels, and write the plan: trigger, stop loss, size.
- Save repeat combinations in the scan builder so tomorrow’s routine is one tap.
Three scanner combinations traders use
Combination A: quiet day near the highs (breakout watch)
52-week high page → tab “Near 52-week high” → Combine with NR7 or Inside bar → Trend Above 200-DMA. The idea: a strong stock pausing just under its high. Traders watch for a close above the quiet day’s high, with the low of that day as the point where the idea is wrong. Check the NR7 guide for what our data says about range expansion.
Combination B: trend plus fresh turn (swing)
ADX page → “Strong uptrend” → then compare with the EMA crossover or SuperTrend buy list. Stocks in both have a strong trend and a fresh short-term turn. In the scan builder this is: ADX ≥ 25, +DI above −DI, and the 9/21 EMA bullish crossover signal. Use the recent swing low for the stop and the position size calculator for the quantity.
Combination C: event filter (what moved and why)
Volume spike page “3× volume” plus the gap up / gap down page. Stocks in both had overnight news and heavy follow-through. This is a research list, not a trade list: find the reason first (results, deals, announcements), then decide whether the spike day’s high or low matters to you. The gap guide explains filled and unfilled gaps.
These combinations organise your research; they are not recommendations. Always decide the stop loss and position size before any trade, and skip names with results due.
Common mistakes
- Comparing counts from different universes (F&O scanners versus all-stock scanners).
- Treating every name as a trade. 225 bullish EMA crossovers on 13 Nov is a market theme, not 225 opportunities.
- Ignoring contradictions. “Oversold” on RSI and “sell” on SuperTrend at the same time means the trend is still down.
- Using yesterday’s list after a big gap. A gap against the setup usually cancels it.
- Forgetting liquidity on the all-stock scanners. Some stocks trade only a few lakh rupees a day.
- Stacking too many filters until one random stock is left.
- Skipping the tutorials’ test results. Each guide says honestly what the pattern did in our data; read it before trusting a scanner.
Checklist for using the scanners
- The scan date is the latest trading day.
- I know which universe this scanner covers.
- Market mood checked: highs vs lows, gaps, overbought vs oversold.
- One primary scanner, one trend filter, at most one or two extra conditions.
- “Also in” checked for overlaps and contradictions.
- Results, deals and news checked for every shortlisted name.
- Levels, stop loss and position size written down before the open.
- Repeat combinations saved in the scan builder.
Glossary
| Scanner | A page that checks many stocks for one condition after the close. |
| Universe | The group of stocks a scanner checks (F&O stocks and indices, or all actively traded stocks). |
| End of day (EOD) | Data from the official daily close, not live prices. |
| NR7 | Narrowest high-low range of the last 7 sessions. |
| Inside bar | A day whose high and low stay inside the previous day’s. |
| Gap | Today’s open versus yesterday’s close; unfilled if the price never returned to yesterday’s range. |
| RSI | 14-day momentum gauge, 0 to 100; below 30 oversold, above 70 overbought. |
| Golden / death cross | 50-day average crossing above / below the 200-day. |
| SuperTrend | A trailing ATR-based line; a close through it flips the trend. |
| EMA, MACD, ADX | Exponential moving average; momentum from two EMAs; trend strength from 0 to 100. |
| Bollinger squeeze | The narrowest Bollinger Bands in 120 sessions: unusually low volatility. |
| CPR | Central Pivot Range: pivot levels for the next day from today’s high, low and close. |
| 200-DMA | The 200-day simple moving average, a common long-term trend line. |
Questions
What is a stock scanner?
A tool that checks many stocks for a specific condition, such as a new 52-week high or RSI below 30, and lists the ones that match. ChartMine’s scanners run on NSE’s end-of-day data every trading evening.
Are ChartMine’s stock scanners free?
Yes. All the scanners on the hub, the scan builder and the tutorials are free to use without a login.
Which stocks do the scanners cover?
The NR7, inside bar, 52-week, gap, RSI, golden cross, SuperTrend, candlestick and narrow CPR scanners cover about 220 F&O stocks plus the main indices. The EMA, MACD, ADX, Bollinger, volume spike and open high low scanners, and the scan builder, cover about 1,300 actively traded NSE stocks.
When are the scanners updated?
Every trading day in the evening, after NSE publishes its daily files, usually by about 8 PM IST. They show the latest session and keep recent sessions for review.
Which stock scanner is best for intraday trading?
These are end-of-day scanners used to prepare a watchlist for the next session. Intraday traders often use the narrow CPR scanner, NR7 and inside bar lists for levels, and confirm with live price action during the day.
Can I combine two scanners?
Yes. Use the Combine with buttons on a scanner page (for example 52-week high plus NR7), or build any combination of conditions in the scan builder and save it.
Do scanner results mean I should buy or sell?
No. A scanner lists stocks that meet a condition; it is information, not advice, and ChartMine is not a SEBI-registered adviser. Check the chart, news and results, and set your stop loss and position size before any trade.