
☰ All tutorials
Start here
Tool tutorialsHow to trade with ChartMineStocks
Stock monitorMy watchlistStock scores & checklistMarket & sectors
Nifty 50Bank NiftySensexFin NiftyDaily market reportMarket breadthSector rotationSector heatmapStock screenerRelative strength (RS)MCX commodity pricesFear & Greed IndexWhat happens after…Scanners
Top gainers & losersStocks to watch tomorrowNR7 stocks scannerInside bar stocks52-week high stocksGap up & gap down stocksRSI oversold stocksGolden cross stocksSuperTrend buy stocksScan builderEMA 9/21 crossoverMACD crossoverADX strong trendBollinger breakout / squeezeVolume spike stocksOpen = high / open = lowCandlestick pattern scannerNarrow CPR scannerF&O data
F&O ban listOI build-upOption chainPCR & max painExpiry calendarF&O lot sizesOI build-up heatmapPCR trendMax pain trendFutures basisStock screens
Quarterly growersProfit growth stocksLow P/E stocksMutual fund buyingNear 52-week low, growingDebt-free companiesHigh ROE & ROCEMagic Formula stocksLow price-to-bookSmart money
FII / DII dataShareholding changesBig-money footprintShort selling dataF&O positions by participantBulk & block dealsPromoter buyingDelivery percentageCalendars
Results calendarQuarterly results trackerBoard meetingsCorporate actionsIPO calendarIPO performanceResearch & planning
Strategy testerCompare stocksDividend yield stocksASM / GSM listExpiry-day movesSeasonality & stock historyNSE holidays 2026Position size calculatorOption payoff calculatorPivot point calculatorMore
Stock scanners hubStock screensHow to use the Bollinger Band breakout scanner
A plain-language tutorial on Bollinger Bands: how the bands and the squeeze are calculated, how to read every part of the scanner, what our own 22-month test on about 1,500 NSE stocks found, and three playbooks with real case studies.
What Bollinger Bands are, in plain words
Bollinger Bands are three lines drawn around a stock’s price. They were created by the American analyst John Bollinger in the 1980s and are now built into almost every charting app.
- The middle band is the average closing price of the last 20 trading days (a 20-day simple moving average).
- The upper band sits two standard deviations above that average.
- The lower band sits two standard deviations below it.
A standard deviation is simply a measure of how much the closes have been jumping around. When a stock is calm, its closes stay near the average, the standard deviation is small and the bands come close together. When a stock is swinging wildly, the bands move far apart. So the bands breathe with the stock: narrow in quiet times, wide in busy times.
One line to remember: the bands do not predict anything. They describe how far today’s close is from its recent average, measured in units of the stock’s own recent volatility.
The Bollinger Band breakout scanner checks about 1,500 actively traded NSE stocks after every close and gives you three lists: stocks that closed above the upper band, stocks that closed below the lower band, and stocks in a Bollinger squeeze, where the bands are the narrowest they have been in about six months.
How the scanner calculates the bands (with a real example)
The settings are the standard ones, written as (20, 2): 20 days for the average and 2 standard deviations for the bands.
- Middle band = the average of the last 20 daily closes, today included.
- Standard deviation of the same 20 closes.
- Upper band = middle + 2 × standard deviation. Lower band = middle − 2 × standard deviation.
- Band width = (upper − lower) ÷ middle, shown as a %. It lets you compare a ₹50 stock with a ₹30,000 stock.
- A stock is listed as a breakout only if its closing price is outside the band. An intraday spike that falls back before 3:30 PM does not count.
- A stock is in a squeeze when today’s band width is equal to or lower than every one of the previous 119 sessions, so the narrowest of 120 sessions. The stock needs at least 140 sessions of history for this test.
Example: Hitachi Energy India (POWERINDIA), Friday 13 Nov 2026
On 13 Nov 2026 the stock’s 20-day average was ₹28,191.25, its upper band ₹30,344.53 and its lower band ₹26,037.97, a band width of 15.28%. It opened with a gap at ₹29,990, traded as high as ₹32,250 and closed at ₹31,595, up 10.68%, more than ₹1,200 above the upper band. Volume was 5.89 times its 20-day average. That put it near the top of the “Upper band breakout” tab, which is sorted by volume.
Prices are adjusted. The scanner uses NSE’s daily files adjusted for splits and bonuses, so a stock that split last month does not show a fake crash through the lower band. If your broker’s chart is not adjusted, older bands may look different from ours.
The three setups, and the two ways to read a breakout
| Setup | Rule | What it describes |
|---|---|---|
| Upper band breakout | Close above the upper band | An unusually strong close compared with the last 20 days. |
| Lower band break | Close below the lower band | An unusually weak close compared with the last 20 days. |
| Bollinger squeeze | Band width the narrowest of 120 sessions | Volatility at a six-month low: the stock has gone very quiet. |
Breakout or stretch?
Traders read a close outside the bands in two opposite ways, and both camps can point to examples:
- Momentum reading (“band walk”): a strong trend often hugs the upper band for days or weeks. A close above it is a sign of strength, and the trader rides it with a trailing stop.
- Mean-reversion reading (“stretch”): a close far outside the band is overextended, and price tends to drift back toward the 20-day average. The trader waits for the snap-back.
Our test further down shows which reading fitted NSE stocks better in the last two years. Spoiler: neither gave a dependable edge on its own.
Words you will meet
- Squeeze release: the first close outside the bands after a squeeze.
- Band expansion: the bands moving apart after a quiet phase, as volatility returns.
- %B: where the close sits inside the bands (0 = lower band, 1 = upper band). Not shown on this page, but many charting apps have it.
Why traders watch Bollinger signals: advantages and limits
✅ Self-adjusting
The bands widen for volatile stocks and tighten for calm ones, so “unusual” means unusual for that stock, not a fixed 3% or 5%.
✅ Whole market in one list
The scanner covers about 1,500 stocks, not just F&O names. On 13 Nov 2026 it found 86 upper band closes, 5 lower band closes and 13 squeezes.
✅ Ready context
Volume, RSI, distance from the 200-day average and other scans sit next to each name, so you can drop weak setups quickly.
✅ A volatility map
The squeeze tab is one of the few ways to find stocks that have gone unusually quiet across the whole market.
The limits: what our own test found
We rebuilt the scanner’s three lists for every session from 15 Jan 2025 to 13 Nov 2026 (452 sessions) for the 1,536 stocks in today’s list, using the same adjusted NSE data and the same formulas (Diwali Muhurat sessions left out), and measured the close-to-close return afterwards. “Beat the market” means the stock did better than the average of all stocks in the list over the same days.
| Setup | Cases | Higher next day | Higher after 5 sessions | Higher after 20 sessions | Median after 20 | Beat the market, 20 sessions |
|---|---|---|---|---|---|---|
| Close above upper band | 36,162 | 47.7% | 46.7% | 47.2% | −0.72% | 44.1% |
| …with volume 1.5× or more | 21,313 | 46.9% | 45.4% | 45.8% | −1.20% | 43.9% |
| Close below lower band | 36,231 | 50.2% | 50.6% | 49.3% | −0.15% | 45.0% |
| Bollinger squeeze | 16,456 | 44.0% | 42.0% | 39.4% | −2.05% | 40.9% |
| Any stock, any day | 607,552 | 46.9% | 46.8% | 46.8% | −0.74% | 43.4% |
In plain words:
- Closes outside the bands are not rare. The textbook says about 95% of closes fall inside. In our data 11.9% of all stock-days closed outside, because real prices jump more than the textbook maths assumes. On an average evening the scanner finds about 80 stocks above and 80 below.
- Upper band closes did not keep going on average. They were higher afterwards about as often as any stock. Heavy volume did not help; those cases did slightly worse. The day after, 59.4% traded above the breakout day’s high, but only 27.5% closed above it, and 48.3% closed back inside the bands.
- Lower band closes leaned slightly toward a bounce. They were higher after 1 and 5 sessions about 3 to 4 points more often than an ordinary day. That is a small mean-reversion lean, not a buy signal: half of them were still lower after 20 sessions.
- The squeeze reliably came before wider bands, not before bigger moves. Twenty sessions later the bands were wider in 89.3% of cases (median: almost double). But the biggest move within those 20 sessions was a median 10.5%, smaller than the 11.69% for any stock over the same period, and squeezed stocks were higher less often (39.4%).
- The squeeze gave no direction. The first close outside the bands came on the downside in 56.2% of squeezes and the upside in 40.2%. Ten sessions after an upside release, only 40.4% were higher.
Read this fairly. The test covers a period when the typical stock in the list fell (median −0.74% over 20 sessions), uses today’s list of stocks (which leaves out companies that dropped off and flatters the past), and ignores costs and slippage. Signals also bunch on the same days. So use the scanner as a watchlist with context, not as a signal.
A tour of the scanner screen
Open the Bollinger Band breakout scanner. At the top are the scan date and three tabs; below them the filters, then the results table and short explanation cards.

- 1Scan for: pick a scan date; the latest is first.
- 2Upper band breakout: closed above the upper band.
- 3Bollinger squeeze: narrowest bands in 120 sessions.
- 4Lower band break: closed below the lower band.
The number on each tab is how many stocks match after your filters. On 13 Nov 2026, a day when NIFTY 50 fell 0.61%, the upper band tab still had 86 names, because the list covers small and mid caps too, and many of them move on their own news.
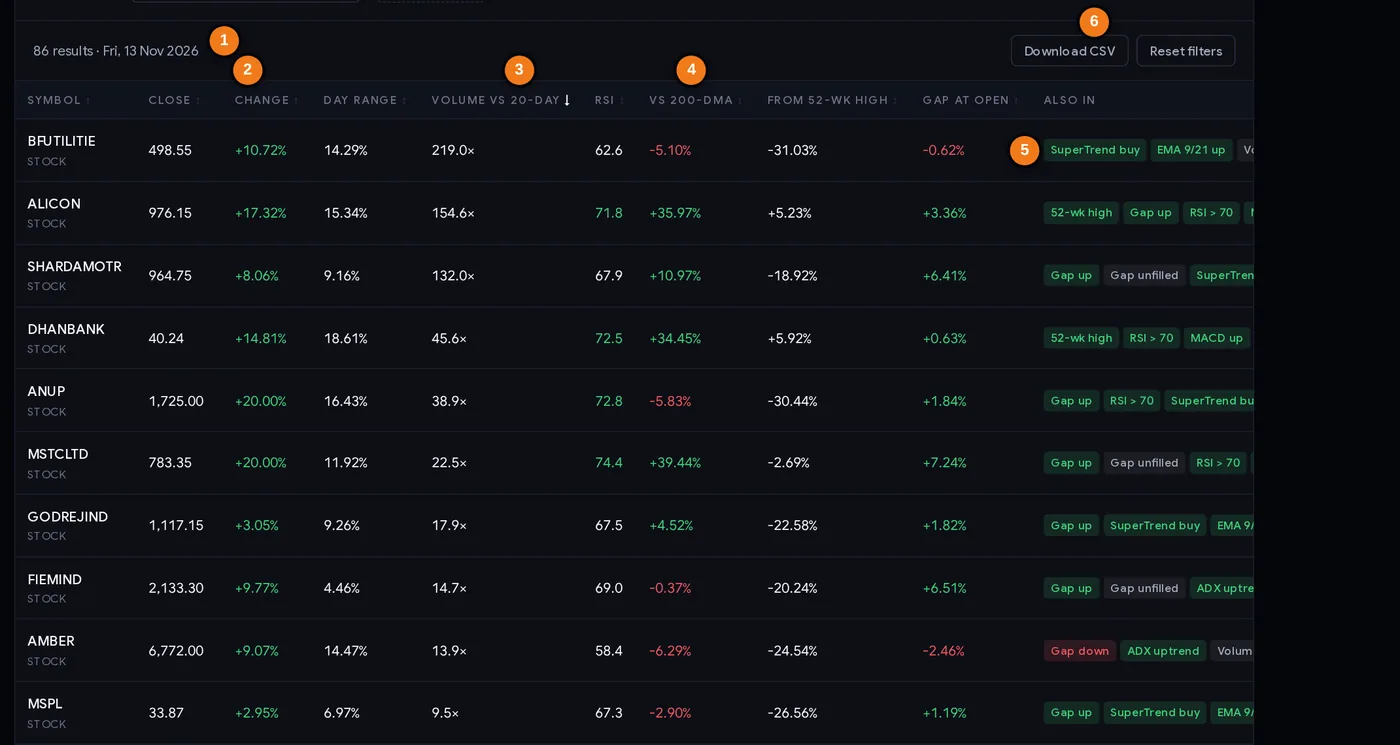
- 1Result count and scan date
- 2Change on the day
- 3Volume versus the 20-day average (the sort order)
- 4Distance from the 200-day average
- 5Other scans the stock matched today
- 6Download the list as CSV
Every column explained
| Column | What it tells you |
|---|---|
| Symbol | The NSE symbol. |
| Close / Change | The closing price and the % change from the previous close. |
| Day range | (High − Low) ÷ Close: how wide the day was. |
| Volume vs 20-day | Today’s volume divided by the 20-day average. The breakout tabs are sorted by this, highest first. |
| RSI | 14-day Relative Strength Index. Above 70 is called overbought, below 30 oversold. See the RSI tutorial. |
| vs 200-DMA | How far the close is above (+) or below (−) the 200-day average: the long-term trend. |
| From 52-wk high | How far below its 52-week high the stock closed. |
| Gap at open | Today’s open versus yesterday’s close. |
| Also in | Other scans the stock matched today, such as NR7, inside bar, SuperTrend, EMA or MACD crossover, volume spike. |
The table does not print the band values themselves. To see the bands, open the stock on your chart with Bollinger Bands (20, 2) switched on; they should match ours if your chart is split-adjusted.
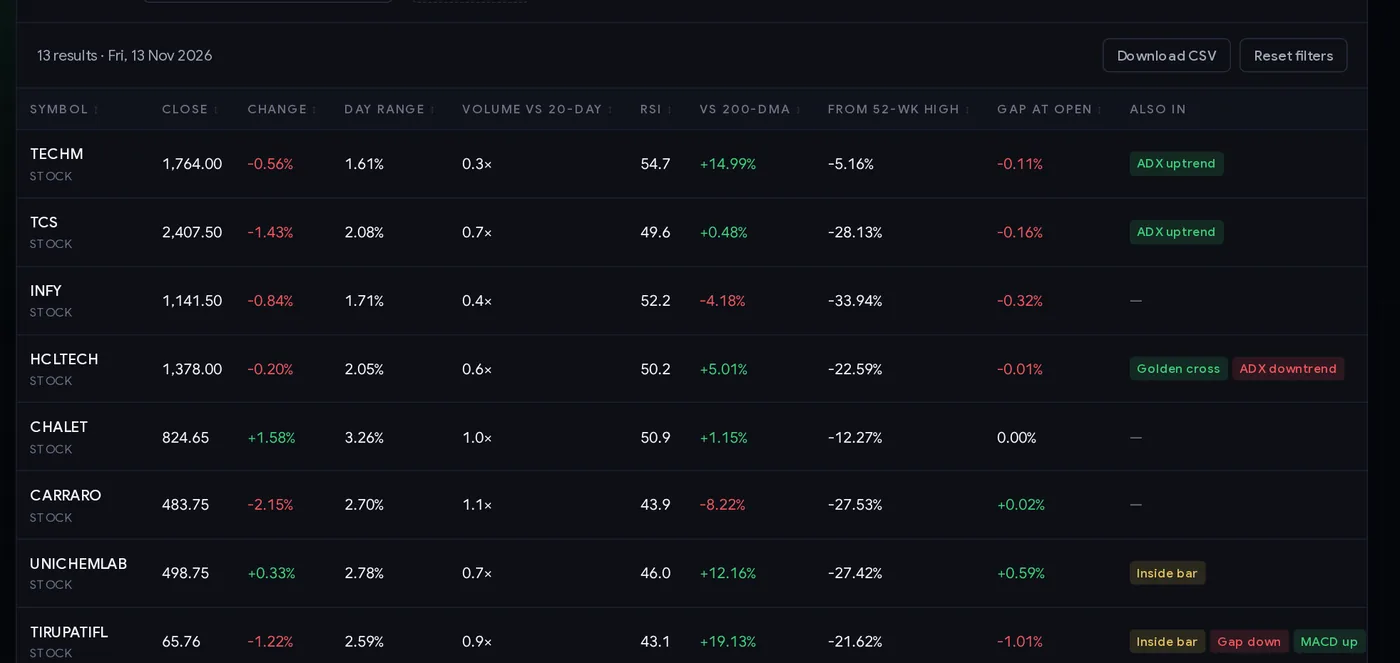
The Bollinger squeeze tab is sorted by band width, tightest first. Large, steady companies naturally have narrower bands, so blue chips can sit at the top of this list. On 13 Nov 2026 four of the thirteen squeezes were IT majors.
The filters
| Filter | What it does |
|---|---|
| Show | All, stocks or indices. |
| Today | Only stocks that closed up, or down. |
| Trend | Close above or below the 20-, 50- or 200-day average. |
| Combine with | Add a second setup: NR7, inside bar, near a 52-week high or low, gap up or down. |
| More filters | RSI band, volume (1.5×, 2×, 3× average), price band and sector. |
| Find / CSV / Reset | Jump to a symbol, download the filtered list, or clear the filters. |
Step by step: a 10-minute evening routine
- Open the scanner in the evening after NSE publishes its daily file, and check the date in the “Scan for” box.
- Read the tab counts. If the upper band tab is unusually full, the whole market had a strong day and single names are less special. The same goes for a crowded lower band tab after a sell-off.
- Pick one tab that fits your plan. Trend followers look at upper band closes above the 200-day average; swing traders hunting a bounce look at lower band closes; patient traders keep the squeeze list as a watchlist.
- Filter for liquidity. Many names in the full list are small companies. Use the price and sector filters, and check the turnover on the stock monitor before trading anything thin.
- Check why it moved. A 10% jump on results or a big order is a different story from a slow grind. Look at board meetings and the results calendar.
- Open the chart. Look at the bands, the 20-day average and the last swing high and low. Decide where you would be wrong.
- Write the plan for tomorrow: the trigger, the stop, and what you will do if the stock opens far away from today’s close.
- Size the trade with the position size calculator from the distance between entry and stop.
Three playbooks
Playbook A: riding a band walk
- Use only upper band closes in stocks already above their 200-day average.
- Do not chase the next morning. Our data showed the next day traded above the breakout high most of the time but closed above it only about a quarter of the time. Many traders wait for a pullback toward the upper band or a close above the breakout day’s high.
- Stop loss: below the breakout day’s low, or below the 20-day average for a wider swing trade.
- Trail the stop under the 20-day average while the stock keeps closing near the upper band. Exit when it closes below the middle band.
Playbook B: the snap-back from the lower band
Lower band closes leaned slightly toward a bounce in our test. Some swing traders use that, but only with strict rules: the stock should be above its 200-day average (a dip in an uptrend, not a collapse), there should be no bad news behind the fall, and they wait for a close back inside the band before acting. The stop goes below the low of the weak day; the first target is the 20-day average. In our data only about a third reached the middle band within 10 sessions, so this is a small, careful trade.
Playbook C: the squeeze watchlist
A squeeze tells you a stock has gone quiet, not which way it will move. Traders who use it note the band edges and wait for the release: a close outside the bands with volume. Because the first release went the wrong way often in our test, they keep the first position small and place the stop back inside the bands. Some traders skip direction altogether and use the squeeze list to avoid option selling in stocks that are coiled.
Always decide the loss first. Risk a small, fixed part of your capital per trade, for example 0.5%: with ₹3 lakh that is ₹1,500. If your stop is ₹15 away, the size is 100 shares, whatever the setup looks like.
Case studies from real NSE data
Five real examples from 2026, chosen to show the clean, the messy and the bad. Prices in ₹ from NSE’s daily files.
1. HCL Tech, 13 Oct 2026: a band walk that worked
HCLTECH jumped 8.42% from 1,223 to close at its high of 1,326, above its upper band of 1,307.43, on 7.8 times normal volume. TCS did the same that day (close 2,269.30 against an upper band of 2,241.52). The next day HCLTECH barely moved (1,327), but by 21 Oct it closed at 1,424.20, 7.41% above the breakout close, and it touched 1,469 within the next 20 sessions. On 11 Nov it was still at 1,395. A trader who waited for the quiet next day and held with a trailing stop did well.
2. BHEL, 14 Oct 2026: a breakout that reversed at once
BHEL rose 4.89% to close at its high of 464, above the upper band of 458.24, on 4 times normal volume. The next day it opened at 450.50, below the breakout close, and closed at 434.25 (−6.41%). By 22 Oct it was at 398.90, 14% below the breakout close. Lesson: a strong close on high volume did not stop a reversal. The stop below the breakout day’s low (439.15) would have been hit on day one.
3. ITC and Cholamandalam: two lower band closes, two outcomes
On 8 Oct 2026 ITC fell 4.03% to 255, just below its lower band of 255.21, on 3.4 times normal volume. The next day it closed at 266 (+4.31%), and by 6 Nov it was at 283.15. On 24 Sep 2026 CHOLAFIN fell 5.2% to 1,681.70, below its lower band of 1,717.12, on 3.3 times volume. It kept falling: 1,580 on 1 Oct and 1,447.90 on 26 Oct, 13.9% lower. Lesson: the same signal can mark the low or the start of a slide.
4. TCS and Tech Mahindra: squeezes that broke opposite ways
On 4 Sep 2026 TCS was in a squeeze with a band width of 8.85%, closing at 2,304. It broke down: 2,200.80 on 11 Sep and 2,100 on 6 Oct. On 5 Oct 2026 TECHM was in a squeeze (band width 5.38%) at 1,535.90. It first dipped to 1,471 by 12 Oct, then rallied to 1,789.10 by 3 Nov, 16.5% above the squeeze close. Lesson: the squeeze said “something is coming” in both cases, but not which way, and in TECHM’s case the first move was the wrong one.
5. The screen on 13 Nov 2026: IT goes quiet again
One month after the October breakouts, TCS, Infosys, HCL Tech and Tech Mahindra were all in the squeeze tab, on volume well below normal (0.33 to 0.71 times). TCS was even in two tabs at once: it closed at 2,407.50, just under its lower band of 2,420.56, with a band width of only 5.15%. Page Industries closed at 31,325, below its lower band of 32,081.74, on 8.83 times volume with RSI at 29.6. What happens next is not known yet; these are setups to study, with the rules and the risks above.
Common mistakes
- Treating an upper band close as a buy signal. In our test it was followed by a higher price no more often than any day.
- Treating a lower band close as “cheap”. The bounce lean was small, and many kept falling (Case 3).
- Expecting a squeeze to break upward. More squeezes broke down than up in our data.
- Chasing the next morning’s open. The day after a breakout often trades above the high and then closes below it.
- Ignoring the news. Results, orders and block deals cause many band breaks; the move after them follows the news, not the bands.
- Trading illiquid names from the full list. A ₹1 crore-a-day stock can gap through your stop.
- Changing the settings to fit a chart. Different settings give different lists. Use (20, 2) to match the scanner, or know why you changed it.
Pre-trade checklist
- The scan date is the latest session and the tab counts look normal for the market’s day.
- I know which reading I am trading: momentum (band walk) or snap-back.
- The trade agrees with the long-term trend (vs 200-DMA column).
- I checked the reason for the move: results, news, a block deal.
- The stock trades enough for my size.
- Entry trigger, stop and first target are written down.
- If it opens far from today’s close, I re-plan or skip.
- Position size comes from the stop distance; total risk within my daily limit.
Glossary
| Bollinger Bands (20, 2) | A 20-day average with bands 2 standard deviations above and below. |
| Middle band | The 20-day simple moving average of closes. |
| Standard deviation | A measure of how spread out the recent closes are. |
| Band width | (Upper − lower) ÷ middle, as a %. Small = quiet stock. |
| Squeeze | Band width at its narrowest of 120 sessions. |
| Release | The first close outside the bands after a squeeze. |
| Band walk | A trend that keeps closing near or outside one band. |
| Mean reversion | The tendency of a stretched price to move back toward its average. |
| Volume ratio | Today’s volume ÷ the 20-day average volume. |
| DMA | Daily moving average: the average close of the last N days. |
Questions
What is a Bollinger Band breakout?
A close above the upper Bollinger Band (20-day average plus 2 standard deviations) or below the lower band. ChartMine lists every actively traded NSE stock with such a close after each session, with volume, RSI and trend.
What is a Bollinger squeeze?
A stock whose band width is the narrowest of the last 120 sessions. It means volatility is at a six-month low. In ChartMine’s test the bands widened afterwards in 89.3% of cases, but the direction was unpredictable.
Is a close above the upper Bollinger Band bullish?
Not reliably on its own. In 36,162 cases from Jan 2025 to Nov 2026, the stock was higher 20 sessions later 47.2% of the time, against 46.8% for any stock on any day. Trend, news and risk control matter more.
Which Bollinger Band settings does the scanner use?
The standard 20-day simple moving average with bands at 2 standard deviations, on daily closes adjusted for splits and bonuses. Squeezes compare today’s band width with the previous 119 sessions.
Does a Bollinger squeeze break out upward or downward?
Either. In ChartMine’s test the first close outside the bands after a squeeze was on the downside in 56.2% of cases and the upside in 40.2%, so traders wait for the release and use a stop.
When is the Bollinger scanner updated?
Every trading day after NSE publishes its end-of-day file, in the evening. You can pick earlier scan dates from the date box as history builds up.
Can I use Bollinger Bands for intraday trading?
The scanner uses daily candles, so it suits next-day and swing planning. Intraday traders apply the same bands to 5- or 15-minute charts, which give different signals.