
☰ All tutorials
Start here
Tool tutorialsHow to trade with ChartMineStocks
Stock monitorMy watchlistStock scores & checklistMarket & sectors
Nifty 50Bank NiftySensexFin NiftyDaily market reportMarket breadthSector rotationSector heatmapStock screenerRelative strength (RS)MCX commodity pricesFear & Greed IndexWhat happens after…Scanners
Top gainers & losersStocks to watch tomorrowNR7 stocks scannerInside bar stocks52-week high stocksGap up & gap down stocksRSI oversold stocksGolden cross stocksSuperTrend buy stocksScan builderEMA 9/21 crossoverMACD crossoverADX strong trendBollinger breakout / squeezeVolume spike stocksOpen = high / open = lowCandlestick pattern scannerNarrow CPR scannerF&O data
F&O ban listOI build-upOption chainPCR & max painExpiry calendarF&O lot sizesOI build-up heatmapPCR trendMax pain trendFutures basisStock screens
Quarterly growersProfit growth stocksLow P/E stocksMutual fund buyingNear 52-week low, growingDebt-free companiesHigh ROE & ROCEMagic Formula stocksLow price-to-bookSmart money
FII / DII dataShareholding changesBig-money footprintShort selling dataF&O positions by participantBulk & block dealsPromoter buyingDelivery percentageCalendars
Results calendarQuarterly results trackerBoard meetingsCorporate actionsIPO calendarIPO performanceResearch & planning
Strategy testerCompare stocksDividend yield stocksASM / GSM listExpiry-day movesSeasonality & stock historyNSE holidays 2026Position size calculatorOption payoff calculatorPivot point calculatorMore
Stock scanners hubStock screensHow to read the option chain
A beginner’s guide to the option chain: what calls and puts are, every column of the chain explained with real NIFTY numbers, the summary figures (PCR, max pain, OI walls), what our data says about walls, and three case studies.
What an option chain is, in plain words
An option is a contract that gives its buyer a right, not an obligation:
- A call option (CE) gives the right to buy at a fixed price, the strike. It gains value when the price rises.
- A put option (PE) gives the right to sell at the strike. It gains value when the price falls.
The buyer pays a premium. The seller, called the writer, collects that premium and takes the risk. Every option also has an expiry, the last day it exists: NIFTY options expire weekly (Tuesday), stock options monthly (last Tuesday), with holiday shifts shown in the expiry calendar.
For one stock or index there are dozens of strikes, each with a call and a put. The option chain lays them all out in one table: calls on the left, puts on the right, strikes in the middle, sorted from low to high. For each strike you see the price of the option and how many contracts are open.
One line to remember: the option chain is a map of where option traders have placed their bets for one expiry. It shows where positions are concentrated, not where the price will go.
ChartMine’s option chain covers 224 F&O stocks and indices, built every evening from NSE’s end-of-day F&O file, with PCR, max pain and the biggest call and put positions already worked out.
The words you need to read a chain
| Term | Meaning, with a real NIFTY example (6 Nov 2026, 9 Nov expiry) |
|---|---|
| Strike | The price an option refers to. NIFTY strikes are 50 points apart: 24,950, 25,000, 25,050… |
| LTP (last price) | The option’s closing price, per unit. The 25,000 call closed at ₹169.40. |
| Lot size | Options trade in lots: 65 units for NIFTY. One lot of that call cost 65 × 169.40 = ₹11,011 in premium. |
| Open interest (OI) | Contracts still open at the close, shown in units (L = lakh, Cr = crore). The 25,000 call had 1.11 crore units open, about 1.7 lakh lots. |
| Change in OI | How much OI rose or fell today. Rising OI means new positions were opened; falling OI means positions were closed. |
| At the money (ATM) | The strike nearest the current price. With NIFTY at 25,030.35, that was 25,050 (the green row). |
| In the money (ITM) | An option that would be worth something if it expired now: calls below the price, puts above it. Shaded on the page. |
| Out of the money (OTM) | An option that would expire worthless at today’s price: calls above it, puts below it. |
| Intrinsic value | The in-the-money amount. The 24,450 call: 25,030.35 − 24,450 = 580.35. It closed at 577.60, almost exactly its intrinsic value, because only one session was left. |
What the at-the-money options tell you
Add the ATM call and put prices and you get the straddle: roughly the move the options market is pricing before expiry. On 6 Nov the 25,050 call (₹146.75) plus the 25,050 put (₹198.25) came to 345 points, about 1.4% of NIFTY, for one remaining session after a weekend.
The numbers built from the chain
The page summarises each chain with four figures and a short list of notes.
| Figure | How it is worked out | NIFTY, 6 Nov 2026 |
|---|---|---|
| PCR (OI) | Total put OI ÷ total call OI for this expiry | 1.65: more puts open than calls |
| Max pain | The expiry price at which all open options of this expiry would be worth the least | 24,700, 1.3% below spot |
| Call OI wall | The strike with the highest call OI | 26,000 |
| Put OI wall | The strike with the highest put OI | 24,000 |
| Most OI added | The strikes where call and put OI rose most today | Calls 26,000 (+44.34 L), puts 24,000 (+69.37 L) |
Why the walls are called resistance and support
Most index options are sold by large traders. Whoever sold the 26,000 calls loses if NIFTY expires above 26,000, so that strike is often read as a ceiling (resistance) the sellers would like to defend. Sellers of the 24,000 puts lose below 24,000, so that strike is read as a floor (support). These are descriptions of where risk sits, not physical barriers: the price can and does go through them (case study 3). The PCR & max pain tutorial explains PCR and max pain in more depth.
Why traders use the option chain: advantages and limits
✅ Positioning at a glance
See where the big call and put positions are, and where they were added or cut today.
✅ Option prices for planning
Premiums for every strike, so you can estimate the cost of a trade or a hedge before the market opens.
✅ The expected move
The ATM straddle gives a rough idea of how far the market thinks the price may travel by expiry.
✅ Every F&O stock
Not just NIFTY and BANK NIFTY: 224 underlyings, each on its own page with a chart of OI by strike.
The limits: what our data says
We checked where the expiry close landed against the call and put walls seen the day before, over 580 sessions from July 2024 to November 2026.
| Instrument | Expiry close between the put wall and the call wall | Typical distance between the walls |
|---|---|---|
| NIFTY, 122 expiries (walls from the day before) | 74% | about 4% of the price |
| NIFTY, same expiries, walls from 3 sessions before | 88% | about 7.7% |
| BANK NIFTY, 43 expiries (day before) | 86% | about 4.9% |
| F&O stocks, 5,811 monthly expiries (day before) | 60% | varies |
- Walls are wide. A band of 4% to 8% around the price contains the expiry close most of the time simply because it is wide. Staying inside does not prove the walls “held”.
- About one NIFTY expiry in four closed outside the walls seen the day before. On stocks, four in ten.
- End-of-day only. ChartMine’s chains come from NSE’s closing file. During the day, OI and prices change continuously; use your broker’s live chain for intraday decisions.
- OI does not show direction. Each open option has a buyer and a seller; we cannot see who is hedging and who is speculating.
So how should you use it? As a map of where option money sits, for planning levels and pricing trades. Pair it with the price chart, and manage every position with a stop loss or a defined maximum loss.
A tour of the option chain pages
Start at the option chain hub: one card per F&O underlying with its PCR and max pain, indices first, then stocks A to Z.
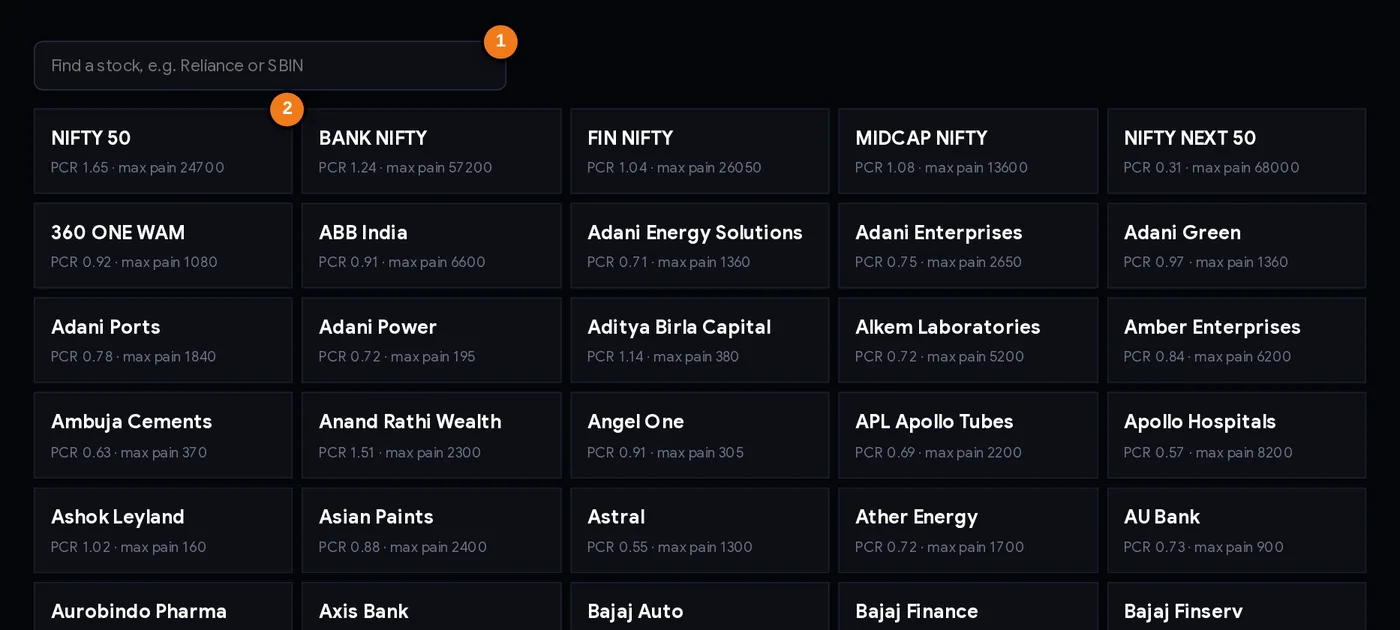
- 1Find a stock or index
- 2Each card shows PCR and max pain; click it to open the chain
Type a company name or symbol in the search box, or click a card, to open that underlying’s chain. The rest of this tour uses NIFTY.

- 1Spot: the closing price
- 2PCR: put OI ÷ call OI for this expiry
- 3Max pain and its distance from spot
- 4Call and put OI walls
The four boxes summarise the chain for the nearest expiry. The headline above them names that expiry and the date of the NSE file used.
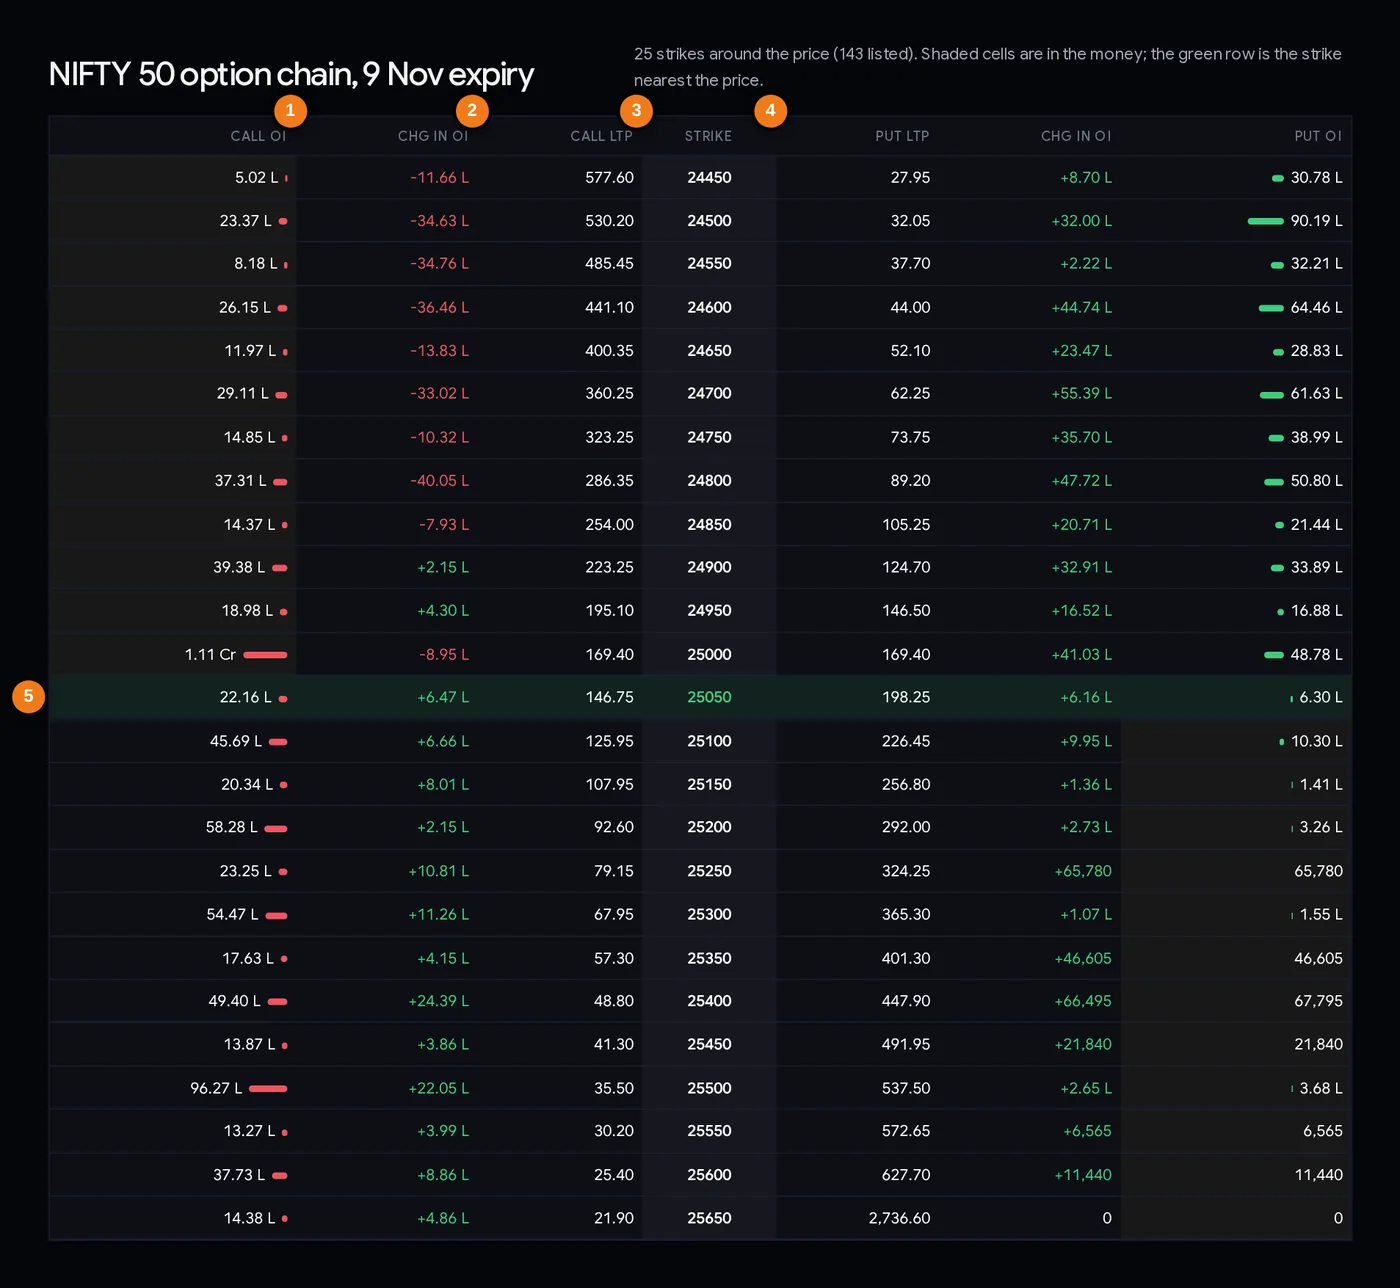
- 1Call open interest, with size bars
- 2Change in call OI today
- 3Call last price
- 4Strike
- 5Green row: the strike nearest the price
Every column explained
| Column | What it tells you |
|---|---|
| Call OI | Open call contracts at this strike (units), with a red bar for size. |
| Chg in OI (calls) | Today’s change in call OI. Green = added, red = cut. |
| Call LTP | The call’s closing price. |
| Strike | The strike price, low at the top, high at the bottom. |
| Put LTP / Chg in OI / Put OI | The same three figures for the put, mirrored on the right, with a green bar for size. |
| Shading and the green row | Shaded cells are in the money; the green row is the strike nearest the price. |
The page shows the 25 strikes around the price (NIFTY had 143 strikes listed for this expiry).
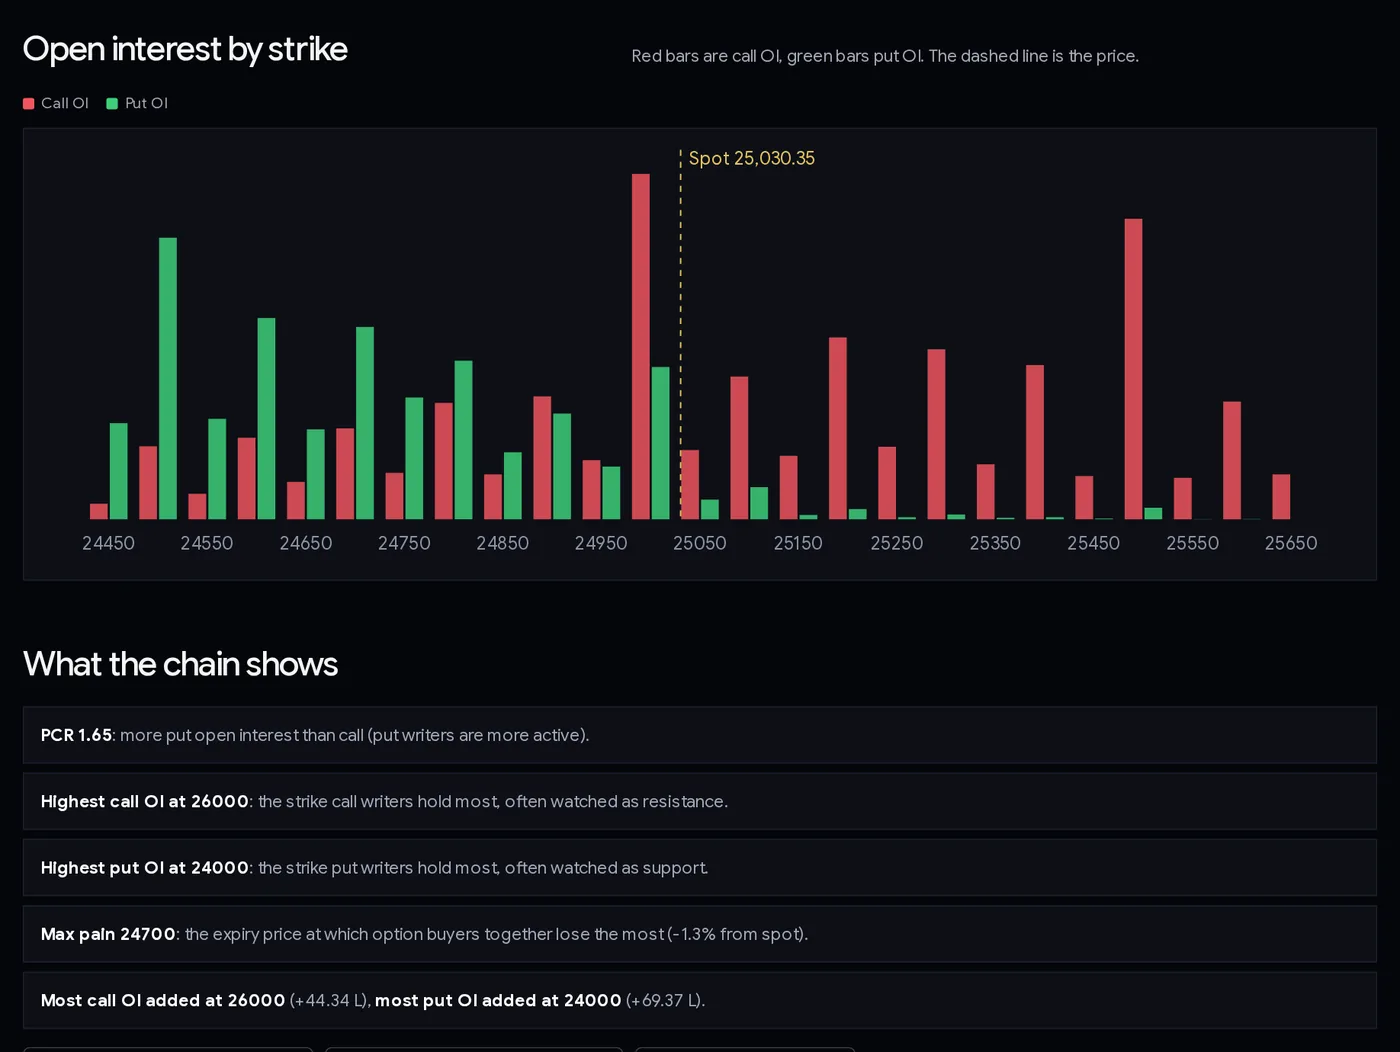
Below the table, the open interest by strike chart draws the same data as bars (red calls, green puts) with a dashed line at the price, and the notes spell out PCR, the walls, max pain and today’s biggest additions. Hover a bar to read its value.
Step by step: reading a chain in 10 minutes
- Check the expiry and the data date in the headline. Near expiry, options change fast.
- Find the green row (ATM). Note the ATM call and put prices; their sum is the straddle, the expected move.
- Find the biggest bars. Highest call OI above the price and highest put OI below it: these are the walls.
- Read the change in OI. Where were calls and puts added today, and where were they cut? Adding puts below the price while cutting calls near it (as on 6 Nov) shows writers moving up with a rising market.
- Glance at PCR and max pain for overall balance.
- Compare with the price chart. Do the walls line up with recent highs and lows? Levels that agree are more meaningful.
- Price any trade idea with real premiums and lot sizes in the option payoff calculator, and know the maximum loss before you place it.
Three playbooks
Playbook A: walls as a level map for the week
Write down the call wall, the put wall and the strikes where OI is growing fastest. Many traders treat a move towards a big call strike as a place to be careful with longs, and a move towards a big put strike as a place to be careful with shorts. A decisive close beyond a wall, especially with OI being cut there, often means the sellers are giving up. Use price confirmation, not the wall alone.
Playbook B: buying an option for a view, with known risk
If you have a directional view from your chart, the chain tells you what it costs. Compare the ATM option with one or two strikes out of the money: cheaper options need a bigger move to pay off. An option buyer’s maximum loss is the premium paid, so size the number of lots so that losing the whole premium is acceptable.
Playbook C: selling options with defined risk
Option sellers often place short strikes beyond the walls and buy further-out options as protection (a spread), so the worst case is capped. Our data says about one NIFTY expiry in four ends outside the previous day’s walls, so the protection is not optional. Model the trade in the option payoff calculator first.
Risk first. Options can lose their entire value quickly, and naked option selling can lose far more than the premium received. Decide your maximum loss before entering and size with the position size calculator.
Case studies from NIFTY’s chain
Real readings from ChartMine’s end-of-day history. Index values are closing levels.
1. 6 Nov 2026: writers moving up with a rally
NIFTY had risen from 22,749.75 on 27 Oct to 25,030.35 on 6 Nov. The 6 Nov chain for the 9 Nov expiry showed the footprint of that move: call OI was cut heavily at the strikes the market had just passed (24,500 −34.63 L, 24,600 −36.46 L, 24,800 −40.05 L), while put OI was added below the price (24,700 +55.39 L, 24,800 +47.72 L) and most of all at 24,000 (+69.37 L). Calls were added mainly at 26,000 (+44.34 L). In plain words: call sellers who had been caught by the rally closed out, and put sellers stepped in underneath, which is also why PCR had climbed to 1.65.
2. 3 Nov 2026 expiry: inside the walls, far from max pain
On 2 Nov NIFTY closed at 23,440.80. For the next day’s expiry the call wall was 24,000 and the put wall 23,000; max pain was 23,250. On expiry day NIFTY closed at 23,810.85: still inside the walls, but up 370 points and well away from max pain. Lesson: walls that are 1,000 points apart leave plenty of room for a big move.
3. 13 Oct and 15 Sep 2026: walls that broke
On 12 Oct NIFTY closed at 22,363.35 with the call wall for the next day’s expiry at 22,600. On 13 Oct it closed at 22,721.95, above the wall. On 11 Sep (the last session before the 15 Sep expiry; 14 Sep was a market holiday) the put wall was 23,300 with NIFTY at 23,398.10; on expiry day it closed at 23,118.60, below the wall. Lesson: the highest OI strike is where sellers have the most at stake, not a level the market must respect. Anyone short options at those strikes without protection took the full move.
Common mistakes
- Treating the walls as fixed support and resistance. About a quarter of NIFTY expiries closed outside the previous day’s walls.
- Reading a big OI number as bullish or bearish by itself. Every open option has a buyer and a seller.
- Ignoring the change in OI. Where positions are being added or cut today often says more than the totals.
- Using an end-of-day chain for intraday trading. Prices and OI change through the day.
- Forgetting the lot size. A ₹169 option is ₹11,011 per NIFTY lot of 65.
- Buying cheap far-OTM options as lottery tickets; most expire worthless.
- Selling options without a defined maximum loss.
Checklist before an options trade
- I know the expiry date and how many sessions are left.
- I have found the ATM strike and the straddle (expected move).
- I know the call wall, the put wall and where OI was added or cut today.
- My idea comes from the price chart; the chain is context.
- I have priced the trade with real premiums and the correct lot size.
- I know my maximum loss and it is acceptable.
- No results or big event before expiry, or I have planned for it.
- For intraday decisions, I will check a live chain from my broker.
Glossary
| Option chain | The table of all calls and puts for one underlying and one expiry, by strike. |
| Call (CE) / Put (PE) | Right to buy / right to sell at the strike until expiry. |
| Strike | The price an option refers to. |
| Premium / LTP | The option’s price per unit; LTP is the last (closing) price. |
| Open interest (OI) | Contracts still open at the close. |
| ATM / ITM / OTM | At, in or out of the money, relative to the current price. |
| Intrinsic value | What an option is worth if exercised now. |
| Straddle | ATM call plus ATM put; a rough measure of the expected move. |
| OI wall | The strike with the most call OI (above the price) or put OI (below it). |
| Option writer | The seller of an option, who collects the premium and carries the risk. |
Questions
How do I read an option chain?
Calls are on the left, puts on the right and strikes in the middle. For each strike, look at open interest (how many contracts are open), the change in open interest today, and the last price. The strike nearest the price is at the money; the strikes with the highest call and put OI are often watched as resistance and support.
What is the NIFTY option chain?
The list of NIFTY call and put options for one expiry, by strike, with open interest, change in OI and price. ChartMine’s NIFTY page shows the nearest weekly expiry from NSE’s end-of-day data.
What does change in OI mean in an option chain?
How many contracts were added (positive) or closed (negative) at that strike today. Adding OI means new positions; cutting OI means positions were closed.
Is the highest call OI strike always resistance?
No. It is where call sellers have the most at stake, so it is often watched as resistance, but the price can break through. In ChartMine’s data about one NIFTY expiry in four closed outside the previous day’s highest call and put OI strikes.
Is ChartMine’s option chain live?
No. It is built every evening from NSE’s end-of-day F&O file. For intraday trading, use your broker’s live option chain.
What is an at-the-money option?
The option whose strike is nearest the current price. On 6 Nov 2026, with NIFTY at 25,030.35, the at-the-money strike was 25,050.
How much does one NIFTY option lot cost?
Premium × lot size. With NIFTY’s lot size of 65, the 25,000 call at ₹169.40 on 6 Nov 2026 cost about ₹11,011 per lot.