
☰ All tutorials
Start here
Tool tutorialsHow to trade with ChartMineStocks
Stock monitorMy watchlistStock scores & checklistMarket & sectors
Nifty 50Bank NiftySensexFin NiftyDaily market reportMarket breadthSector rotationSector heatmapStock screenerRelative strength (RS)MCX commodity pricesFear & Greed IndexWhat happens after…Scanners
Top gainers & losersStocks to watch tomorrowNR7 stocks scannerInside bar stocks52-week high stocksGap up & gap down stocksRSI oversold stocksGolden cross stocksSuperTrend buy stocksScan builderEMA 9/21 crossoverMACD crossoverADX strong trendBollinger breakout / squeezeVolume spike stocksOpen = high / open = lowCandlestick pattern scannerNarrow CPR scannerF&O data
F&O ban listOI build-upOption chainPCR & max painExpiry calendarF&O lot sizesOI build-up heatmapPCR trendMax pain trendFutures basisStock screens
Quarterly growersProfit growth stocksLow P/E stocksMutual fund buyingNear 52-week low, growingDebt-free companiesHigh ROE & ROCEMagic Formula stocksLow price-to-bookSmart money
FII / DII dataShareholding changesBig-money footprintShort selling dataF&O positions by participantBulk & block dealsPromoter buyingDelivery percentageCalendars
Results calendarQuarterly results trackerBoard meetingsCorporate actionsIPO calendarIPO performanceResearch & planning
Strategy testerCompare stocksDividend yield stocksASM / GSM listExpiry-day movesSeasonality & stock historyNSE holidays 2026Position size calculatorOption payoff calculatorPivot point calculatorMore
Stock scanners hubStock screensHow to use the F&O ban list
A plain-language guide to the NSE F&O ban: futures, options and open interest for beginners, the market-wide position limit and its 95% / 80% rule, a tour of every part of the ban list, and real ban spells from autumn 2026.
What the F&O ban list is, in plain words
About 220 NSE stocks can be traded in the F&O segment (futures and options) as well as in the normal cash market. In F&O you do not buy the share itself. You take a contract whose value moves with the share price, and you only put up a margin, a fraction of the full value. That makes it possible to build very large positions in a stock with relatively little money.
To stop any one stock from becoming dangerously crowded, the exchange sets a ceiling on the total positions that all traders together can hold in that stock’s futures and options. This ceiling is called the market-wide position limit (MWPL).
- When the open positions cross 95% of the MWPL, the stock enters the F&O ban period.
- During the ban, nobody may open fresh positions in that stock’s futures or options. You may only reduce or close what you already hold.
- The stock leaves the ban only when the open positions fall back below 80% of the MWPL.
The ban affects only the F&O contracts. Buying or selling the share in the cash market (delivery or intraday) carries on normally.
One line to remember: the ban list tells you which stocks have so many open bets on them that the exchange has closed the door to new ones. It is a crowding warning, not a buy or sell signal.
The F&O ban list shows the stocks in the ban for the next trading day, how many days each has been in it, the stocks close to the limit, and every F&O stock’s MWPL use, refreshed each evening from NSE’s own files.
The F&O words you need first
If you are new to derivatives, these six ideas are enough to read the ban list (and every other F&O tool on ChartMine).
| Term | What it means in simple words |
|---|---|
| Futures | An agreement to buy or sell a fixed quantity of a stock at today’s agreed price on a future date (the expiry). If the share rises, the buyer of the future gains and the seller loses, and the reverse. |
| Options | A call gives the buyer the right (not the duty) to buy at a fixed price (the strike); a put gives the right to sell. The buyer pays a premium; the seller (writer) collects it and takes the risk. |
| Lot size | Contracts are traded only in fixed bundles of shares, e.g. 750 shares of SBI per lot. See F&O lot sizes. |
| Expiry | The day a contract ends. Stock F&O expires once a month, on the last Tuesday (moved earlier for holidays). See the expiry calendar. |
| Open interest (OI) | The number of contracts that are still open, i.e. not yet closed or expired. Every open contract has one buyer and one seller, so OI measures how many bets are outstanding, not who is winning. |
| MWPL | The exchange’s ceiling on the total open interest in a stock’s futures and options, published every day for each F&O stock. |
Options and futures behave differently, so NSE converts the open option positions into a future-equivalent OI (an option that moves half as much as the share counts roughly as half a future). The ChartMine “MWPL used” figure is that future-equivalent OI divided by the MWPL, exactly as reported in NSE’s daily file.
How a stock enters and leaves the ban (the 95% / 80% rule)
The rule has a gap between the entry level and the exit level on purpose. Without it, a stock hovering around 95% would flip in and out of the ban every day.
| MWPL used | Status | What you can do in F&O |
|---|---|---|
| Below 60% | Open, not crowded | Trade normally. |
| 60% to 80% | Open, getting crowded | Trade normally; the tool’s “60%+ of MWPL” filter flags these. |
| 80% to 95% (not yet banned) | Near ban | Trade normally, but a few busy sessions can push it into the ban. |
| Crosses 95% | In ban from the next trading day | Only reduce or close existing positions. |
| Already in ban and still 80% or more | Stays in ban | Still only reduce or close. |
| Falls below 80% | Leaves the ban from the next trading day | Normal trading resumes. |
A real example of the gap: SAIL in October 2026
From NSE’s daily files (as shown on the ban list):
- 7 Oct: SAIL at 80.6% of its MWPL. Still above 80%, so it stayed in the ban.
- 8 Oct: it slipped below 80% and was released for the next session.
- 9, 12, 13 Oct: positions built up again: 87.2%, 92.5%, 94.3%. Not banned yet, because the entry level is 95%.
- 14 Oct: 95.0%. Back in the ban from the next session, where it stayed until early November.
- 4 Nov: 80.5%, still in the ban. 5 Nov: below 80%, released.
So a stock at 85% can be either “in ban” or “near ban”, depending on where it came from. The table’s Status column always tells you which.
Expiry day is special. On the monthly expiry, the expiring contracts disappear and their open interest with them. A stock can drop out of the ban on expiry day and jump straight back the next day once traders open positions in the new month. KAYNES did exactly that on 27 and 28 Oct 2026 (case study 3 below).
Why traders watch the ban list: advantages and limits
✅ Avoids nasty surprises
If you hold futures or options in a stock that enters the ban, you cannot add to the position or roll it freely. Knowing a day ahead lets you plan.
✅ A crowding gauge
MWPL use shows how packed a stock’s derivatives are compared with what the exchange allows. Crowded trades can unwind suddenly.
✅ Explains odd volumes
During a ban, F&O volume collapses. On 6 Nov 2026, KAYNES (in the ban) traded just 117 futures contracts; on 28 Oct, the day before its ban began, it traded 23,009. Liquidity is thin.
✅ Official data
The ban status comes straight from NSE’s list for the next trade date, not from an estimate.
The limits (please read this part)
- No direction. A ban says many positions are open. It does not say whether the crowd is long or short: every open contract has a buyer and a seller. Use the OI build-up page to see whether new positions came with rising or falling prices.
- Small, repeating cast. In the 42 sessions we checked (7 Sep to 6 Nov 2026) only seven different stocks were in the ban: INOXWIND, KAYNES, LICHSGFIN, SAIL, MANAPPURAM, BANDHANBNK and AMBUJACEM. The same few names keep returning.
- No reliable price pattern. In that period the share price moved in both directions during ban spells: AMBUJACEM fell about 3.7% from the day it entered to the day it left, SAIL rose about 1.4% during its spell from 15 Oct to 5 Nov, and KAYNES rose 3.0% in its latest spell to 6 Nov. Seven stocks and a couple of months are far too few to call it a pattern either way, and we do not.
- End-of-day only. NSE publishes the MWPL file after the close. The list is for the next day; it cannot show what happens during the session.
How to use it: as a risk filter for your own F&O positions and a watchlist of crowded stocks. Any trade idea still needs its own reason, a stop loss and a position size you can afford to lose.
A tour of the ban list screen
Open the F&O ban list. The page has three parts: the ban and near-ban cards at the top, the filters, and the full table of every F&O stock.
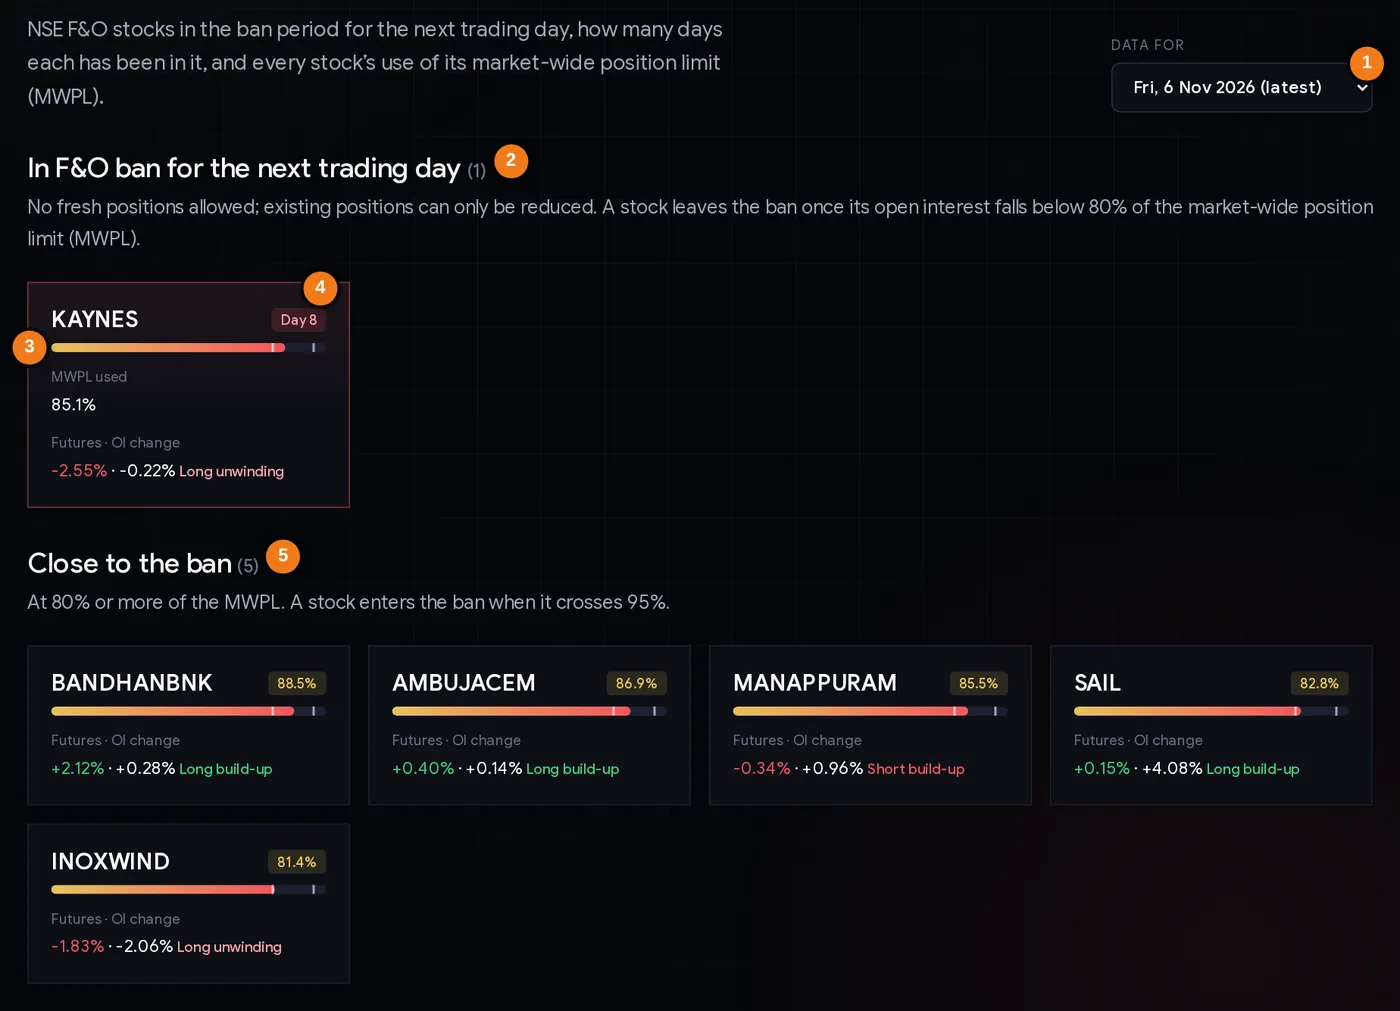
- 1Data for: pick any of the last 30 sessions.
- 2Stocks in the ban for the next trading day.
- 3MWPL bar: fills as the limit is used; the ticks mark 80% and 95%.
- 4Days in a row on the ban list.
- 5Stocks at 80% or more of the MWPL that are not banned.
The red card is a stock already in the ban. The badge (“Day 8”) counts how many trading days in a row it has been there; KAYNES had been on NSE’s list every evening since 28 Oct when this picture was taken. The bar under each name fills up as the MWPL is used; the two small ticks on the bar mark 80% and 95%. The near-ban cards also show what the futures did that day (price change, OI change and the build-up label).
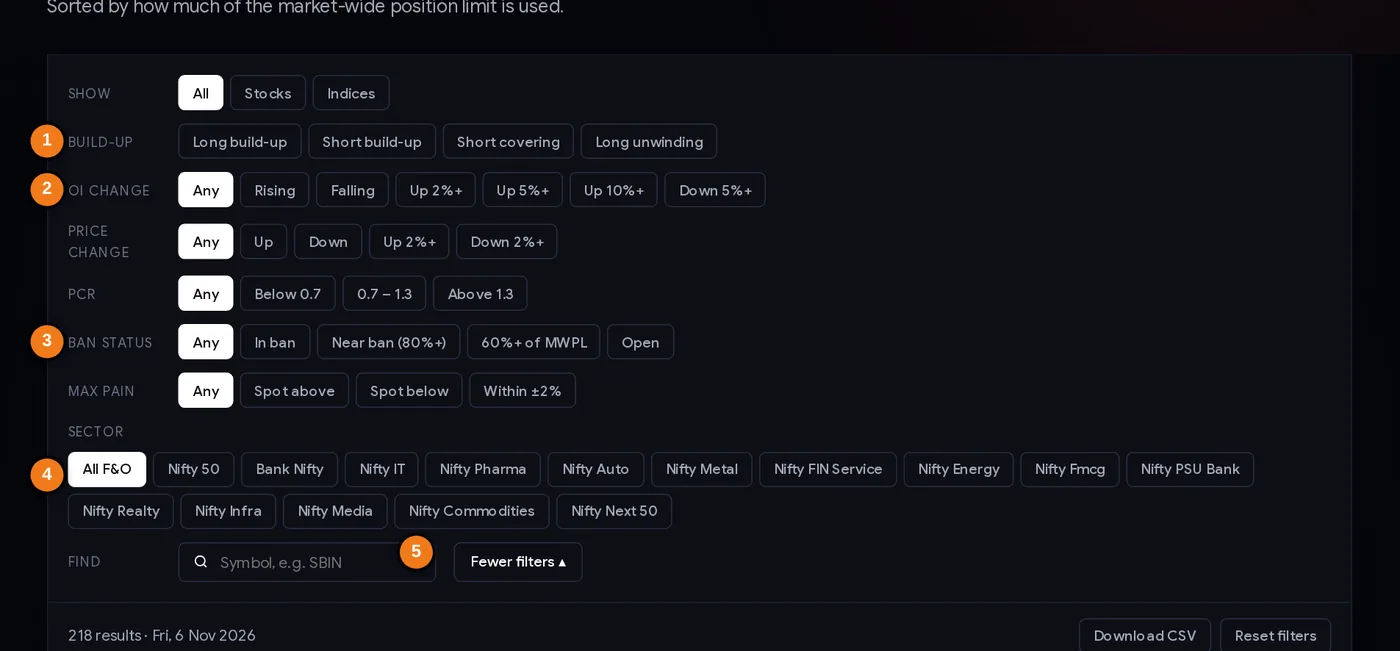
- 1Build-up type (tick one or more)
- 2Today’s OI change
- 3Ban status: in ban, near ban, 60%+ of MWPL, open
- 4Sector
- 5Find a symbol
The filters, from top to bottom
- Show: all, stocks only or indices only (indices are never banned; they appear for the build-up and PCR columns).
- Build-up: long build-up, short build-up, short covering, long unwinding. You can tick more than one.
- OI change and Price change: for example “Up 5%+” to see where positions grew fastest today.
- More filters opens PCR, Ban status (In ban, Near ban 80%+, 60%+ of MWPL, Open), Max pain and Sector.
- Find: type a symbol. Download CSV saves the filtered list; Reset filters clears everything.
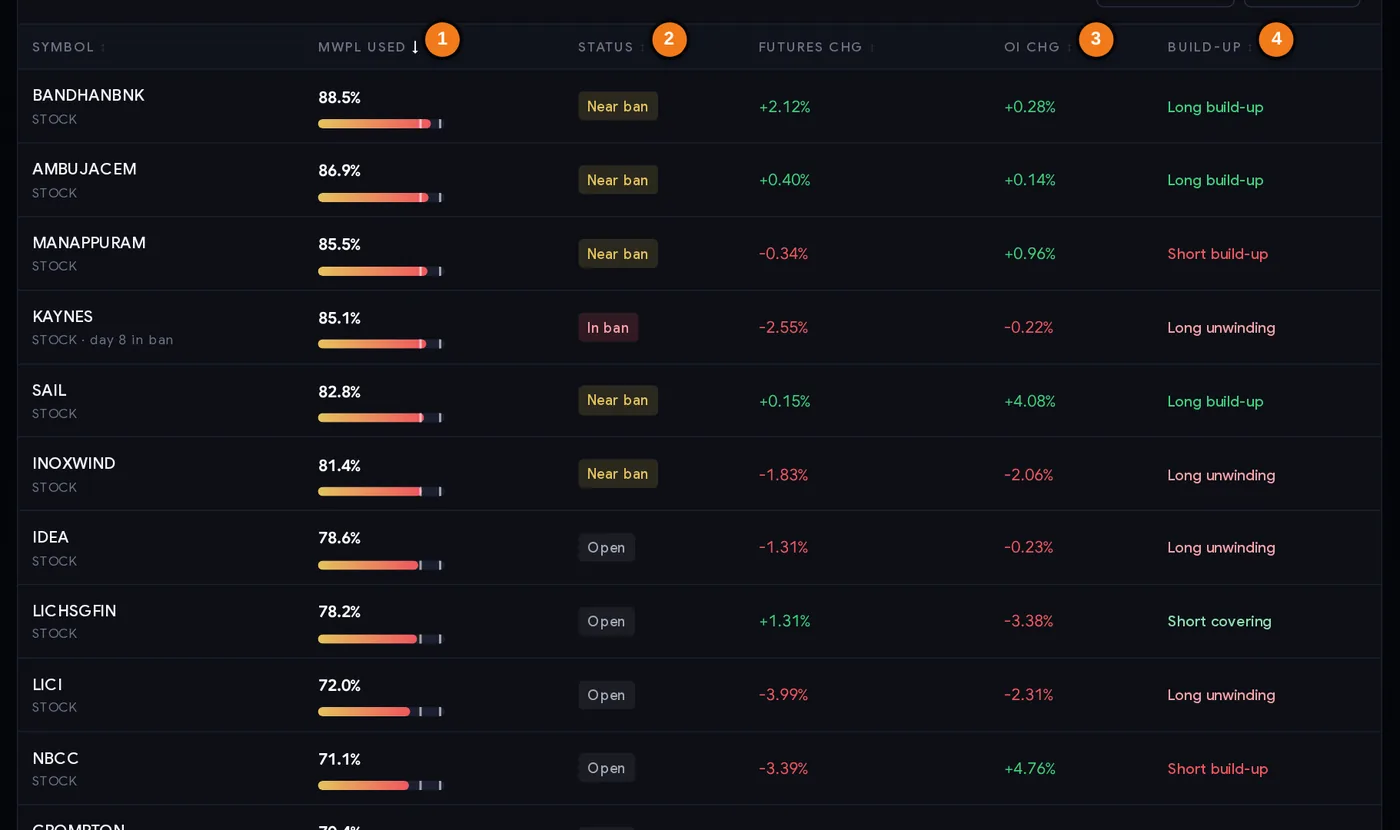
- 1MWPL used, with the 80% and 95% ticks
- 2Status: In ban, Near ban or Open
- 3Today’s futures OI change
- 4Build-up label
Every column explained
| Column | What it tells you |
|---|---|
| Symbol | The NSE symbol. Under it: stock or index, and for banned stocks “day N in ban”. |
| MWPL used | Future-equivalent open interest as a % of the market-wide position limit, with the 80% and 95% ticks. The table is sorted by this column by default; click any header to sort by it. |
| Status | In ban (NSE’s list for the next trading day), Near ban (80% or more, not banned) or Open. |
| Futures chg | Today’s % change in the near-month futures price. |
| OI chg | Today’s % change in futures open interest, summed across all expiries so that rolling from one month to the next does not look like new positions. |
| Build-up | Price and OI together: long build-up (price up, OI up), short build-up (price down, OI up), short covering (price up, OI down), long unwinding (price down, OI down). |
The Data for box at the top lets you go back to any of the last 30 sessions, which is how the case studies below were checked.
Step by step: a 5-minute evening check
- After about 7 PM, open the ban list. NSE posts its F&O files in the evening; the page updates once they are out. Check the date in “Data for”.
- Read the red cards. These stocks are in the ban tomorrow. If you hold their futures or options, decide tonight whether you will hold, reduce or exit, because you cannot add tomorrow.
- Read the near-ban cards. Anything above about 90% can enter the ban after one busy session.
- Check the direction of today’s positions. The build-up label on each card tells you whether the new positions came with a rising price (long build-up) or a falling one (short build-up).
- Check your own watchlist. Type each F&O stock you trade into Find, or filter Ban status → 60%+ of MWPL to see everything that is getting crowded.
- Look at the calendar. Monthly expiry can release stocks from the ban (see the expiry calendar), and results days can cause sharp moves in crowded stocks (see results moves).
- Write down your plan for any stock you still want to trade: why, where you are wrong, and how much you can lose.
Three ways traders use the ban list
Playbook A: protect your open positions
This is the main use. If a stock you hold in F&O moves above about 85% to 90% of its MWPL, plan as if it will enter the ban: you may not be able to add, average or roll freely, and option liquidity can dry up, which widens the gap between buying and selling prices. Many traders prefer to close or roll before the ban rather than during it.
Playbook B: trade the cash market instead
A ban does not stop you from buying or selling the share itself. A trader who has a separate, well-defined reason to trade a banned stock can use the cash market, with a stop loss, and accept that the position size will be smaller because there is no leverage. The ban itself is not the reason for the trade.
Playbook C: watch for the release, but do not guess the direction
When a stock leaves the ban, traders who were waiting can open positions again, and volume returns. Some traders keep such stocks on a watchlist for the first sessions after release. Look at what positions are being built (the OI build-up and the build-up heatmap) before forming a view, and remember case study 3: the release can be brief.
Position size first. Crowded stocks can move sharply. Decide how much of your capital you are willing to lose on one idea (for example 0.5% to 1%), then use the position size calculator with your entry and stop to get the quantity.
Case studies from the last 42 sessions
Three real ban spells from September to November 2026, from the ban list’s own history and NSE closing prices. Prices in ₹.
1. Ambuja Cements: from 81% to banned in one session
On 30 Sep 2026 Ambuja Cements used 80.9% of its MWPL. On 1 Oct it was 96.7%, so NSE put it in the ban from the next trading day (2 Oct was a holiday, so from 5 Oct). It then appeared in the ban list every evening until 26 Oct, sixteen sessions in all, with MWPL use slowly easing from about 97% to 86%. It was released only on the monthly expiry, 27 Oct, when the October contracts expired.
The share price meanwhile: ₹362.25 on 1 Oct, a low close of ₹341.00 on 8 Oct, ₹368.00 on 26 Oct and ₹348.80 on expiry day. After release it climbed to ₹390.60 by 6 Nov. Lesson: a stock can stay banned for weeks, its price can swing both ways during that time, and expiry is often what finally releases it.
2. SAIL: in, out and back in
SAIL was in the ban for most of September and October. As described above, it fell below 80% on 8 Oct and was released, rebuilt to 95.0% by 14 Oct and was banned again from 15 Oct, then stayed until it dropped below 80% on 5 Nov. On 6 Nov it was back to “near ban” at 82.8%, with futures OI up 4.08% that day. Lesson: leaving the ban does not mean the crowd has gone. Watch the MWPL figure, not just the status.
3. KAYNES: the expiry-day release that lasted one session
KAYNES was the most persistent name on the list. On 22 Sep its MWPL use read 108.4% on a day the share fell from ₹3,650 to ₹3,455. A figure above 100% is possible because existing positions are not forced to close, and a big price move changes the future-equivalent value of the open options.
In late October it was in the ban until monthly expiry. On 27 Oct (expiry day) the October contracts expired and it dropped out of the list. On 28 Oct traders opened fresh November positions: futures OI jumped 46.5%, the share fell 6.3% (₹3,350.40 to ₹3,140.00), and MWPL use hit 95.7%. It was back in the ban the next day and was still there on 6 Nov (day 8, at 85.1%, above the 80% exit level), with the share at ₹3,233. Lesson: an expiry-day release can be very short. A stock that is crowded the day before expiry is often crowded again the day after.
Common mistakes
- Reading the ban as bullish or bearish. It only says “many open positions”. Check the build-up for direction.
- Holding a large F&O position into a ban without a plan. You lose flexibility: no adding, harder rolling, thinner option markets.
- Opening a fresh F&O position in a banned stock. New positions that increase open interest are not allowed and attract a penalty from the exchange.
- Thinking a stock below 95% is safe from the ban. A stock already in the ban stays there until it falls below 80%.
- Assuming the expiry-day release is permanent. See KAYNES on 28 Oct 2026.
- Forgetting the cash market is open. The ban does not stop share trading; price moves continue.
- Using an old list. Always check the “Data for” date. The list is for the next trading day only.
Checklist before trading a crowded stock
- The “Data for” date is the latest trading day.
- I know the stock’s MWPL use and whether it is In ban, Near ban or Open.
- If it is above about 85%, I have a plan for the ban (hold, reduce or exit).
- I have checked the build-up: are new positions being added with a rising or a falling price?
- I know the next expiry date and any results or board meeting this week.
- My idea has its own reason; “it is in the ban” is not a reason.
- Stop loss and position size decided before entry.
- For a banned stock, I will use only the cash market or reduce existing F&O positions.
Glossary
| F&O | Futures and options: derivative contracts on a stock or index, traded in lots with margin. |
| Open interest (OI) | The number of contracts still open at the end of the day. |
| MWPL | Market-wide position limit: the exchange’s ceiling on total open interest in a stock’s F&O. |
| Future-equivalent OI | Open interest with options converted into an equivalent number of futures, used for the MWPL calculation. |
| Ban period | The days when a stock’s F&O open interest is above the limit: no fresh positions, only reductions. |
| Near ban | On ChartMine: 80% or more of the MWPL used, but not in the ban. |
| Days in ban | How many trading days in a row the stock has been on NSE’s ban list. |
| Expiry | The last day of a contract. Stock F&O expires monthly. |
| Rollover | Closing a position in the expiring month and opening the same position in the next month. |
| Build-up | Price change and OI change read together: long build-up, short build-up, short covering, long unwinding. |
Questions
Which stocks are in the F&O ban today?
The F&O ban list page shows NSE’s list of stocks in the ban period for the next trading day, updated every trading evening once NSE posts its files. On 6 Nov 2026, for example, only KAYNES was in the ban, on its eighth day.
What is MWPL in the F&O ban?
MWPL is the market-wide position limit: the maximum open interest allowed across all traders in a stock’s futures and options. When the future-equivalent open interest crosses 95% of the MWPL, the stock enters the ban.
When does a stock come out of the F&O ban?
When its open interest falls below 80% of the MWPL. A stock already in the ban stays there while it is between 80% and 95%, which is why some stocks remain banned for many days. Monthly expiry often releases stocks because the expiring contracts disappear.
What happens if I hold a position when a stock enters the ban?
You can keep it, reduce it or close it, but you cannot add to it. New positions that increase open interest attract a penalty from the exchange.
Is a stock in the F&O ban bullish or bearish?
Neither by itself. The ban only shows that many positions are open; every contract has a buyer and a seller. Check the OI build-up to see whether new positions came with rising or falling prices.
Why can MWPL used show more than 100%?
Existing positions are not forced to close when a stock is banned, and a large price move changes the future-equivalent value of open options. KAYNES showed 108.4% on 22 Sep 2026.