
☰ All tutorials
Start here
Tool tutorialsHow to trade with ChartMineStocks
Stock monitorMy watchlistStock scores & checklistMarket & sectors
Nifty 50Bank NiftySensexFin NiftyDaily market reportMarket breadthSector rotationSector heatmapStock screenerRelative strength (RS)MCX commodity pricesFear & Greed IndexWhat happens after…Scanners
Top gainers & losersStocks to watch tomorrowNR7 stocks scannerInside bar stocks52-week high stocksGap up & gap down stocksRSI oversold stocksGolden cross stocksSuperTrend buy stocksScan builderEMA 9/21 crossoverMACD crossoverADX strong trendBollinger breakout / squeezeVolume spike stocksOpen = high / open = lowCandlestick pattern scannerNarrow CPR scannerF&O data
F&O ban listOI build-upOption chainPCR & max painExpiry calendarF&O lot sizesOI build-up heatmapPCR trendMax pain trendFutures basisStock screens
Quarterly growersProfit growth stocksLow P/E stocksMutual fund buyingNear 52-week low, growingDebt-free companiesHigh ROE & ROCEMagic Formula stocksLow price-to-bookSmart money
FII / DII dataShareholding changesBig-money footprintShort selling dataF&O positions by participantBulk & block dealsPromoter buyingDelivery percentageCalendars
Results calendarQuarterly results trackerBoard meetingsCorporate actionsIPO calendarIPO performanceResearch & planning
Strategy testerCompare stocksDividend yield stocksASM / GSM listExpiry-day movesSeasonality & stock historyNSE holidays 2026Position size calculatorOption payoff calculatorPivot point calculatorMore
Stock scanners hubStock screensHow to use the open high low scanner
A plain-language tutorial on open = high and open = low days: the exact rule, how this end-of-day list differs from the intraday scan many traders know, how to read every part of the screen, what our own 22-month test found, and three playbooks with real case studies.
What open = high and open = low mean, in plain words
Every trading day a stock has four official prices: the open (the first price), the high, the low and the close. Usually the open sits somewhere in the middle of the day’s range. Sometimes it sits at one end.
- Open = high: the first price of the day was also the highest. Buyers never managed to push the stock above where it opened. Sellers were in charge from the first minute.
- Open = low: the first price was also the lowest. Sellers never pushed it below the open. Buyers were in charge from the first minute.
In Indian trading circles this is called the “open high low” strategy, and many intraday traders check it every morning. The idea is simple: if a stock opens at its low and never looks back, buyers are strong that day, and the reverse for open = high.
Important: this page is end-of-day, not intraday. The intraday version is checked in the first 15 to 30 minutes, when the high or low may still change. The open high low scanner uses NSE’s official prices for the whole session, after the close. A stock appears here only if the open held as the high (or the low) all day, until 3:30 PM. So the list tells you how the whole day played out, and it is useful for reviewing the day and planning the next one, not for entering a trade at 9:30 AM.
The scanner checks about 1,500 actively traded NSE stocks, not just F&O names, and shows the day’s move, volume, trend and other setups next to each one.
The exact rule (with real examples)
Prices on an exchange move in small steps called ticks, and the high is often a paisa or two away from the open even when the stock really did open at its high. So the scanner allows a tiny tolerance:
- Open = high if the open and the day’s high are within ₹0.05 or 0.02% of the open, whichever is larger.
- Otherwise, open = low if the open and the day’s low are within the same tolerance.
- The day must have some range (high above low). A stock that did not move at all is skipped.
For a ₹500 stock the tolerance is ₹0.10; for a ₹5,000 stock it is ₹1. The open used is NSE’s official open price, which usually comes from the pre-open call auction that runs from 9:00 to 9:15 AM.
Example 1: Petronet LNG, 13 Nov 2026 (open = high)
PETRONET opened at 332.00, and 332.00 was also the day’s high. It then fell all day and closed at its low of 324.05, down 3.27% from 335.00, on 2.94 times its normal volume, with 79.1% delivery. The scanner also tagged it as a bearish marubozu candle.
Example 2: Alkem Laboratories, 13 Nov 2026 (open = high, using the tolerance)
ALKEM opened at 5,300 and its high was 5,300.50. The ₹0.50 gap is inside the tolerance (0.02% of 5,300 is ₹1.06), so it counts as open = high. It closed at 5,114 (−3.55%). It had also been open = high the day before, 12 Nov, when it opened at its high of 5,422 and closed at 5,302 on 9.9 times normal volume.
Example 3: Gujarat Pipavav Port, 13 Nov 2026 (open = low)
GPPL opened at 167.00, which was the day’s low, rose to 177.40 and closed at 173.59, up 3.6%, on 3.68 times normal volume. It also closed above its upper Bollinger Band, so it appeared in two scanners.
The tabs, and how the setup differs from similar ones
| Tab | Rule | Sorted by |
|---|---|---|
| Open = low | Never traded below the open | Change, biggest gain first |
| Open = high | Never traded above the open | Change, biggest fall first |
| Open = low, high volume | Open = low and volume at least 1.5× the 20-day average | Volume ratio, highest first |
Close cousins
| Setup | How it differs |
|---|---|
| Intraday open high low | Checked in the first minutes; the open may stop being the high or low later. This page waits for the full day. |
| Marubozu candle | Open near one end and close near the other, with a long body. Every bullish marubozu is close to open = low, but an open = low day can close anywhere above the open. See the candlestick scanner. |
| Gap up / gap down | Compares the open with yesterday’s close, not with today’s high or low. A gap-down day that rallies all day is often also open = low. See the gap scanner. |
Two everyday words you will see: follow-through (the next day keeps moving the same way) and reversal (it turns the other way).
Why traders watch it: advantages and limits
✅ A clean read of the day
One look tells you which side controlled the whole session, without opening a chart.
✅ A market mood gauge
On 13 Nov 2026, when NIFTY 50 fell 0.61%, the scanner found 245 open = high stocks against just 35 open = low. A lopsided count shows how broad a move was.
✅ Natural levels
The open of an open = low day is a level buyers defended all day; many traders watch it as support for the next session.
✅ Easy to combine
Volume, trend, RSI and other setups sit next to each name, and the high-volume tab is ready-made.
The limits: what our own test found
We rebuilt both lists for every session from 15 Jan 2025 to 13 Nov 2026 (452 sessions) for the 1,536 stocks in today’s list, with the same rule and the same adjusted NSE data (Diwali Muhurat sessions left out), and measured what followed. “Beat the market” means the stock did better than the average of all stocks in the list over the same days.
| Setup | Cases | Higher next day | Higher after 5 sessions | Higher after 20 sessions | Median after 20 | Beat the market, 20 sessions |
|---|---|---|---|---|---|---|
| Open = low | 40,755 | 47.6% | 47.0% | 47.7% | −0.56% | 43.3% |
| Open = low, 1.5× volume | 9,614 | 47.8% | 45.9% | 46.9% | −0.89% | 43.3% |
| Open = high | 59,095 | 45.7% | 46.2% | 44.5% | −1.30% | 42.7% |
| Any stock, any day | 607,552 | 46.9% | 46.8% | 46.8% | −0.74% | 43.4% |
The next session
| Next day… | After open = low | After open = high | Any day |
|---|---|---|---|
| Traded above the day’s high | 56.9% | 32.4% | 44.7% |
| Closed above the day’s high | 26.6% | 14.4% | 20.4% |
| Traded below the day’s low | 32.1% | 63.5% | 49.4% |
| Closed below the day’s low | 16.5% | 35.0% | 26.7% |
In plain words:
- There was some next-morning follow-through. After open = low, the next day went above the high more often than usual; after open = high, it went below the low more often. That is momentum that mostly plays out in the first hours of the next session.
- It faded fast. Over 1, 5 and 20 sessions, open = low stocks were higher about as often as any stock. High volume did not improve this. Open = high stocks lagged a little after 20 sessions (44.5% higher against 46.8%), a small difference.
- Among F&O stocks alone (4,752 open = low cases) the result was the same: 51.7% were higher after 20 sessions against 51.0% for any F&O stock-day, and fewer beat the market (46.9% against 48.1%).
- It is very common. On an average evening about 90 stocks were open = low and about 130 open = high, so being on the list is not special by itself.
So how should you use it? As a record of who controlled the day and a source of levels for tomorrow, not as a signal. The test uses today’s stock list (survivorship flatters the past), covers a period when the typical stock fell, and ignores costs.
A tour of the scanner screen
Open the open high low scanner. At the top are the scan date and the three tabs; below them the filters, the results table and three explanation cards.

- 1Scan for: pick a scan date; the latest is first.
- 2Open = low: never traded below the open all day.
- 3Open = high: never traded above the open all day.
- 4Open = low, high volume: open = low with volume 1.5× or more.
Compare the counts on the first two tabs every evening. Far more open = high than open = low means sellers controlled the session across the market, as on 13 Nov 2026.
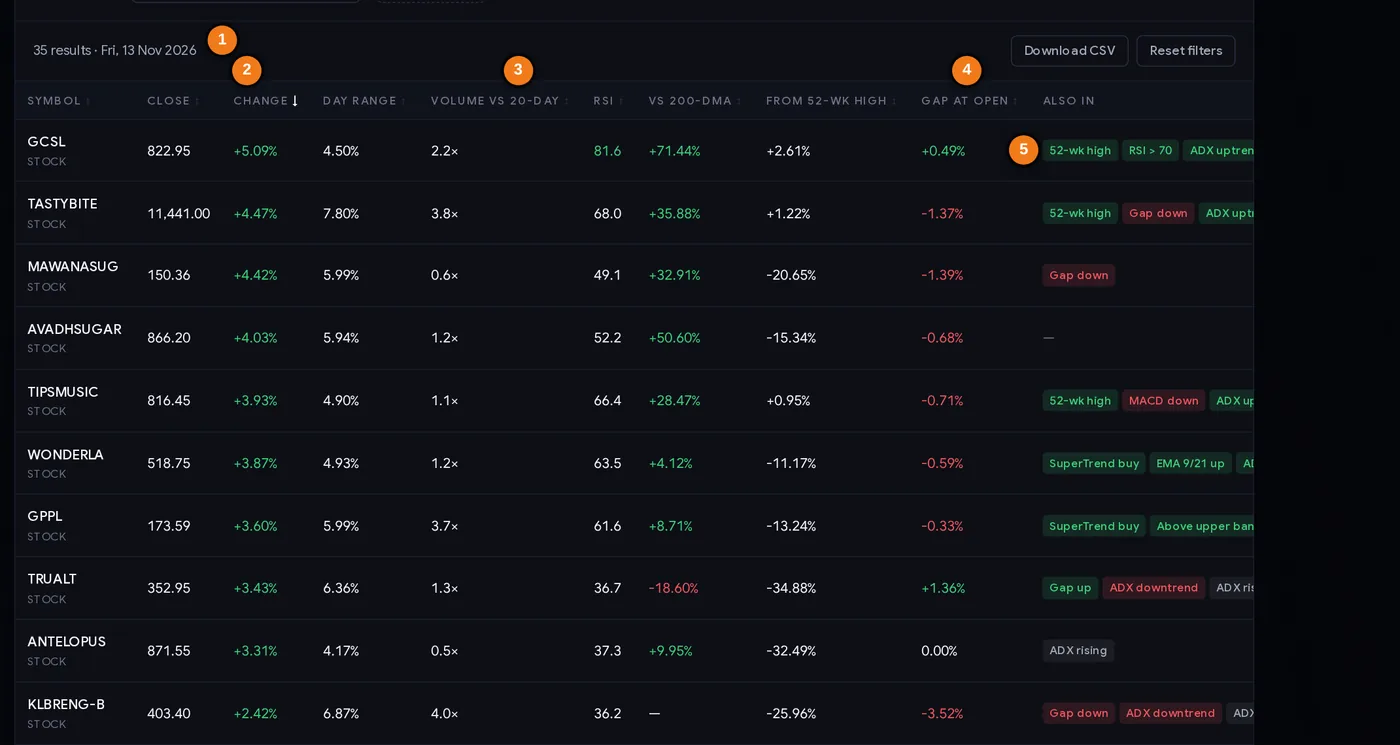
- 1Result count and scan date
- 2Change on the day (the sort order)
- 3Volume versus the 20-day average
- 4Gap at the open versus yesterday’s close
- 5Other scans the stock matched today
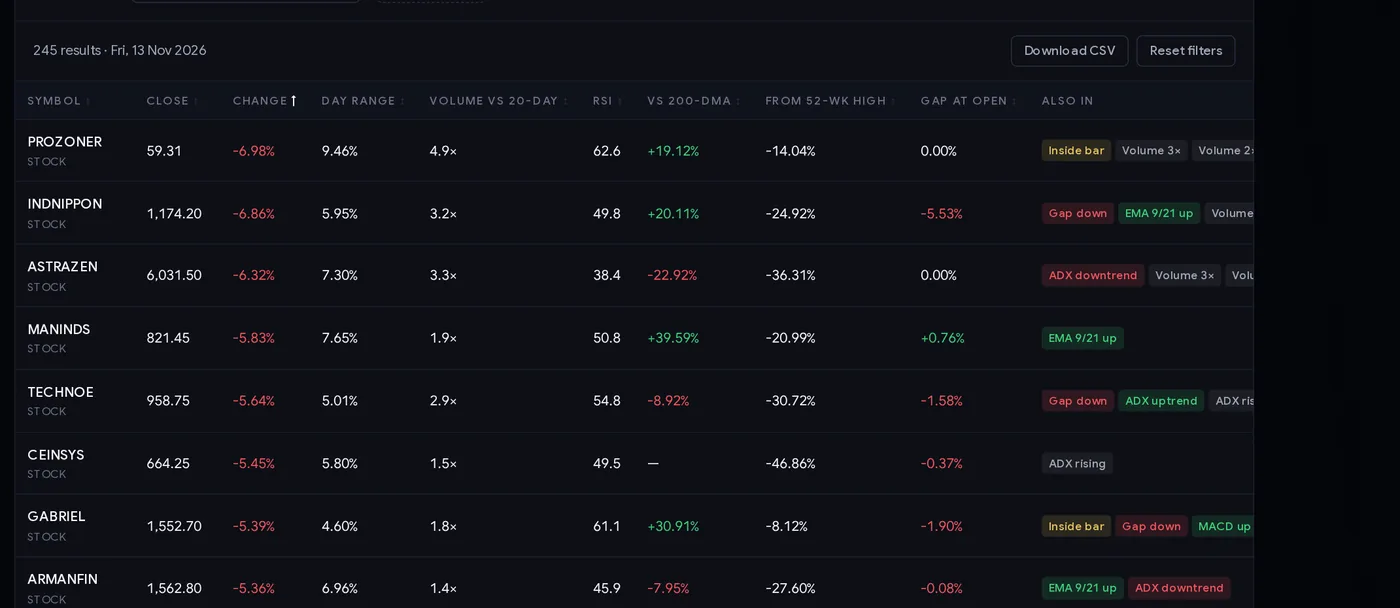
Every column explained
| Column | What it tells you |
|---|---|
| Symbol | The NSE symbol. |
| Close / Change | The closing price and the % change from the previous close. On an open = low day the change can still be negative if the stock opened with a gap down. |
| Day range | (High − Low) ÷ Close. On these days it is also roughly how far the stock travelled from its open. |
| Volume vs 20-day | Today’s volume divided by the 20-day average. 1.5× or more feeds the third tab. |
| RSI | 14-day Relative Strength Index: above 70 overbought, below 30 oversold. |
| vs 200-DMA | Distance of the close from the 200-day average: the long-term trend. |
| From 52-wk high | How far below its 52-week high the stock closed. |
| Gap at open | Today’s open versus yesterday’s close. A gap up with open = high means the opening jump was sold all day. |
| Also in | Other scans matched today: NR7, inside bar, Bollinger breakout, volume spike, candlestick patterns and more. |
The filters
The filters are the same as on the other scanners: Show (stocks or indices), Today (closed up or down), Trend (above or below the 20-, 50- or 200-day average), Combine with (NR7, inside bar, near a 52-week high or low, gap up or down) and, under More filters, RSI, volume, price band and sector. Find jumps to a symbol and Download CSV saves the filtered list.
Step by step: a 10-minute evening routine
- Open the scanner after the evening update and check the scan date.
- Compare the open = high and open = low counts. A big imbalance tells you the market’s mood for the day.
- Start with the high-volume tab. Open = low on 1.5× volume shows buyers who were both early and heavy.
- Filter for trend. Many traders keep open = low only above the 200-day average, and open = high only below it.
- Check the news. Results, orders or a block deal often explain a one-way day. See bulk and block deals and the results calendar.
- Look at delivery %. A one-way day with high delivery means more shares changed hands for keeps; see the delivery tutorial.
- Write down tomorrow’s levels: the day’s open (the low or the high) and the close.
- Size the trade first with the position size calculator, using the distance to your stop.
Three playbooks
Playbook A: the next-morning continuation
- Take open = low stocks from the high-volume tab that closed in the top part of their range and sit above the 200-day average.
- Next morning, watch the first 15–30 minutes. Some traders act only if the stock trades and holds above the previous day’s high.
- Stop loss: below the previous day’s open (its low), or a tighter intraday level.
- Book early. Our data showed follow-through mostly in the first session and little after, so many traders exit the same day or trail tightly.
Playbook B: the open as a support or resistance level
The open of an open = low day is a price that buyers defended for six hours. Swing traders note it and watch how the stock behaves if it comes back there in the following days. A close below it means the buyers of that day are now losing money, and the level has failed. The mirror applies to open = high: its open is a level sellers defended.
Playbook C: the end-of-day review for intraday traders
If you trade the intraday open high low setup, use this page in the evening as a scorecard. It shows which of the morning’s candidates kept the pattern for the whole day. Over a few weeks you learn whether your morning picks hold up, and in which market conditions. This is a learning tool, not a trading signal.
Always decide the loss first. Risk a small, fixed part of your capital per trade, for example 0.5%: with ₹2 lakh that is ₹1,000. If your stop is ₹4 away, the size is 250 shares.
Case studies from real NSE data
Four real examples from October and November 2026. Prices in ₹ from NSE’s daily files.
1. Tata Elxsi, 12 Oct 2026: open = low with follow-through
TATAELXSI opened at 3,139.80, which was the day’s low, rose to 3,290 and closed at 3,257 (+4.06%) on 2.82 times normal volume. The next day it climbed above the previous high and closed at 3,426.70 (+5.21%). By 19 Oct it was at 3,790, 16.4% above the open = low close. This is the picture traders hope for.
2. Nestlé India, 14 Oct 2026: open = low, then a sharp reversal
NESTLEIND opened at its low of 1,336 and closed at its high of 1,383.20 (+3.69%) on 2.97 times volume: a perfect one-way day. The next day it opened at 1,380, briefly went above the previous high to 1,385.90, then fell to 1,260.50 and closed at 1,275.80 (−7.76%). By 22 Oct it was at 1,189.90. A stop below the open = low (1,336) was hit in the first session, and the fall went far beyond it. Lesson: a perfect day says nothing about the next one; the stop is what limits the damage.
3. Alkem Laboratories, 12 and 13 Nov 2026: two open = high days in a row
On 12 Nov ALKEM opened at its high of 5,422 and closed at 5,302 (−2.68%) on 9.9 times normal volume. On 13 Nov it was open = high again (open 5,300, high 5,300.50) and closed at 5,114 (−3.55%). Two sessions of sellers in control from the first tick. Whether that continues is not known yet; this is the kind of name traders review, not a forecast.
4. The market on 13 Nov 2026: a one-sided day
NIFTY 50 fell 0.61% to 25,144.30. The scanner found 245 open = high stocks (36 of them F&O stocks, including PETRONET, ALKEM and GRASIM) and only 35 open = low (three F&O stocks: BHARTIARTL, AUROPHARMA and ANANDRATHI). Eight stocks made the high-volume open = low tab, including GPPL. Kajaria Ceramics was open = low (opened at 1,195, closed at 1,201.90) and also an NR7, a small one-way day. A lopsided count like this is a quick read of the day’s breadth.
Common mistakes
- Confusing it with the intraday scan. This list is built after the close. You cannot use it to enter at 9:30 AM the same day.
- Treating open = low as a buy signal. Over 5 and 20 sessions it did no better than any stock in our test.
- Ignoring the gap. A stock that gaps down 4% and then rises 1% is open = low but still closed lower. Read the change and gap columns.
- Holding for days on a one-day pattern. The follow-through we measured was mostly in the next session.
- Trading every name. On a one-sided day there can be 200+ stocks in one tab. Filter by volume, trend and liquidity.
- No stop because the day “looked strong”. Case 2 shows how quickly a perfect day can reverse.
Pre-trade checklist
- I know this is an end-of-day list and my trade is for the next session or later.
- The scan date is the latest session; I noted the open = high vs open = low counts.
- The setup agrees with the long-term trend (vs 200-DMA).
- I checked the news, results and delivery %.
- The stock trades enough for my size.
- Trigger, stop (the day’s open) and exit plan are written down.
- If it gaps far beyond my level, I re-plan or skip.
- Position size comes from the stop distance.
Glossary
| Open | The first official price of the session. |
| Open = high | The open was also the highest price of the day (within ₹0.05 or 0.02%). |
| Open = low | The open was also the lowest price of the day (within ₹0.05 or 0.02%). |
| Tick | The smallest price step a stock can move. |
| Pre-open session | The 9:00–9:15 AM call auction on NSE that usually sets the opening price. |
| End-of-day (EOD) | Data for the full session, available after the close. |
| Follow-through | The next session continuing in the same direction. |
| Marubozu | A long candle with almost no shadows. |
| Volume ratio | Today’s volume ÷ the 20-day average volume. |
| Delivery % | The share of traded quantity that was actually delivered, not squared off the same day. |
Questions
What is the open high low strategy?
It looks for stocks whose opening price was also the day’s high (sellers in control) or the day’s low (buyers in control). ChartMine lists both after every close for about 1,500 actively traded NSE stocks, with volume and trend.
Is ChartMine’s open high low list intraday or end-of-day?
End-of-day. It uses NSE’s official open, high and low for the full session, so a stock appears only if the open held as the high or low until the close. The intraday version, checked in the first minutes, can change later in the day.
How exact does open have to equal high or low?
Within ₹0.05 or 0.02% of the open, whichever is larger. For example, Alkem opened at 5,300 with a high of 5,300.50 on 13 Nov 2026, which counts as open = high.
Is open = low bullish for the next day?
Only slightly, and briefly. In ChartMine’s test of 40,755 cases, the next day traded above the high 56.9% of the time against 44.7% for any day, but after 5 and 20 sessions the stocks did no better than average.
How many open high low stocks are there on a normal day?
In our 452-session test, about 90 stocks a day were open = low and about 130 open = high. On 13 Nov 2026 there were 245 open = high and 35 open = low.
Which stocks does the scanner cover?
About 1,500 actively traded NSE stocks, F&O and non-F&O, using daily prices adjusted for splits and bonuses. It updates every evening after NSE’s end-of-day file.