
☰ All tutorials
Start here
Tool tutorialsHow to trade with ChartMineStocks
Stock monitorMy watchlistStock scores & checklistMarket & sectors
Nifty 50Bank NiftySensexFin NiftyDaily market reportMarket breadthSector rotationSector heatmapStock screenerRelative strength (RS)MCX commodity pricesFear & Greed IndexWhat happens after…Scanners
Top gainers & losersStocks to watch tomorrowNR7 stocks scannerInside bar stocks52-week high stocksGap up & gap down stocksRSI oversold stocksGolden cross stocksSuperTrend buy stocksScan builderEMA 9/21 crossoverMACD crossoverADX strong trendBollinger breakout / squeezeVolume spike stocksOpen = high / open = lowCandlestick pattern scannerNarrow CPR scannerF&O data
F&O ban listOI build-upOption chainPCR & max painExpiry calendarF&O lot sizesOI build-up heatmapPCR trendMax pain trendFutures basisStock screens
Quarterly growersProfit growth stocksLow P/E stocksMutual fund buyingNear 52-week low, growingDebt-free companiesHigh ROE & ROCEMagic Formula stocksLow price-to-bookSmart money
FII / DII dataShareholding changesBig-money footprintShort selling dataF&O positions by participantBulk & block dealsPromoter buyingDelivery percentageCalendars
Results calendarQuarterly results trackerBoard meetingsCorporate actionsIPO calendarIPO performanceResearch & planning
Strategy testerCompare stocksDividend yield stocksASM / GSM listExpiry-day movesSeasonality & stock historyNSE holidays 2026Position size calculatorOption payoff calculatorPivot point calculatorMore
Stock scanners hubStock screensHow to use the Pivot point calculator
A plain-language tutorial on pivot points: every formula, which type to use, how often NIFTY really reached the levels, a tour of the calculator, worked examples with real NSE prices and three real sessions.
What pivot points are, in plain words
Every trading session leaves three important prices: the high, the low and the close. Pivot points turn those three numbers into a ladder of price levels for the next session: a central pivot, resistance levels above it (R1, R2, R3) and support levels below it (S1, S2, S3).
Traders use them as a ready-made map: places where the price may pause, turn or speed up. Because the formulas are public and simple, many traders watch the same levels, which is part of why price often reacts around them.
The pivot point calculator computes five sets at once from any high, low and close:
- Classic pivots (the most widely used),
- Fibonacci pivots,
- Camarilla pivots (popular for intraday reversal levels),
- Woodie pivots (which give the close extra weight),
- and the CPR (Central Pivot Range): the pivot with a top and bottom central level, plus its width.
Type the numbers yourself, or type an NSE symbol and press Load previous session to fill in the last session’s open, high, low and close from NSE’s daily file.
One line to remember: pivots tell you where to pay attention. They do not tell you which way the price will go, and our NIFTY data below shows the first levels are crossed most days.
The formulas, side by side
H = previous high, L = previous low, C = previous close, Range = H − L.
| Set | Pivot | R1 / S1 | R2 / S2 | R3 / S3 (and R4/S4) |
|---|---|---|---|---|
| Classic | P = (H + L + C) ÷ 3 | 2P − L / 2P − H | P ± Range | H + 2(P − L) / L − 2(H − P) |
| Fibonacci | same P | P ± 0.382 × Range | P ± 0.618 × Range | P ± Range |
| Camarilla | (no pivot shown) | C ± Range × 1.1 ÷ 12 | C ± Range × 1.1 ÷ 6 | R3/S3: C ± Range × 1.1 ÷ 4; R4/S4: C ± Range × 1.1 ÷ 2 |
| Woodie | W = (H + L + 2C) ÷ 4 | 2W − L / 2W − H | W ± Range | – |
| CPR | P | BC = (H + L) ÷ 2; TC = 2P − BC. The higher of the two is the top. Width = (top − bottom) ÷ P, in %. | ||
Which timeframe?
- Daily pivots (from yesterday’s H, L, C) are for intraday trading today. This is what “Load previous session” gives you.
- Weekly pivots (from last week’s H, L, C) suit swing trades lasting a few days.
- Monthly pivots (from last month’s H, L, C) suit positional trades.
For weekly or monthly levels, type the period’s high, low and close into the boxes yourself.
Which pivot type to use
| Type | Character | Who tends to use it |
|---|---|---|
| Classic | Levels spread by the whole range. The standard; shown on most charting platforms. | Everyone; the most widely watched. |
| Fibonacci | Same pivot, levels at 38.2%, 61.8% and 100% of the range. | Traders who already use Fibonacci retracements. |
| Camarilla | Levels hug the close; R3/S3 and R4/S4 are the key ones. | Intraday traders: fade R3/S3, or trade a break of R4/S4. |
| Woodie | Gives more weight to the close. | Traders who think the close matters most. |
| CPR | A band around the pivot; its width hints at the type of day. | Very popular in India for intraday index and stock trading. |
Reading the CPR width
The calculator labels the width: ultra narrow (0.15% or less), narrow (up to 0.30%, shown in green), moderate (up to 0.50%) or wide. Traders watch narrow CPRs for possible trending days and wide CPRs for sideways days. ChartMine’s own test of 152 days of stock scans found a narrow CPR alone did not make a bigger move more likely; see the narrow CPR scanner tutorial.
There is no “best” type. Pick one, learn how your stocks behave around it, and stick with it. Mixing all five on one chart creates so many lines that every price is “near a level”.
Why traders use pivots: advantages and limits
✅ Objective levels
No drawing, no judgement: the same formula gives the same levels to everyone, before the market opens.
✅ A plan before the open
You know in advance where you would buy, sell, place a stop or take profit.
✅ Works for any NSE symbol
Load the previous session of any stock or index, or type values for weekly and monthly levels.
✅ Five methods at once
Classic, Fibonacci, Camarilla, Woodie and CPR side by side, so you can compare.
The limits: what NIFTY actually did
We checked NIFTY 50 over 295 sessions from August 2025 to 6 Nov 2026: each day’s Classic levels from the previous session against what the index then did.
| During the next session NIFTY… | Share of days |
|---|---|
| Touched R1 | 48% |
| Touched S1 | 47% |
| Touched R1 or S1 | 88% |
| Touched both R1 and S1 | 8% |
| Closed between S1 and R1 | 42% |
| Touched R2 | 20% |
| Touched S2 | 26% |
| Traded through the pivot itself | 54% |
- R1 and S1 are not walls. One of them was reached on 88% of days, and on most of those days the index closed beyond it (only 42% of closes were back between S1 and R1).
- R2 and S2 are reached on about a fifth to a quarter of days. They are more “extreme” but far from rare.
- Gaps skip levels entirely (case 3 below).
So how should you use them? As a map of where to watch the price, and as reference points for stops and targets. React to what the price does at a level (holds, breaks, closes beyond); do not assume it will stop there.
A tour of the calculator
Open the pivot point calculator. It opens with NIFTY and the latest session already loaded.
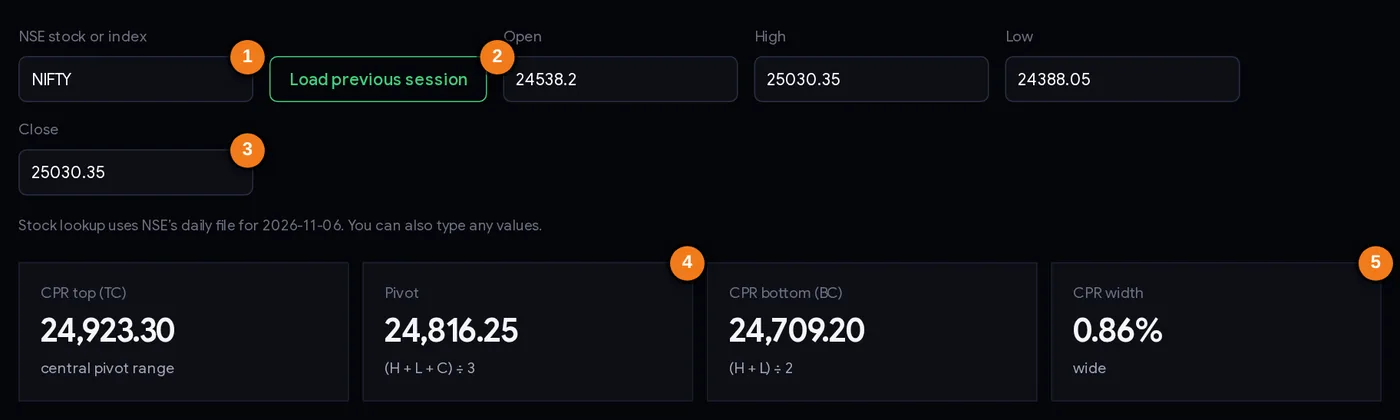
- 1Type any NSE stock or index symbol.
- 2Load previous session: fills open, high, low and close from NSE’s daily file.
- 3Open, high, low and close boxes: type your own values for weekly or monthly pivots.
- 4The pivot, between the CPR top (TC) and bottom (BC).
- 5CPR width and its label.
The fine print under the inputs shows which NSE daily file the lookup used (here 6 Nov 2026). The open is shown for reference; the pivot formulas use the high, low and close. Change any box and every level recalculates instantly.
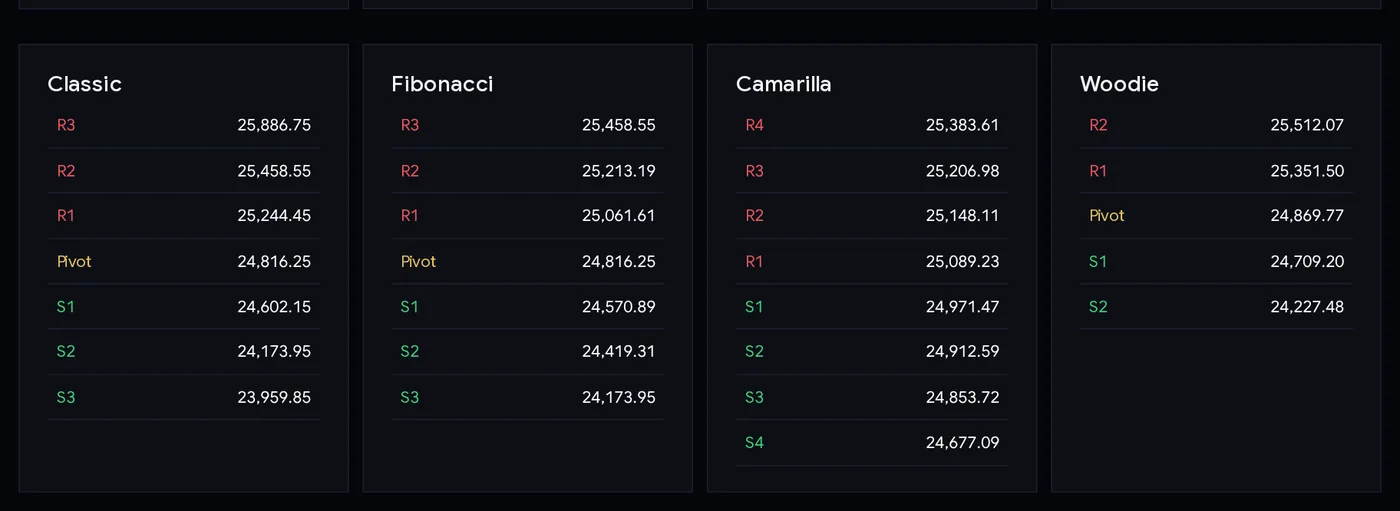
| Part | What it tells you |
|---|---|
| CPR top (TC) / Pivot / CPR bottom (BC) | The central pivot range. The calculator always shows the higher number as the top. |
| CPR width | Band width as % of the pivot, with a label (ultra narrow / narrow / moderate / wide). |
| Four level tables | Classic, Fibonacci, Camarilla, Woodie. Resistance levels in red, support in green, pivots in yellow. |
Worked examples with real prices
Example 1: NIFTY levels for Monday 9 Nov 2026 (the pictures above)
On Friday 6 Nov 2026 NIFTY’s high was 25,030.35, its low 24,388.05 and its close 25,030.35 (it closed at the day’s high). Range = 642.30.
- P = (25,030.35 + 24,388.05 + 25,030.35) ÷ 3 = 24,816.25
- BC = (25,030.35 + 24,388.05) ÷ 2 = 24,709.20; TC = 2 × 24,816.25 − 24,709.20 = 24,923.30
- CPR width = 214.10 ÷ 24,816.25 = 0.86%: a wide CPR
- R1 = 2 × 24,816.25 − 24,388.05 = 25,244.45; S1 = 2 × 24,816.25 − 25,030.35 = 24,602.15
- R2 = 24,816.25 + 642.30 = 25,458.55; S2 = 24,173.95
- Camarilla R3 = 25,030.35 + 642.30 × 1.1 ÷ 4 = 25,206.98; S3 = 24,853.72
Notice the close (25,030.35) is above the whole CPR. Traders describe that as the market finishing strong; the band 24,709–24,923 below is the first area many of them would watch if the price pulls back.
Example 2: SBI levels for 9 Nov 2026
Type SBIN and press Load previous session. On 6 Nov SBI’s high was ₹1,020.00, low ₹990.50, close ₹1,018.50 (range ₹29.50).
| Level | Classic | Camarilla |
|---|---|---|
| R2 / R3 | R2 1,039.17 | R3 1,026.61 |
| R1 | 1,028.83 | 1,021.20 |
| Pivot | 1,009.67 | – |
| S1 | 999.33 | 1,015.80 |
| S2 / S3 | S2 980.17 | S3 1,010.39 |
CPR: BC ₹1,005.25, TC ₹1,014.08, width 0.87% (wide). See how close the Camarilla levels sit to the close compared with Classic: that is why intraday traders use Camarilla for quick reversals.
Example 3: weekly NIFTY pivots after a big week
For the week of 2–6 Nov 2026, NIFTY’s high was 25,030.35, low 23,207.05 and close 25,030.35. Typed into the calculator: weekly P = 24,422.58, R1 = 25,638.12, S1 = 23,814.82. After a week that rose about 8.6%, the weekly levels are more than 1,800 points apart, which shows why weekly pivots suit swing trades rather than intraday ones.
Step by step: a pre-market routine
- The evening before (or before 9:15 AM), open the calculator and load your stock or index. Check the date in the fine print.
- Note the CPR width and where the close sits (above, inside or below the band).
- Choose one level set you will use consistently, for example Classic plus CPR.
- Write down the key levels: pivot, CPR top and bottom, R1, S1, R2, S2.
- Check the calendar: results, policy events or a holiday-shortened session change everything (a short session makes almost every CPR narrow).
- Watch the open. A gap beyond R1/S1 or R2/S2 means many levels are already out of play.
- Act only on confirmation: a candle that closes beyond a level or rejects it, not the first touch.
- Place the stop on the other side of a level and size the trade with the position size calculator.
Three playbooks
Playbook A: the pivot as a trend filter
Above the pivot (and the CPR), many intraday traders look only for long setups; below it, only short ones. The pivot does not predict; it just keeps you from fighting the session’s early direction.
Playbook B: break and hold of R1 or S1
Wait for a 15-minute candle to close above R1. Enter on that close or on a retest of R1 that holds. Stop below the pivot or below the breakout candle. First target R2. Mirror it below S1. Given that R1 or S1 is touched on 88% of days, the confirmation (a close and a hold) matters far more than the touch.
Playbook C: Camarilla fade at R3/S3
Intraday traders using Camarilla often treat R3/S3 as places where a move may stall: a rejection at R3 (a candle that pokes above and closes back below) is used for a short with a stop above R4, and the mirror at S3. A clean break beyond R4/S4 is treated as a trend move instead. As with any reversal idea, the stop matters more than the entry.
Sizing: the distance from your entry to the level beyond your stop is your risk per share. Put both numbers into the position size calculator before you trade.
Case studies: three real NIFTY sessions
Levels are Classic pivots and CPR from the previous session; prices from NSE’s index file.
1. Tue 27 Oct 2026: the pivot holds on a quiet day
From 26 Oct (H 22,753.20, L 22,387.35, C 22,753.20): pivot 22,631.25, CPR 22,570.28–22,692.22 (width 0.54%, wide), R1 22,875.15, S1 22,509.30. On 27 Oct (an expiry day) NIFTY opened at 22,708.80, dipped into the CPR to a low of 22,636.85, just above the pivot, reached a high of 22,829.75 (below R1) and closed at 22,749.75. Every level from S1 to R1 framed the day. This is the picture pivot traders hope for.
2. Fri 6 Nov 2026: a trend day runs through everything
From 5 Nov (H 24,579.90, L 24,296.30, C 24,536.60): pivot 24,470.93, CPR 24,438.10–24,503.77 (width 0.27%, narrow), R1 24,645.57, R2 24,754.53, R3 24,929.17. NIFTY opened at 24,538.20 above the CPR, dipped to 24,388.05 (below the band, but above S1 at 24,361.97), then rallied and closed at 25,030.35, above R3. Anyone who sold at R1 or R2 because “resistance” was hit was run over. A narrow CPR before a trend day fits the textbook, but remember the scanner study: narrow CPRs alone did not reliably lead to bigger moves.
3. Thu 5 Nov 2026: a gap makes the levels irrelevant
From 4 Nov (H 23,960.60, L 23,696.15, C 23,960.60): pivot 23,872.45, R1 24,048.75, R2 24,136.90. NIFTY opened at 24,378.05, 241 points above R2, never traded back down to R2 (low 24,296.30) and closed at 24,536.60. Every pivot level was below the opening price. Lesson: when the market gaps beyond R2 or S2, the day’s pivot map is no longer useful; step aside or use the opening range instead.
Common mistakes
- Selling R1 or buying S1 automatically. One of them is touched on 88% of NIFTY days and often broken (case 2).
- Using too many level sets at once. Pick one or two.
- Using the wrong session’s data. Daily pivots for today come from yesterday’s high, low and close. Check the date shown.
- Trusting levels after a gap beyond R2/S2 (case 3).
- Ignoring short sessions. After a Muhurat or half-day session, ranges are tiny and the levels crowd together.
- No stop loss because “it is a support level”.
- Mixing up TC and BC. The top of the CPR is whichever is higher.
Pre-trade checklist
- The data date is the previous trading session (or the right week/month for swing levels).
- I use one level set consistently.
- I noted the CPR width and where the close sits against it.
- The open did not gap beyond R2 or S2.
- I will act on a close beyond or a rejection at a level, not on the first touch.
- Stop loss is beyond the next level; position size is calculated.
- No results or major event changes the picture today.
Glossary
| Pivot (P) | (High + Low + Close) ÷ 3 of the previous period. |
| Support (S1, S2, S3) | Levels below the pivot where buying may appear. |
| Resistance (R1, R2, R3) | Levels above the pivot where selling may appear. |
| CPR | Central Pivot Range: pivot, TC and BC. |
| TC / BC | Top and bottom central levels; the higher one is the top. |
| Range | High minus low of the previous period. |
| Camarilla | Pivot method with levels close to the previous close, built from range × 1.1. |
| Woodie | Pivot method that weights the close twice. |
| Gap | An open far from the previous close. |
| Confirmation | Waiting for a candle to close beyond a level before acting. |
Questions
How are pivot points calculated?
Classic pivot = (high + low + close) ÷ 3 of the previous session. R1 = 2 × pivot − low, S1 = 2 × pivot − high, R2 and S2 = pivot ± (high − low). Fibonacci, Camarilla and Woodie use the same inputs with different multipliers.
What are the NIFTY pivot levels for tomorrow?
Open the calculator after the close: it loads NIFTY’s latest session automatically. For 9 Nov 2026, from the 6 Nov session, the pivot was 24,816.25, R1 25,244.45 and S1 24,602.15.
Which pivot point is best for intraday trading?
Classic and CPR are the most widely watched in India; Camarilla is popular for intraday reversal levels. None is reliably better; pick one and use it consistently.
What is the difference between pivot points and CPR?
Pivot points give a ladder of support and resistance levels. The CPR is the band around the pivot (between TC and BC); its width is used as a clue to the type of day.
How often does NIFTY reach R1 or S1?
In 295 sessions from August 2025 to 6 Nov 2026, NIFTY touched R1 or S1 on 88% of days, R1 on 48% and S1 on 47%.
Can I calculate weekly or monthly pivots?
Yes. Type the previous week’s or month’s high, low and close into the boxes instead of loading the previous session.
Where does the stock data come from?
The previous session’s open, high, low and close from NSE’s daily file; index values from NSE’s index file.