
☰ All tutorials
Start here
Tool tutorialsHow to trade with ChartMineStocks
Stock monitorMy watchlistStock scores & checklistMarket & sectors
Nifty 50Bank NiftySensexFin NiftyDaily market reportMarket breadthSector rotationSector heatmapStock screenerRelative strength (RS)MCX commodity pricesFear & Greed IndexWhat happens after…Scanners
Top gainers & losersStocks to watch tomorrowNR7 stocks scannerInside bar stocks52-week high stocksGap up & gap down stocksRSI oversold stocksGolden cross stocksSuperTrend buy stocksScan builderEMA 9/21 crossoverMACD crossoverADX strong trendBollinger breakout / squeezeVolume spike stocksOpen = high / open = lowCandlestick pattern scannerNarrow CPR scannerF&O data
F&O ban listOI build-upOption chainPCR & max painExpiry calendarF&O lot sizesOI build-up heatmapPCR trendMax pain trendFutures basisStock screens
Quarterly growersProfit growth stocksLow P/E stocksMutual fund buyingNear 52-week low, growingDebt-free companiesHigh ROE & ROCEMagic Formula stocksLow price-to-bookSmart money
FII / DII dataShareholding changesBig-money footprintShort selling dataF&O positions by participantBulk & block dealsPromoter buyingDelivery percentageCalendars
Results calendarQuarterly results trackerBoard meetingsCorporate actionsIPO calendarIPO performanceResearch & planning
Strategy testerCompare stocksDividend yield stocksASM / GSM listExpiry-day movesSeasonality & stock historyNSE holidays 2026Position size calculatorOption payoff calculatorPivot point calculatorMore
Stock scanners hubStock screensHow to use the Position size calculator
A plain-language tutorial on position sizing: the formula, the three modes, a tour of the calculator, fully worked examples with real NSE prices and lot sizes, and case studies on gaps, losing streaks and lot-size changes.
What position sizing is, in plain words
Before any trade, two questions matter more than “will it go up?”:
- Where am I wrong? That price is your stop loss.
- How much am I willing to lose if I am wrong? That rupee amount is your risk per trade.
Position sizing connects the two. It tells you how many shares (or how many F&O lots) to buy or sell so that, if the price hits your stop loss, you lose only the amount you chose, no more.
The position size calculator does this in a second for stocks, futures and options, with NSE’s F&O lot sizes built in. It also shows the position’s value, the share of your capital it uses, the reward at your target, the risk : reward ratio, and the same trade at five other risk levels.
One line to remember: the stop loss decides where you get out; position size decides how much that costs you. Professionals fix the cost first and let the quantity follow.
The formula (with the arithmetic shown)
| Step | Formula |
|---|---|
| 1. Risk amount | Capital × risk % (or a fixed ₹ amount) |
| 2. Risk per share | Entry − stop loss (long) or stop loss − entry (short) |
| 3. Quantity | Risk amount ÷ risk per share, rounded down |
| 4. F&O lots | Quantity ÷ lot size, rounded down to whole lots |
| Position value | Quantity × entry price |
| Risk : reward | (Target − entry) ÷ (entry − stop), shown as 1 : x |
Rounding down matters: it means your real loss at the stop can be a little less than your chosen risk, never more (gaps aside, see below).
Why percent of capital?
Risking a fixed small share of capital keeps one bad trade, or a run of them, from doing serious damage. The arithmetic of a losing streak shows why:
| Risk per trade | After 10 losses in a row, ₹5,00,000 becomes | Gain needed to get back |
|---|---|---|
| 1% | ₹4,52,191 (−9.6%) | +10.6% |
| 2% | ₹4,08,537 (−18.3%) | +22.4% |
| 5% | ₹2,99,368 (−40.1%) | +67.0% |
Many traders risk between 0.5% and 2% per trade. The calculator lets you test any level; it does not tell you what is right for you, and it warns you when you go above 3%.
Three modes: stocks, futures and options
| Mode | Entry and stop are… | Quantity is… | Watch out for |
|---|---|---|---|
| Stocks (cash / intraday) | Share prices | Number of shares | Position value larger than capital needs margin (intraday leverage). |
| Futures | Futures prices | Whole lots (lot size filled in for the contract you pick) | Even one lot can exceed your risk: the result can be 0 lots. |
| Options | Option premiums, not the index or stock level | Whole lots | The premium paid is the most a buyer can lose; a premium stop can be skipped by a fast move. |
Direction: choose Long (buy) or Short (sell). For a short trade the stop loss must be above the entry. For options, “long” means you bought the option.
Risk in % or ₹: the small % / ₹ switch next to “Risk per trade” changes the unit. Switching converts the number for you (1% of ₹5,00,000 becomes ₹5,000).
A tour of the calculator
Open the position size calculator. Inputs are on the left, results on the right. Every number updates as you type. The picture below is filled in with the first worked example in the next section.
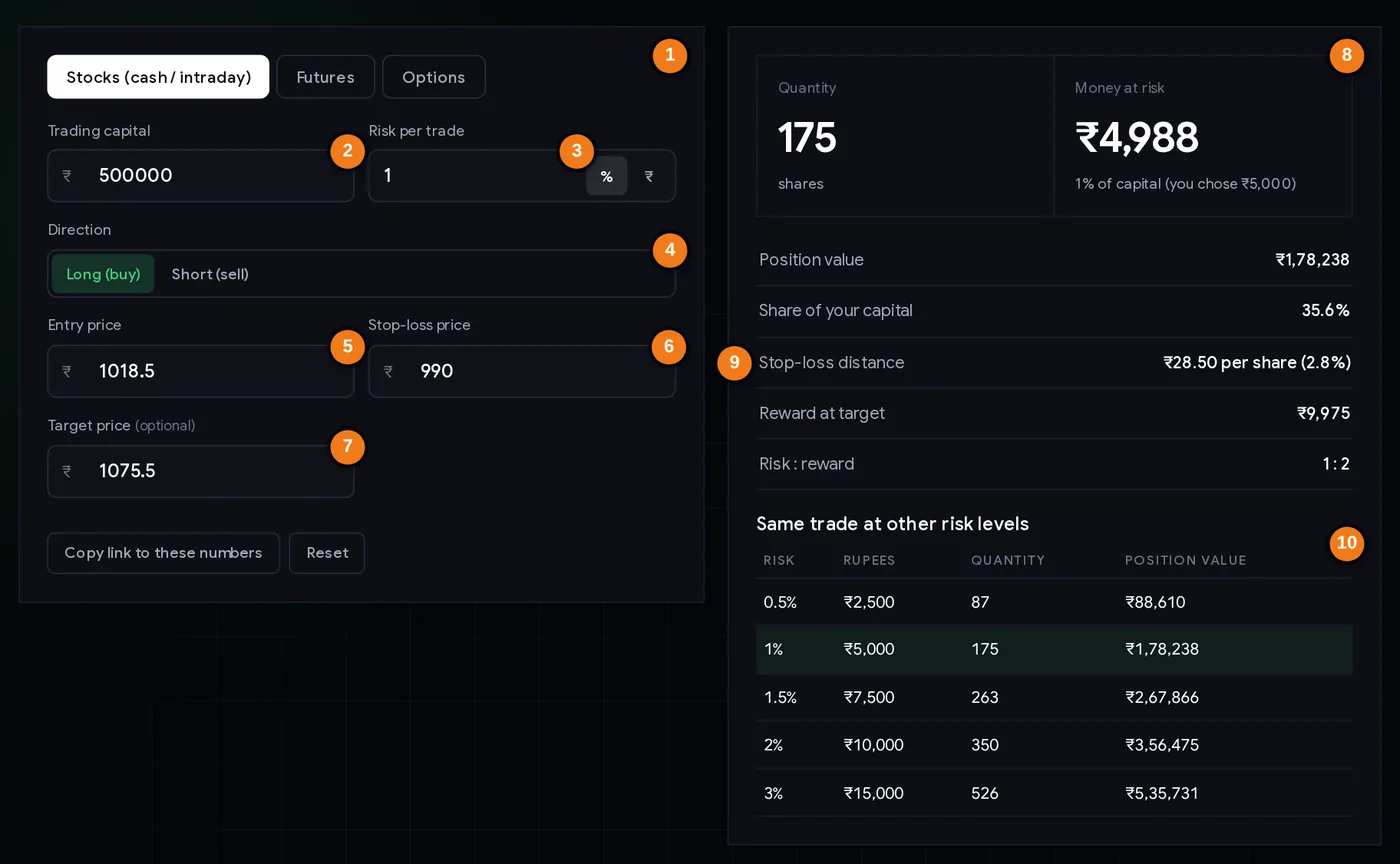
- 1Mode: stocks, futures or options.
- 2Trading capital.
- 3Risk per trade, with the % / ₹ switch.
- 4Direction: long (buy) or short (sell).
- 5Entry price.
- 6Stop-loss price.
- 7Target price (optional).
- 8The answer: quantity and money at risk.
- 9Position value, share of capital, stop distance, reward and risk : reward.
- 10The same trade at other risk levels.
| Result | What it tells you |
|---|---|
| Quantity / Lots | How many shares, or how many lots (with the units underneath). |
| Money at risk | What you lose if the stop is hit: quantity × stop distance. Shown also as % of capital. |
| Position value | Quantity × entry. For options, the total premium. |
| Share of your capital | Position value ÷ capital. |
| Stop-loss distance | Entry − stop in ₹ and %. |
| Reward at target / Risk : reward | Profit if the target is reached, and how it compares with the risk. |
| Same trade at other risk levels | The quantity at 0.5%, 1%, 1.5%, 2% and 3% risk. Your current level is highlighted. |
| Copy link to these numbers | The page address holds all your inputs, so you can save or share a plan. The calculator also remembers your last numbers in your browser. |
Warnings appear in a coloured box under the results: a stop on the wrong side, a target on the wrong side, zero lots, a position larger than your capital, or a risk above 3%.
Worked examples with real prices (6 Nov 2026)
All prices are NSE closing prices of Friday 6 Nov 2026; lot sizes are from NSE’s current lot-size file (November 2026 contracts). The stop and target levels are examples to show the arithmetic, not suggestions.
Example 1: SBI shares (cash)
SBI closed at ₹1,018.50; that day’s low was ₹990.50. A trader with ₹5,00,000 capital who risks 1% (₹5,000) plans to buy at ₹1,018.50 with a stop just under the low at ₹990, and an example target at ₹1,075.50 (twice the risk).
- Risk per share = 1,018.50 − 990 = ₹28.50 (2.8%)
- Quantity = 5,000 ÷ 28.50 = 175.4 → 175 shares
- Money at risk = 175 × 28.50 = ₹4,987.50 (the screen rounds to ₹4,988)
- Position value = 175 × 1,018.50 = ₹1,78,238, 35.6% of capital
- Reward at target = 175 × 57 = ₹9,975 → risk : reward 1 : 2
This is exactly the picture in the screen tour above. You can open the same numbers with this link: example 1.
Example 2: Reliance futures, and the “0 lots” answer
The Reliance November future closed at ₹1,323. The lot size is 500 shares. Same trader, same 1% risk, stop at ₹1,295 (the day’s low in the cash market).
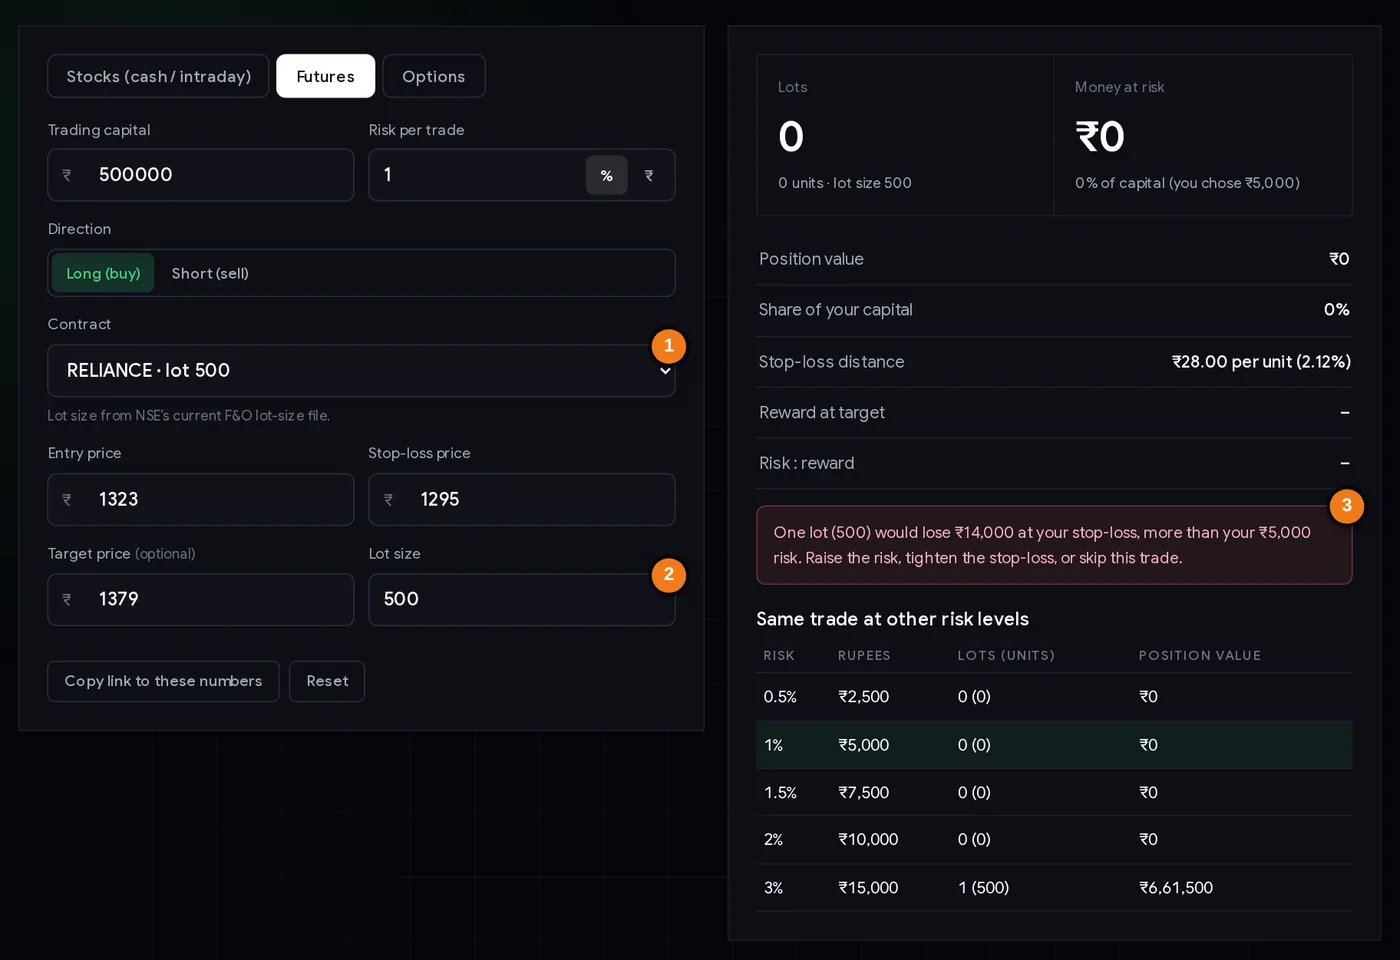
- 1Contract, with NSE’s lot size.
- 2Lot size (filled in; can be edited).
- 3The warning explains why the answer is 0 lots.
- Risk per unit = 1,323 − 1,295 = ₹28
- Units = 5,000 ÷ 28 = 178 → lots = 178 ÷ 500 = 0.36 → 0 lots
- One lot would lose 500 × 28 = ₹14,000 at the stop, 2.8% of capital.
The calculator says so plainly. The honest choices are: skip the trade; trade the shares instead (178 shares); or accept a larger risk (the ladder shows 1 lot only at 3%). With ₹15,00,000 capital, 1% risk (₹15,000) would allow 1 lot: risk ₹14,000, position value ₹6,61,500.
Do not move the stop just to make the lot fit. A stop at ₹1,313 would make 1 lot “fit” a ₹5,000 risk, but a stop belongs at the price where your idea is wrong, not where the arithmetic is convenient.
Example 3: buying a BANK NIFTY call option
The BANK NIFTY 59,100 call for the 23 Nov 2026 expiry closed at a premium of ₹742.05; the lot size is 30. The trader plans a premium stop at ₹600 and an example target premium of ₹1,026.15.
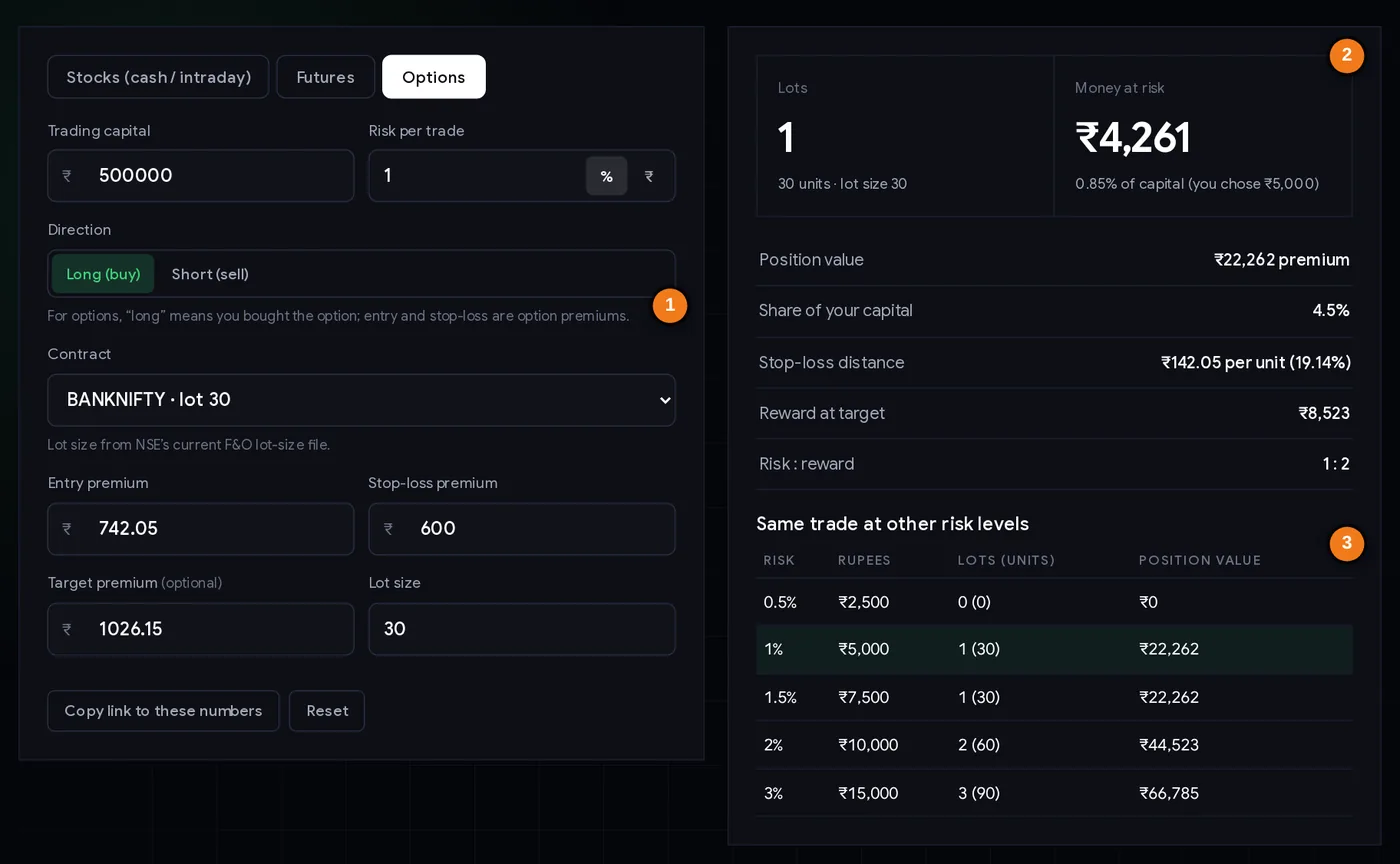
- 1In options mode, entry and stop are premiums.
- 21 lot (30 units), ₹4,261 at risk.
- 3At 0.5% risk the trade does not fit even one lot.
- Risk per unit = 742.05 − 600 = ₹142.05 (19.1% of the premium)
- Units = 5,000 ÷ 142.05 = 35 → 1 lot (30 units)
- Money at risk = 30 × 142.05 = ₹4,261.50, 0.85% of capital
- Premium paid = 30 × 742.05 = ₹22,261.50 (4.5% of capital)
- Reward at target = 30 × 284.10 = ₹8,523 → 1 : 2
Two things to notice. At 0.5% risk the answer is 0 lots. And a premium stop is only a plan, not a promise: if BANK NIFTY moves sharply against you, the premium can drop past ₹600 in seconds. The most an option buyer can lose is the full premium paid, here ₹22,261.50, so many traders also check that this full amount is acceptable.
Step by step: sizing any trade in one minute
- Pick the mode: Stocks, Futures or Options.
- Enter your trading capital: the money set aside for trading, not your total savings.
- Enter risk per trade in % (or switch to ₹).
- Choose Long or Short.
- For F&O, pick the contract. The lot size fills in from NSE’s lot-size file. Check it against your broker if the contract month is far away (lot sizes change; see case 4).
- Enter entry and stop loss (premiums for options). Take the stop from your chart: below support for a long, above resistance for a short.
- Optionally enter a target to see reward and risk : reward.
- Read the warnings and the ladder. If the answer is 0 lots or the position is bigger than your capital, rethink the trade.
- Place the order with the quantity shown, and place the stop loss order at the same time.
Three ways traders use it
Playbook A: fixed-risk swing trading
Risk the same percentage on every trade (say 1%). A stock with a wide stop gets a small quantity; a stock with a tight stop gets a larger one. Every losing trade costs about the same, so your results depend on your method, not on which trade happened to be big.
Playbook B: scaling risk to conviction, within limits
Some traders use 0.5% for a trade against the market trend or before results, and 1% for their best setups. The ladder shows both quantities side by side.
Playbook C: the “can I afford this F&O trade?” check
Before any futures or options trade, enter the plan. If even one lot breaks your risk limit (example 2), the trade is too big for your account today. Trade the shares, a smaller contract, or wait.
Where to get entry and stop levels: the pivot point calculator gives support and resistance levels; ChartMine signals come with an entry and stop you can put straight in.
Case studies
1. Oil India, 9–10 Jun 2026: when the price jumps over your stop
On 9 Jun 2026 Oil India closed at ₹475.95 with a low of ₹469.15. A long trade at the close with a stop at ₹469 risks ₹6.95 per share; at ₹5,000 risk that is 719 shares. The next morning the stock opened at ₹467, below the stop, and closed at ₹427.35 (−10.2%).
- With the stop executed at the open: loss = 719 × (475.95 − 467) = ₹6,435, about 29% more than the planned ₹5,000, but still 1.3% of capital.
- Without a stop, holding to the close: loss = 719 × 48.60 = ₹34,943, 7% of capital in one day.
Lesson: a stop loss cannot fix the exit price when the market gaps. That is one more reason to keep risk per trade small.
2. Equal risk, different stocks
On 6 Nov 2026, with a ₹5,000 risk: SBI with a ₹28.50 stop distance gives 175 shares (₹1,78,238). Reliance shares at ₹1,320 with a stop at ₹1,295 (₹25) give 200 shares (₹2,64,000). The positions are different sizes, but each loses about ₹5,000 at its stop. That is the point of sizing by risk rather than by a fixed number of shares or a fixed rupee amount.
3. Losing streaks
Ten losses in a row are not rare for any method. As the table in the formula section shows, at 1% risk ₹5,00,000 becomes about ₹4,52,000; at 5% it becomes about ₹2,99,000, and you then need a 67% gain just to get back.
4. Lot sizes change: check the contract month
NSE’s lot-size file of 7 Nov 2026 showed HDFC Bank at 650 shares for the November and December 2026 contracts but 750 from January 2027; Infosys 400 then 500; TCS 225 then 250. The same stop distance on a January contract therefore means more rupees at risk per lot. The calculator fills in the current-month lot size; type a different one in the Lot size box if you trade a later month.
Common mistakes
- Choosing quantity first and stop later. The stop decides the size, not the other way round.
- Moving the stop to fit a lot (example 2).
- Sizing from the margin your broker asks for. Margin is not risk; a futures lot can lose far more than its margin.
- Entering the index level instead of the premium in options mode.
- Forgetting gaps (case 1) and costs: brokerage, STT, exchange charges and GST are not included.
- Raising risk after losses to “win it back”.
- Using total savings as capital. Use only the money set aside for trading.
Checklist before you place the order
- Capital is my trading capital only.
- Risk per trade is within my own limit (many traders use 0.5–2%).
- The stop loss is at the price where my idea is wrong, taken from the chart.
- The lot size matches the contract month I am trading.
- The result is at least 1 lot without moving the stop; otherwise I skip or trade smaller.
- I can accept a loss larger than planned if the price gaps.
- For options, losing the whole premium is acceptable.
- I will place the stop loss order together with the entry.
Glossary
| Position size | The number of shares or lots in a trade. |
| Risk per trade | The amount you accept losing if the stop is hit, in ₹ or % of capital. |
| Stop loss | The price at which you exit a losing trade. |
| Stop distance | Entry minus stop (long) or stop minus entry (short). |
| Lot size | The fixed number of units in one F&O contract. |
| Premium | The price of an option. |
| Margin | The deposit a broker requires to open a leveraged position. |
| Risk : reward | Planned loss vs planned profit, e.g. 1 : 2. |
| Gap | When the price opens far from the previous close, skipping the prices in between. |
| Drawdown | The fall in capital from its peak. |
Questions
How do I calculate position size for a stock?
Multiply your capital by your risk % to get the rupee risk, divide by the distance between entry and stop loss, and round down. With ₹5,00,000, 1% risk, entry ₹1,018.50 and stop ₹990, that is 5,000 ÷ 28.50 = 175 shares.
How many lots of NIFTY can I trade with ₹5 lakh?
It depends on your stop loss, not just your capital. NIFTY’s lot is 65 units: with a 1% risk (₹5,000) you can afford one lot only if your stop is within about 76 points of entry (65 × 76 = ₹4,940).
Why does the calculator show 0 lots?
Because one lot would lose more than your chosen risk at the stop. For example one Reliance futures lot (500 shares) with a ₹28 stop loses ₹14,000, more than a ₹5,000 limit. Skip, trade shares, or accept a larger risk.
What is the 1% risk rule?
A common guideline: never lose more than 1% of trading capital on one trade. After ten losses in a row you would still have about 90% of your capital.
Does position size include brokerage and taxes?
No. Brokerage, STT, exchange fees and GST add to the real loss, so keep a small buffer.
For options, should I enter the strike or the premium?
The premium. In Options mode, entry, stop loss and target are option premiums, and the quantity is rounded down to whole lots.
Can my loss be bigger than the calculator shows?
Yes, if the price gaps past your stop. Oil India opened 1.9% below the previous close on 10 Jun 2026, so a stop just under the prior low filled lower than planned.