
☰ All tutorials
Start here
Tool tutorialsHow to trade with ChartMineStocks
Stock monitorMy watchlistStock scores & checklistMarket & sectors
Nifty 50Bank NiftySensexFin NiftyDaily market reportMarket breadthSector rotationSector heatmapStock screenerRelative strength (RS)MCX commodity pricesFear & Greed IndexWhat happens after…Scanners
Top gainers & losersStocks to watch tomorrowNR7 stocks scannerInside bar stocks52-week high stocksGap up & gap down stocksRSI oversold stocksGolden cross stocksSuperTrend buy stocksScan builderEMA 9/21 crossoverMACD crossoverADX strong trendBollinger breakout / squeezeVolume spike stocksOpen = high / open = lowCandlestick pattern scannerNarrow CPR scannerF&O data
F&O ban listOI build-upOption chainPCR & max painExpiry calendarF&O lot sizesOI build-up heatmapPCR trendMax pain trendFutures basisStock screens
Quarterly growersProfit growth stocksLow P/E stocksMutual fund buyingNear 52-week low, growingDebt-free companiesHigh ROE & ROCEMagic Formula stocksLow price-to-bookSmart money
FII / DII dataShareholding changesBig-money footprintShort selling dataF&O positions by participantBulk & block dealsPromoter buyingDelivery percentageCalendars
Results calendarQuarterly results trackerBoard meetingsCorporate actionsIPO calendarIPO performanceResearch & planning
Strategy testerCompare stocksDividend yield stocksASM / GSM listExpiry-day movesSeasonality & stock historyNSE holidays 2026Position size calculatorOption payoff calculatorPivot point calculatorMore
Stock scanners hubStock screensHow to use the Option payoff calculator
A plain-language tutorial on option payoff diagrams: the basics of each leg, the 12 ready-made strategies, a tour of the calculator, fully worked examples with real NSE premiums and lot sizes, and two real NIFTY weekly straddles.
What a payoff diagram is, in plain words
An option’s value on its last day depends on only one thing: where the underlying (the stock or index) closes. A payoff diagram draws that relationship. The horizontal axis is the underlying’s price at expiry; the vertical axis is your profit or loss in rupees. One look tells you where you make money, where you lose, and how much.
The option payoff calculator draws this for a single option or a combination of several (a strategy). Pick a stock or index and the spot price, lot size and closing premiums fill in from NSE’s latest end-of-day option chain. Pick one of 12 ready-made strategies, or build your own legs. The page shows:
- Max profit and max loss at expiry (or “Unlimited”),
- the breakeven price or prices,
- the premium paid or received for the whole position,
- and the chart: green where you profit, red where you lose, yellow dots at breakevens, a dashed line at today’s spot.
One line to remember: the diagram shows the result at expiry, before costs. On any day before expiry the profit or loss is different, because option prices also depend on time left and volatility.
Option basics you need for the diagram
| Position | You pay or receive | Best case at expiry | Worst case at expiry |
|---|---|---|---|
| Buy a call (CE) | Pay the premium | Unlimited, as the price rises above strike + premium | Lose the premium |
| Buy a put (PE) | Pay the premium | Large, as the price falls below strike − premium | Lose the premium |
| Sell a call | Receive the premium | Keep the premium | Unlimited loss as the price rises |
| Sell a put | Receive the premium | Keep the premium | Large loss as the price falls |
| Buy futures (FUT) | Margin only | Gains rupee for rupee as the price rises | Loses rupee for rupee as it falls |
How one leg is calculated
At an expiry price S, a call is worth max(0, S − strike) and a put max(0, strike − S). For a bought leg, profit = (value − premium) × lots × lot size; for a sold leg the sign flips. The calculator adds every leg together at 241 prices between 88% of the lowest strike and 112% of the highest, and also checks each strike exactly, because the best and worst points of most strategies sit on a strike.
What the summary cards mean
- Max profit / Max loss: the best and worst result at expiry. If the line keeps rising (or falling) beyond the chart, the card says Unlimited.
- Breakeven: the expiry price where the strategy makes exactly zero. Straddles, strangles and condors have two.
- Premium paid / received: the net cash for all legs at the shown premiums.
The 12 ready-made strategies
“ATM” means the strike closest to the spot price. “+2” means two strikes above ATM in the chain, “−3” three strikes below.
| Strategy | Legs | View | Max loss |
|---|---|---|---|
| Long call | Buy ATM CE | Up | Premium |
| Long put | Buy ATM PE | Down | Premium |
| Long straddle | Buy ATM CE + ATM PE | Big move, either way | Both premiums |
| Short straddle | Sell ATM CE + ATM PE | Little movement | Unlimited |
| Long strangle | Buy CE +2, PE −2 | Very big move | Both premiums |
| Short strangle | Sell CE +3, PE −3 | Range-bound | Unlimited |
| Bull call spread | Buy ATM CE, sell CE +3 | Moderately up | Net premium paid |
| Bear put spread | Buy ATM PE, sell PE −3 | Moderately down | Net premium paid |
| Iron condor | Sell CE +3, buy CE +6, sell PE −3, buy PE −6 | Range-bound, limited risk | Strike gap − credit |
| Long call butterfly | Buy CE −2, sell 2 × ATM CE, buy CE +2 | Stays near ATM | Net premium paid |
| Short put | Sell ATM PE | Not down | Large |
| Covered call | Buy futures + sell CE +2 | Mildly up | Large (futures) |
Every leg can be changed after you pick a preset: buy/sell, CE/PE/FUT, strike, premium and lots. “+ Add leg” adds a bought ATM call; ✕ removes a leg.
Why use a payoff calculator: advantages and limits
✅ See the worst case first
Max loss in rupees, before you place the order. “Unlimited” in red is hard to ignore.
✅ Real premiums and lot sizes
Strikes, closing premiums and lot sizes fill in from NSE’s latest end-of-day chain for every F&O stock and index.
✅ Compare strategies quickly
Switch between a straddle, a strangle and a condor on the same index and see how the risk changes.
✅ Learn by changing one thing
Move a strike or a premium and watch the breakevens and max loss move. It is the fastest way to understand options.
The limits (please read this part)
- Expiry only. Before expiry, time value and volatility change option prices. A position can show a loss today even if the expiry diagram looks fine.
- End-of-day premiums. The premiums are the previous session’s closing prices (the date is shown under the chart). Tomorrow’s live prices will differ; type your actual fill prices.
- No costs. Brokerage, STT, exchange charges, GST and slippage are not included. For strategies with four legs, costs add up.
- No margin figure. Selling options and futures needs margin, often far more than the premium; check with your broker.
- No probability. The diagram shows what happens if the price ends at a level, not how likely that is.
A tour of the calculator
Open the option payoff calculator. It opens with NIFTY 50 and a long straddle, using the latest chain.
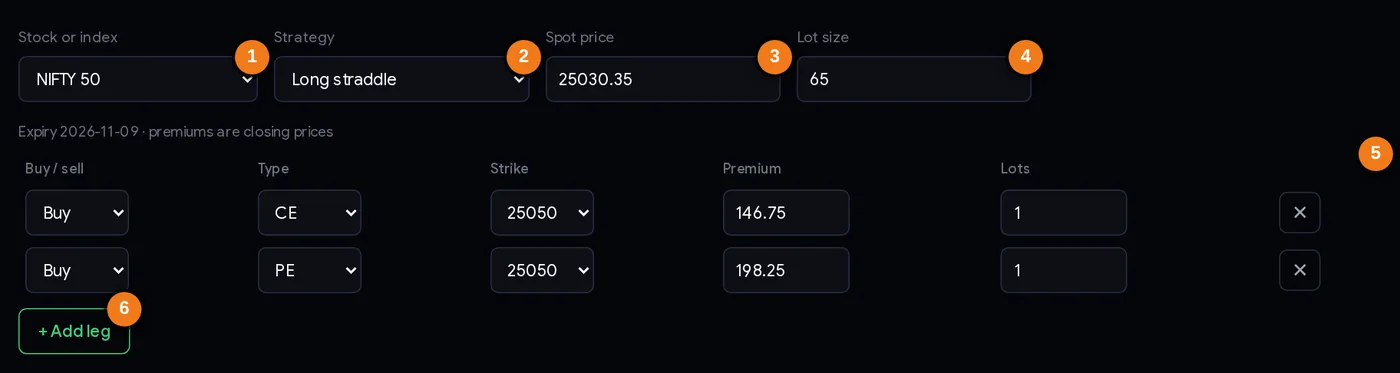
- 1Stock or index (or Manual).
- 2Ready-made strategy.
- 3Spot price (filled in, can be edited).
- 4Lot size from NSE’s lot-size file.
- 5The legs: buy/sell, CE/PE/FUT, strike, premium, lots, remove.
- 6Add another leg.
The line under the inputs shows the expiry date of the chain (for NIFTY on 6 Nov 2026 data: the 9 Nov weekly expiry). Choose Manual (type your own) in the first box to type a spot price, strikes and premiums for anything, including contracts not in the list.
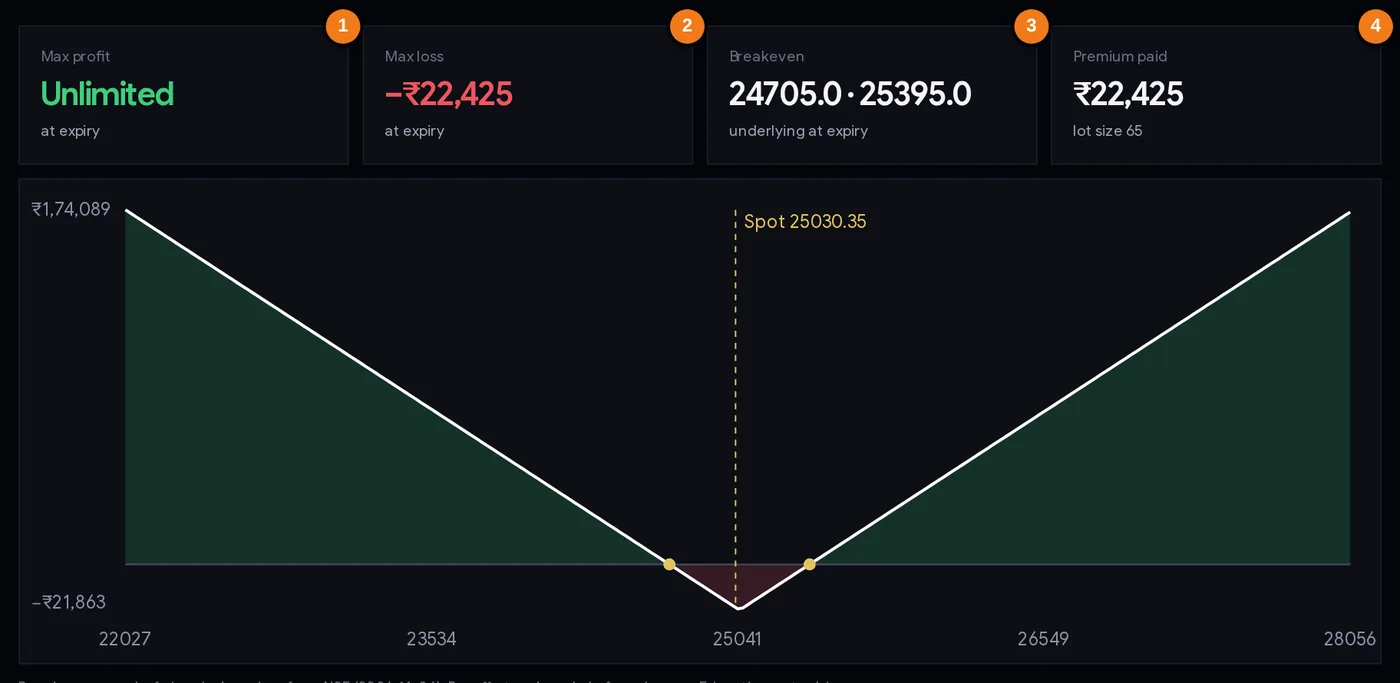
- 1Max profit at expiry (Unlimited here).
- 2Max loss at expiry.
- 3Breakeven prices.
- 4Net premium paid or received.
| Part | What it tells you |
|---|---|
| White line | Profit or loss at expiry for every price of the underlying. |
| Green / red area | Profit zone and loss zone. |
| Yellow dots | Breakevens. |
| Dashed line | Today’s spot price. |
| Left labels | The highest and lowest profit shown on the chart. |
| Bottom labels | Underlying prices across the chart. |
Worked examples with real premiums (closing prices of 6 Nov 2026)
All premiums are NSE closing prices of 6 Nov 2026 as loaded by the calculator; lot sizes are NIFTY 65 and Reliance 500. These are examples of the arithmetic, not trade suggestions.
Example 1: NIFTY long straddle (the picture above)
NIFTY spot 25,030.35; nearest strike 25,050; expiry 9 Nov 2026.
- Buy 25,050 CE at 146.75 + buy 25,050 PE at 198.25 = 345 points
- Premium paid = 345 × 65 = ₹22,425, which is also the max loss (if NIFTY expires exactly at 25,050)
- Breakevens = 25,050 − 345 = 24,705 and 25,050 + 345 = 25,395
- Max profit: unlimited above 25,395; large below 24,705
Put differently, NIFTY had to move about 1.4% from 25,050 by expiry just to break even. Compare that with the expiry-day moves page: NIFTY’s average weekly-expiry-day move since July 2024 was ±0.60%.
Example 2: NIFTY iron condor
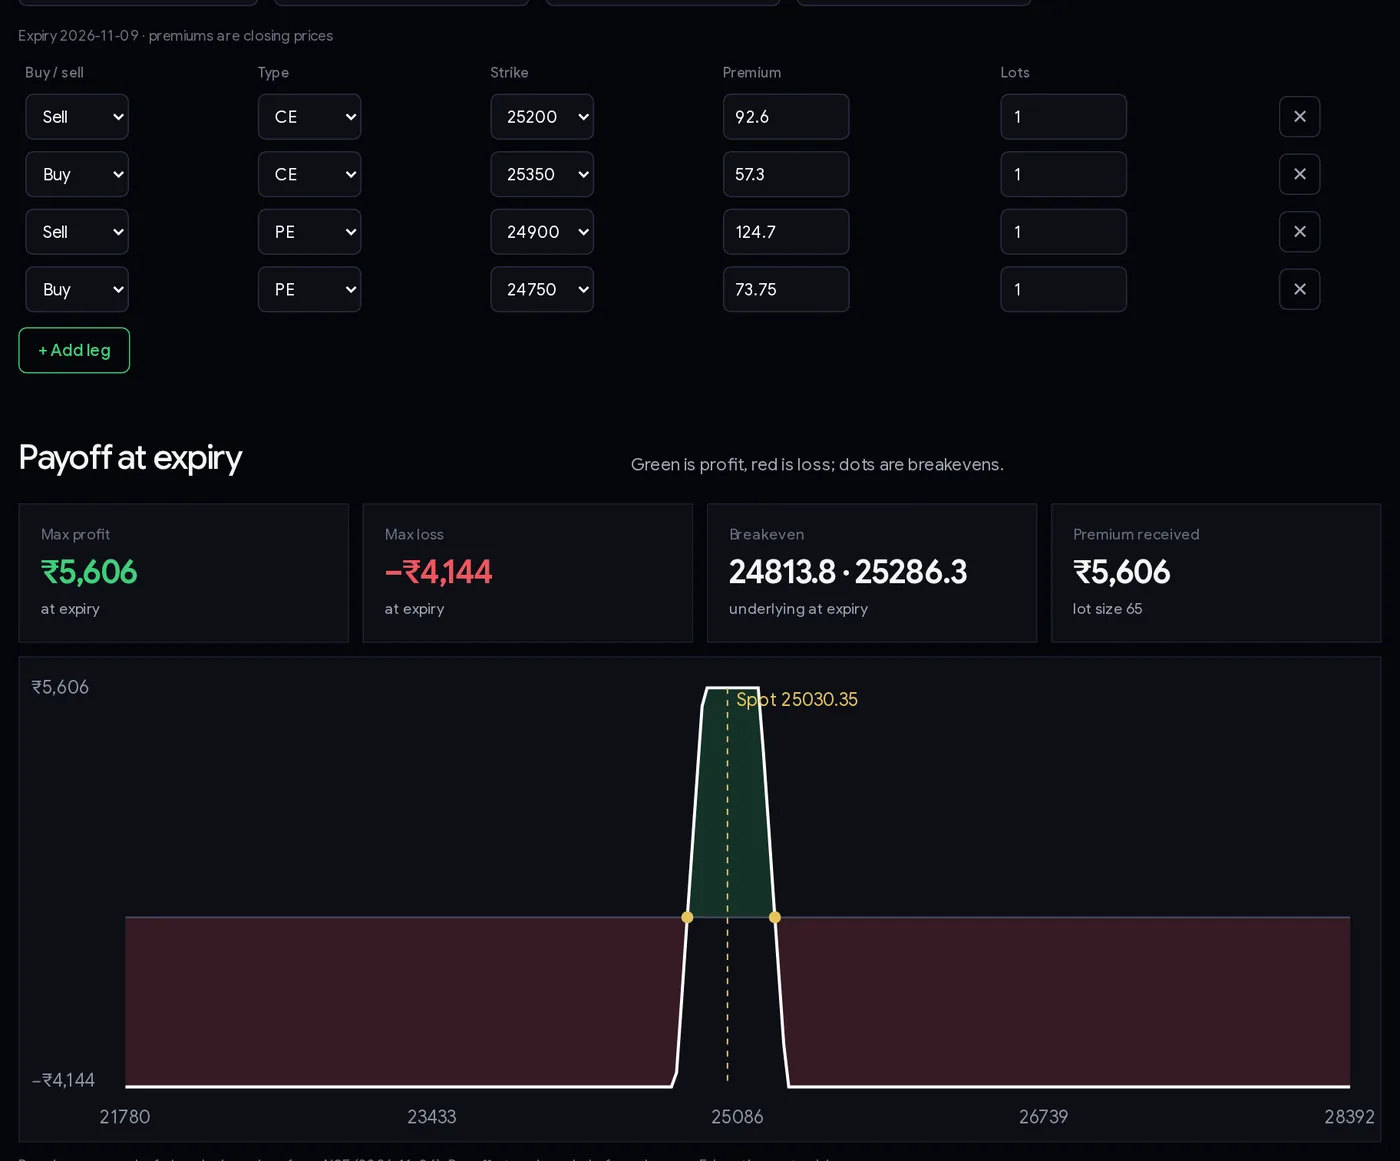
- Sell 25,200 CE at 92.60, buy 25,350 CE at 57.30, sell 24,900 PE at 124.70, buy 24,750 PE at 73.75
- Net credit = 92.60 − 57.30 + 124.70 − 73.75 = 86.25 points → ₹5,606.25 received = max profit (NIFTY between 24,900 and 25,200 at expiry)
- Max loss = (150-point gap − 86.25) × 65 = ₹4,143.75 (below 24,750 or above 25,350)
- Breakevens = 24,900 − 86.25 = 24,813.75 and 25,200 + 86.25 = 25,286.25
The wings (the bought 25,350 CE and 24,750 PE) are what cap the loss. Remove them and you have a short strangle with unlimited risk.
Example 3: Reliance bull call spread (stock, monthly expiry)
Reliance spot ₹1,319.99; expiry 23 Nov 2026; lot 500. In the calculator choose Reliance and “Bull call spread”.
- Buy 1,320 CE at ₹24.85, sell 1,350 CE at ₹13.35 → net debit ₹11.50 × 500 = ₹5,750 = max loss
- Max profit = (30 − 11.50) × 500 = ₹9,250 if Reliance expires at or above ₹1,350
- Breakeven = 1,320 + 11.50 = ₹1,331.50
Example 4: what “Unlimited” looks like
Choose NIFTY and “Short strangle”: sell 25,200 CE at 92.60 and 24,900 PE at 124.70. Credit = 217.30 × 65 = ₹14,124.50; breakevens 24,682.70 and 25,417.30; max loss Unlimited. A seller collects a fixed amount and takes open-ended risk; see case 2 below for how fast that risk can arrive.
Step by step: checking any options idea
- Choose the stock or index. Check the expiry line under the inputs.
- Pick a strategy that matches your view (up, down, big move, little move).
- Adjust strikes and lots. Premiums update from the chain when you change a strike.
- Type your real prices in the Premium boxes if the market has moved since the close.
- Read max loss first. If it says Unlimited, decide how you would exit long before that.
- Check the breakevens against how much the underlying usually moves by that expiry.
- Size the position: make sure max loss (or your planned exit loss) is within your risk per trade, using the position size calculator.
- Remember costs and margin before you place the order.
How traders use the calculator
Playbook A: turn a naked position into a defined-risk one
Start with the strategy you were thinking of, for example a short strangle. Look at max loss: Unlimited. Now add the two wings (buy a call further up and a put further down), which turns it into an iron condor. Compare: in the NIFTY example the credit falls from ₹14,124.50 to ₹5,606.25, but the max loss goes from Unlimited to ₹4,143.75. Many traders accept the smaller credit for a known worst case.
Playbook B: compare the cost of a directional view
If you expect Reliance to rise moderately by the 23 Nov expiry, compare a long call (1,320 CE at ₹24.85 = ₹12,425 per lot, breakeven ₹1,344.85) with the bull call spread in example 3 (₹5,750, breakeven ₹1,331.50, profit capped at ₹9,250). The spread costs less and breaks even sooner, but gives up everything above ₹1,350. The calculator shows the trade-off in seconds.
Playbook C: check the move the market is pricing
Select the long straddle on any stock or index. The breakevens are the range the option market is paying for by expiry. Compare it with how much that stock usually moves (the expiry-day moves and stock pages help). If the straddle looks expensive compared with typical moves, buyers face a high hurdle; if cheap, sellers are taking risk for little reward.
Always size it. Whatever the strategy, the max loss (or the loss at your planned exit) should fit inside your risk per trade.
Case studies: two real NIFTY weekly straddles
ChartMine’s F&O history stores the closing price of NIFTY’s at-the-money straddle for the nearest expiry from October 2026. Here are the first two complete weeks: the straddle at the close on the first day of the expiry week, against its value at the expiry close. Points × 65 (the current lot size) gives rupees per lot; costs are not included.
1. Week to Tue 27 Oct 2026: the buyer loses
On 19 Oct NIFTY closed at 22,888.95. The 22,900 straddle cost 341.15 points (₹22,175 per lot), with breakevens at 22,558.85 and 23,241.15. On expiry NIFTY closed at 22,749.75, inside the breakevens. The straddle was worth 150.25 (the put’s value), a loss of 190.90 points, about ₹12,409 per lot. The seller of the same straddle kept that amount.
2. Week to Tue 3 Nov 2026: the seller loses
On 27 Oct NIFTY closed at 22,749.75. The 22,750 straddle cost 388.10 points (₹25,227 per lot), breakevens 22,361.90 and 23,138.10. NIFTY then rallied and closed on 3 Nov at 23,810.85. The straddle was worth 1,060.85, a gain of 672.75 points, about ₹43,729 per lot for the buyer, and the same loss for anyone who had sold it. That is about 1.7 times the premium the seller had collected.
Lesson from the two weeks: the option market priced similar moves both weeks (about 1.5–1.7% of NIFTY). One week the market stayed inside, the next it moved 4.7%. Two weeks prove nothing about which side “wins” over time, but they show why sellers must plan for the bad week and buyers must accept losing weeks.
Common mistakes
- Reading the expiry diagram as today’s profit. Before expiry the result differs.
- Selling options because max profit looks “likely” without a plan for the Unlimited side (case 2).
- Using stale premiums. Type your fill prices.
- Forgetting lot sizes. Points are small; points × lot size are not.
- Ignoring costs on multi-leg strategies.
- Confusing strike and premium when typing legs.
- Choosing strategies by name rather than by checking the max loss and breakevens.
Checklist before an options trade
- The expiry date and lot size are right.
- Premiums match the prices I can actually trade.
- I know the max loss in rupees, or my exit point if it is Unlimited.
- The breakevens are realistic compared with typical moves to that expiry.
- Max loss (or planned exit loss) fits my risk per trade.
- I have checked margin and costs with my broker.
- I understand that results before expiry will differ from the diagram.
Glossary
| Underlying | The stock or index an option is based on. |
| Strike | The fixed price in the option contract. |
| Premium | The price paid for an option. |
| CE / PE | Call option / put option. |
| ATM | At the money: the strike nearest the spot price. |
| Leg | One option or futures position inside a strategy. |
| Breakeven | The expiry price where profit is zero. |
| Debit / credit | Net premium paid / received for the whole strategy. |
| Straddle | A call and a put at the same strike. |
| Strangle | A call and a put at different strikes, both away from the spot. |
| Time value | The part of a premium above its expiry value; it falls to zero at expiry. |
Questions
How do I use the option payoff calculator?
Pick a stock or index (premiums and lot size fill in from the latest NSE closing chain), pick a strategy or add legs, and adjust strikes, premiums and lots. The chart and cards show profit and loss at expiry, breakevens, max profit and max loss.
How is the breakeven of a straddle calculated?
Strike minus the total premium, and strike plus the total premium. On 6 Nov 2026 the NIFTY 25,050 straddle cost 345 points, so the breakevens were 24,705 and 25,395.
What is the max loss of an iron condor?
The gap between the sold and bought strikes minus the net credit, times the lot size. For the NIFTY example (150-point gap, 86.25 credit, lot 65) that is ₹4,143.75.
Why does the calculator say Unlimited?
Because the payoff keeps rising or falling beyond the chart, as with a bought call (unlimited profit) or a sold call or short straddle (unlimited loss).
Does the payoff include brokerage, STT and margin?
No. It shows the expiry payoff from premiums only. Costs reduce the result and selling options needs margin.
Is the profit before expiry the same as the chart?
No. Before expiry, option prices also depend on time left and volatility, so the profit or loss on any earlier day is different.