
☰ All tutorials
Start here
Tool tutorialsHow to trade with ChartMineStocks
Stock monitorMy watchlistStock scores & checklistMarket & sectors
Nifty 50Bank NiftySensexFin NiftyDaily market reportMarket breadthSector rotationSector heatmapStock screenerRelative strength (RS)MCX commodity pricesFear & Greed IndexWhat happens after…Scanners
Top gainers & losersStocks to watch tomorrowNR7 stocks scannerInside bar stocks52-week high stocksGap up & gap down stocksRSI oversold stocksGolden cross stocksSuperTrend buy stocksScan builderEMA 9/21 crossoverMACD crossoverADX strong trendBollinger breakout / squeezeVolume spike stocksOpen = high / open = lowCandlestick pattern scannerNarrow CPR scannerF&O data
F&O ban listOI build-upOption chainPCR & max painExpiry calendarF&O lot sizesOI build-up heatmapPCR trendMax pain trendFutures basisStock screens
Quarterly growersProfit growth stocksLow P/E stocksMutual fund buyingNear 52-week low, growingDebt-free companiesHigh ROE & ROCEMagic Formula stocksLow price-to-bookSmart money
FII / DII dataShareholding changesBig-money footprintShort selling dataF&O positions by participantBulk & block dealsPromoter buyingDelivery percentageCalendars
Results calendarQuarterly results trackerBoard meetingsCorporate actionsIPO calendarIPO performanceResearch & planning
Strategy testerCompare stocksDividend yield stocksASM / GSM listExpiry-day movesSeasonality & stock historyNSE holidays 2026Position size calculatorOption payoff calculatorPivot point calculatorMore
Stock scanners hubStock screensHow to use the NR7 stocks scanner
A plain-language tutorial on NR7 (narrow range 7) days: how they are found, the related setups, what our own 256-day test of the scanner shows, how to read every part of the screen, and three playbooks with real case studies.
What NR7 means, in plain words
Every trading day a stock has a range: the distance between its highest and lowest price of the day. On a busy day the range is wide. On a quiet day it is narrow.
NR7 stands for “narrow range 7”. A stock is an NR7 when today’s range is the smallest of the last seven trading days (today plus the six before it). It is a simple way of saying: “this stock had its quietest day of the week and a half.”
Why would anyone care about a quiet day? Markets tend to swing between calm phases and busy phases. A very calm day is sometimes the pause before a bigger move, a bit like a spring being pressed. The idea was popularised by the trader Toby Crabel in the 1990s, and many traders still keep an NR7 list every evening.
One line to remember: NR7 tells you a stock has gone quiet. It does not tell you when it will wake up, or in which direction.
The NR7 stocks scanner checks every F&O stock and the main indices after each close and lists the ones that had an NR7 day, with the trend, RSI, volume and other setups next to each name. You get the shortlist in seconds instead of opening 200 charts.
How the scanner finds an NR7 (with a real example)
The rule is pure arithmetic, so you can always check it yourself.
- For each of the last seven sessions, take High − Low. That is the day’s range in rupees.
- If today’s range is equal to or smaller than all six earlier ranges, today is an NR7.
- The scanner also shows Day range % = (High − Low) ÷ Close. This lets you compare a ₹200 stock with a ₹5,000 stock.
Example: Coal India, Monday 21 Sep 2026
On 21 Sep 2026 Coal India traded between ₹410.45 and ₹415.40 and closed at ₹414.70. The range was ₹4.95, or about 1.2% of the price, the narrowest of its last seven sessions. The day was also an inside bar (its high and low stayed inside the previous day’s), so it appeared in both NR7 tabs.
For the next day a trader would note two numbers: the NR7 high ₹415.40 and low ₹410.45. A move above the high suggests buyers are taking charge; a move below the low suggests sellers are. What actually happened is in the case studies below.
Prices are adjusted. The scanner uses NSE’s daily files adjusted for splits and bonuses, so a stock that split last month does not show a fake “huge range”. If your broker’s chart is not adjusted, older prices may look different.
Types of narrow-range setups
NR7 is one member of a small family of “quiet day” patterns. The scanner shows the first two directly; the rest you can build with its filters.
| Setup | Rule | What it suggests |
|---|---|---|
| NR7 | Narrowest range of the last 7 sessions | A quiet day. The scanner’s main tab. |
| NR7 + inside bar (NR7-ID) | NR7, and the day’s high and low sit inside the previous day’s | An even tighter coil. The scanner’s second tab. |
| NR4 | Narrowest of the last 4 sessions | A milder version, more common. Not listed separately; every NR7 is also an NR4. |
| NR7 near a 52-week high | NR7 and the close within 2% of the 52-week high | A pause just under a big level. Use “Combine with → At / near 52-wk high”. |
| NR7 in a trend | NR7 and the close above the 200-day average (200-DMA) | A rest inside a long-term uptrend. Use “Trend → Above 200-DMA”. |
Two words you will see a lot
- Range expansion: the day after a quiet day turns out to be a busy day with a wide range. This is what NR7 traders hope for.
- Breakout / breakdown: the price moves above the NR7 high (breakout) or below the NR7 low (breakdown).
Why traders watch NR7: advantages and limits
✅ Clear levels
The NR7 high and low give you an exact trigger and an exact stop. Because the range is small, the stop is close, so the risk per share is small.
✅ Fast shortlist
Out of about 200 F&O stocks, a typical evening has 10 to 80 NR7s. On 6 Nov 2026 there were 17, of which 11 were also inside bars.
✅ Combines well
Filters for trend, RSI, volume, 52-week high and sector let you keep only the NR7s that fit your plan.
✅ Objective
No opinion is involved. Everyone computing NR7 gets the same list and the same levels.
The limits: what our own data says
We rebuilt the scanner’s list for every session from 27 Oct 2025 to 6 Nov 2026 (256 trading days) for 217 F&O stocks, using the same adjusted data and the same code, and checked what happened next. That gave 8,228 NR7 setups, compared against all 54,852 stock-days.
| Next day… | After an NR7 | NR7 + inside bar | Any stock, any day |
|---|---|---|---|
| Range wider than the stock’s own 10-day average | 34.6% | 35.5% | 42.2% |
| Average size of the close-to-close move | 1.37% | 1.38% | 1.46% |
| Moved 2% or more | 22.4% | 22.8% | 24.8% |
| Traded above the NR7 high | 57.2% | 56.7% | – |
| Traded below the NR7 low | 61.3% | 63.2% | – |
| Broke both the high and the low | 21.5% | 22.5% | – |
| Closed above the NR7 high | 28.1% | 27.2% | – |
| Closed below the NR7 low | 33.2% | 35.6% | – |
In plain words:
- An NR7 did not lead to a bigger next day. In this period the day after an NR7 was, on average, slightly calmer than a normal day. Quiet tends to be followed by more quiet in the short run.
- The levels get crossed most days, because the range is so small. One day in five crossed both sides, which means a trader using both triggers would have been stopped on one of them.
- No direction edge. After a close above the NR7 high, the next four days averaged −0.12% (44.8% were up). After a close below the low, they averaged +0.16%. Measured against the average F&O stock on the same days, NR7 stocks did neither better nor worse over 5 and 20 days.
- A larger ChartMine study of all liquid NSE stocks (Oct 2024 to Mar 2026) found the same thing from another angle: stocks on an NR7 day moved 5%+ the next day 3.7% of the time, against 4.6% for any stock.
So how should you use it? As a watchlist with ready-made levels, not as a signal. The quiet phase often comes before a move, but the timing is unknown and the first break is often false. Any edge comes from what you add: the market’s direction, the trend filter, volume on the breakout day, a stop loss and small position size.
A tour of the scanner screen
Open the NR7 stocks scanner. The screen has four parts: the date and tabs at the top, the filters, the results table and the explanation cards below it.

- 1Scan for: pick a scan date; the latest is first.
- 2All NR7: every instrument with the narrowest range of 7 sessions.
- 3NR7 + inside bar: the tightest setups.
The number in each tab is how many instruments match after your filters, so it changes as you click. A sudden jump to 80 or more NR7s means the whole market had a quiet day; individual setups are less special on such days.
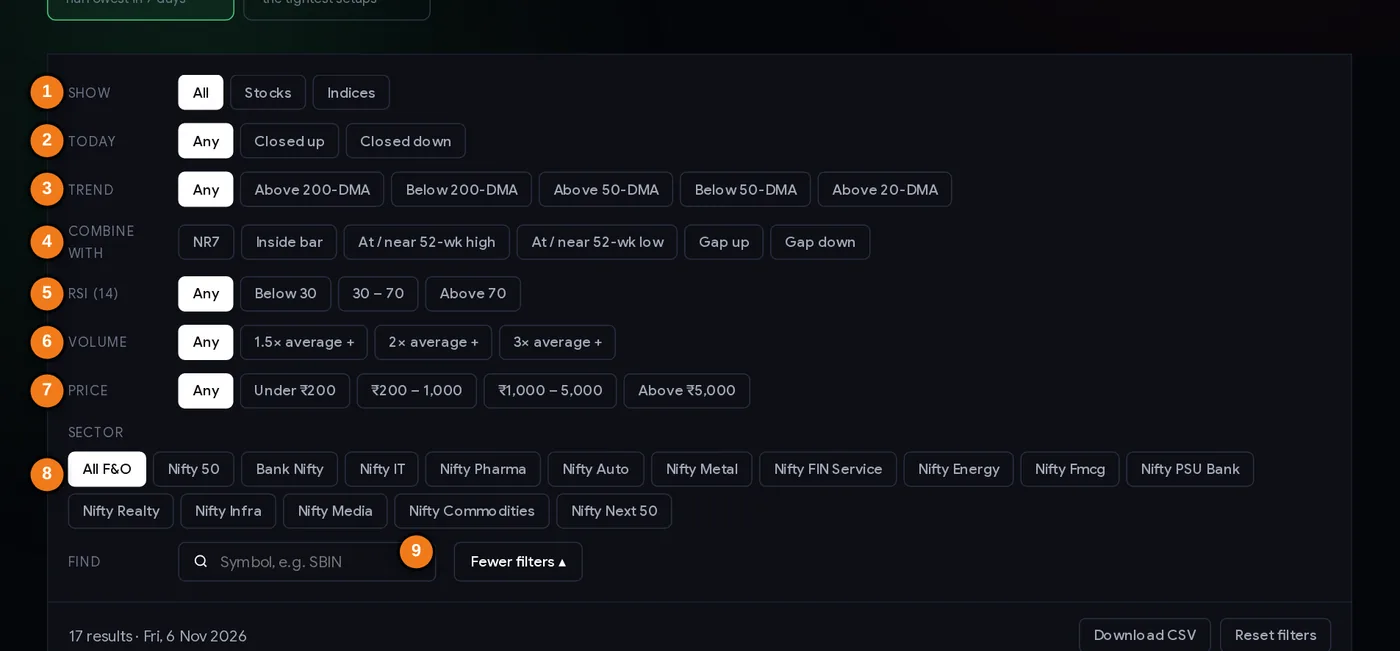
- 1Show: stocks or indices
- 2Today: closed up or down
- 3Trend: versus the 20-, 50- or 200-day average
- 4Combine with another setup
- 5RSI (14)
- 6Volume versus the 20-day average
- 7Price band
- 8Sector (index membership)
- 9Find a symbol
The filters
- Show: all, stocks only or indices only (NIFTY, BANKNIFTY, FINNIFTY, SENSEX).
- Today: keep only stocks that closed up or down on the NR7 day.
- Trend: where the close sits against the 20-, 50- or 200-day simple moving average (DMA = daily moving average).
- Combine with: add a second setup. You can switch on several; a stock must match all of them.
- More filters opens RSI (14), volume versus the 20-day average, price band and sector (index membership such as Bank Nifty or Nifty IT).
- Find jumps to a symbol. Your filters are saved in the page address, so you can bookmark a view.
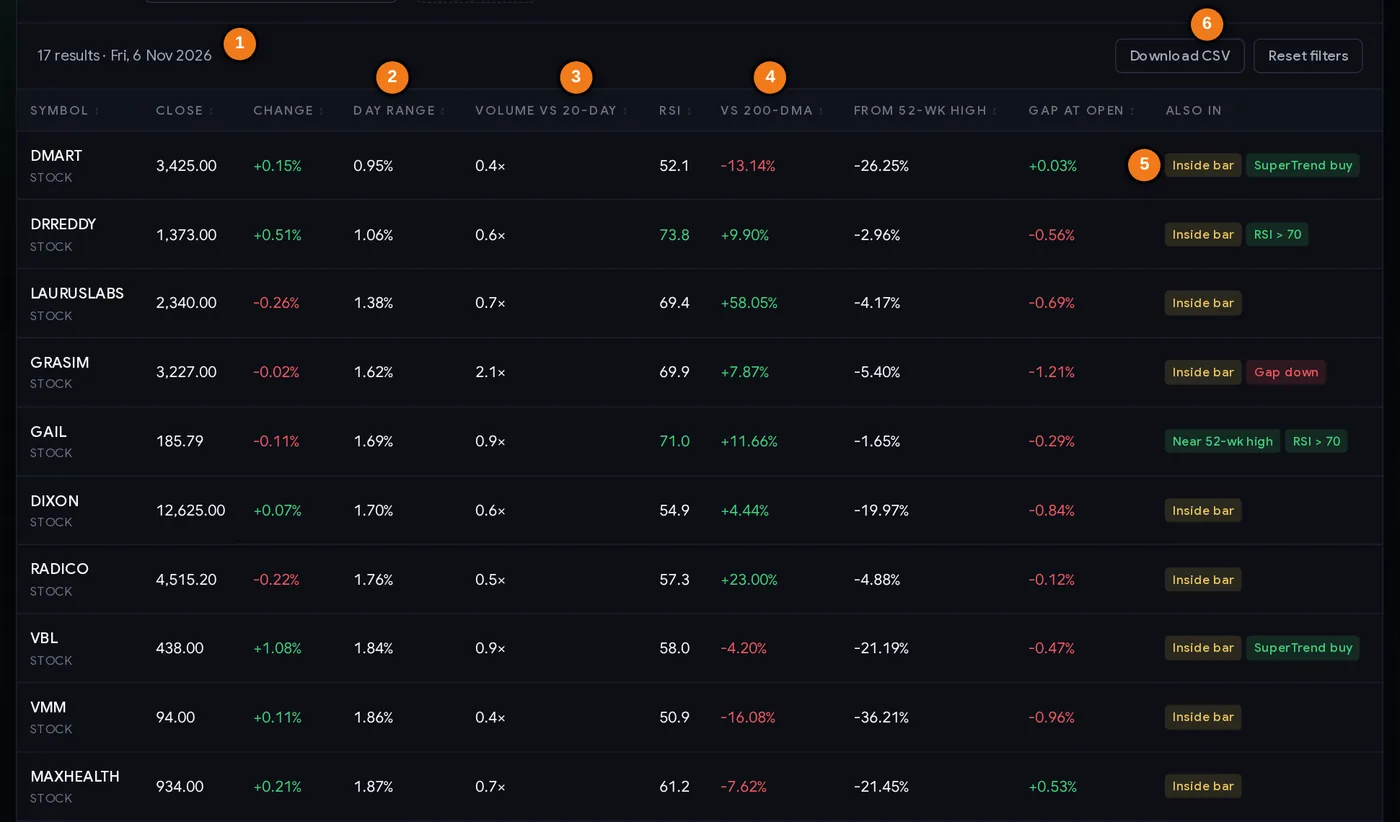
- 1Result count and scan date
- 2Day range %
- 3Volume versus the 20-day average
- 4Distance from the 200-day average
- 5Other scans the stock matched today
- 6Download the list as CSV
Every column explained
| Column | What it tells you |
|---|---|
| Symbol | The stock or index. |
| Close / Change | The closing price and the % change from the previous close. |
| Day range | (High − Low) ÷ Close. The table is sorted by this, tightest first. Click any header to sort by it. |
| Volume vs 20-day | Today’s volume divided by the 20-day average. 0.5× means half the usual volume, normal on quiet days. |
| RSI | 14-day Relative Strength Index. Below 30 is called oversold, above 70 overbought. See the RSI tutorial. |
| vs 200-DMA | How far the close is above (+) or below (−) the 200-day average: a quick long-term trend check. |
| From 52-wk high | How far below the 52-week high the stock closed. |
| Gap at open | Today’s open versus yesterday’s close. |
| Also in | Other scans the stock matched today: inside bar, 52-week high, gap, RSI, golden cross, SuperTrend. |
Download CSV saves the filtered list for your spreadsheet. Reset filters clears everything except the tab and sort.
Step by step: a 10-minute evening routine
- After about 8 PM, open the scanner. The scan runs after NSE publishes its daily file (around 7:45 PM IST) and the page shows the latest date first. Check the date in the “Scan for” box.
- Look at the tab count. 10 to 40 NR7s is normal. If almost everything is NR7 (a holiday-shortened or very quiet session), expect little from individual setups.
- Pick the tab. “NR7 + inside bar” gives fewer, tighter setups; “All NR7” gives more choice.
- Add a trend filter. Many traders only look for upside breaks above the 200-DMA and downside breaks below it, so the trade goes with the long-term trend.
- Check “Also in” and RSI. An NR7 near a 52-week high is a different story from an NR7 after a long fall with RSI near 30.
- Remove event risk. Look at the results calendar and board meetings. A results announcement can blow through any level.
- Shortlist 3 to 5 names and write down for each: NR7 high, NR7 low, your plan, and the price at which you are wrong.
- Size the trade before the open with the position size calculator, using the distance between your entry and stop.
Three playbooks
Playbook A: the trend-side breakout
- Use only NR7s above the 200-DMA (for upside) or below it (for downside).
- Next day, wait for the first 15–30 minutes. Act only if a candle closes above the NR7 high (or below the low for the bearish mirror). A brief poke that falls back is not enough.
- Stop loss: the other side of the NR7 day (below its low for a long trade). Because the range is narrow, this stop is close.
- First target: 1.5 to 2 times your risk. Our data shows follow-through is not reliable, so many traders book part of the position there and trail the rest.
Playbook B: the failed break (fade)
One NR7 in five broke both sides the next day. Some traders look for exactly that: the price breaks the NR7 high, fails, and closes back inside the range. They treat that failure as a sign of weakness and plan a trade toward the NR7 low, with a stop above the day’s high. This is an advanced idea; practise it on paper first.
Playbook C: a swing entry with a tight stop
Investors and swing traders who already like a stock (for its trend or fundamentals) use an NR7 simply as a low-risk entry point: a buy above the NR7 high with a stop below the NR7 low risks only one quiet day’s range. If the stop is hit, the loss is small and they wait for the next setup.
Always decide the loss first. For example, risk 0.5% of your capital per trade: with ₹2 lakh capital that is ₹1,000. If your stop is ₹5 away, the size is 200 shares, whatever the setup looks like.
Case studies from the scanner’s history
Four real NR7 setups from 2026, chosen to show the clean, the messy and the bad. Prices in ₹, from NSE’s daily files.
1. Coal India, 21 Sep 2026: the clean break
NR7 and inside bar. High 415.40, low 410.45, close 414.70. The next day the stock opened at 424.70, already above the NR7 high, traded between 419.65 and 428.75 and closed at 428.00 (+3.2%). It never came near the low. Note that the gap meant you could not buy at the NR7 high; anyone entering at the open paid 9 rupees more and had a wider stop. Twenty sessions later the stock was 1.7% below the NR7 close: the move did not last.
2. Adani Ports, 11 Sep 2026: both sides in one day
NR7 and inside bar, high 1,771.90, low 1,750.80. Next day it opened at 1,791.40, above the high, then fell all day to close at its low of 1,713.80 (−2.9%). A buy at the open (1,791.40) with a stop just below the NR7 low (1,750.80) was stopped out the same day for a loss of about 2.3%, almost double the 1.2% NR7 range the trader had planned around. Lesson: a gap through the level can trap traders; waiting for a candle to close and hold above the high would have kept you out.
3. BPCL, 7 Oct 2026: a breakdown that reversed later
NR7 and inside bar, high 298.65, low 294.75, and the stock was below its 200-DMA. The next day it broke down, trading as low as 282.95 and closing at 286.25 (−3.4%). The bearish mirror of Playbook A worked for the day. But 20 sessions after the NR7 the stock was 7% above the NR7 close. Lesson: an NR7 trade is a short-term trade; manage it with targets and a trailing stop rather than holding on hope.
4. Apollo Hospitals, 26 Aug 2026: the non-event
NR7 and inside bar, high 8,868, low 8,763.50. The next day’s high was exactly 8,868 and its low 8,758.50, just ₹5 below the NR7 low, and it closed at 8,800 (+0.4%). Nothing happened. This is the most common outcome in our data: the day after an NR7 is usually quiet too.
Common mistakes
- Treating NR7 as a buy signal. It is direction-neutral. Our data showed no up or down edge.
- Expecting a big day tomorrow. The next day was a wide-range day only about a third of the time, less often than average.
- Entering on the first tick above the high. One setup in five breaks both sides. Wait for a candle close.
- Ignoring gaps. If the stock opens far beyond the level (Case 1, Case 2), your planned entry and stop no longer exist. Re-plan or skip.
- Forgetting results and news. Quiet days often come just before a results announcement; the move that follows can jump your stop.
- Trading every name on the list. On a market-wide quiet day the list can have 70+ names. Filter hard.
- No stop because “the range is small”. Small ranges do not mean small risk once a gap is involved.
Pre-trade checklist
- The scan date is the latest trading day and the total NR7 count looks normal.
- The setup agrees with the trend you trade (200-DMA filter).
- No results, board meeting or big event before your planned exit.
- NR7 high, NR7 low and your stop are written down.
- Entry only after a candle closes beyond the level, not on a brief poke.
- If it opens far beyond the level, re-plan or skip.
- Position size calculated from the stop distance; total risk within your daily limit.
- Exit plan ready: first target and when you will trail or exit.
Glossary
| Range | High minus low for the day. |
| NR7 | Today’s range is the smallest of the last seven sessions. |
| NR4 | The smallest of the last four sessions. |
| Inside bar | A day whose high and low stay inside the previous day’s high and low. |
| NR7-ID | An NR7 day that is also an inside day. |
| Range expansion | A day with a much wider range than recent days. |
| Breakout / breakdown | Price moving above a level / below a level. |
| False break | Price crosses a level, then reverses back through it. |
| DMA | Daily moving average: the average closing price of the last N days (20, 50, 200). |
| Gap | The open is above (gap up) or below (gap down) the previous close. |
Questions
What are NR7 stocks?
Stocks whose daily range (high minus low) was the narrowest of the last seven trading sessions. ChartMine lists every F&O stock and index with an NR7 day after each close, with trend, RSI and volume next to each name.
How do you trade the NR7 pattern?
Most traders mark the NR7 day’s high and low, wait for a candle to close beyond one of them the next day, and place the stop on the other side. In ChartMine’s 256-day study the first break was often false and there was no direction edge on its own, so a trend filter, a stop loss and small size matter more than the pattern.
Does NR7 predict a big move?
Not on its own. In 8,228 NR7 setups from Oct 2025 to Nov 2026, the next day was a wide-range day 34.6% of the time, against 42.2% for any stock on any day. The quiet phase can come before a move, but the timing is unpredictable.
What is the difference between NR7 and an inside bar?
NR7 compares today’s range with the last seven days. An inside bar compares today with only yesterday: today’s high and low sit inside yesterday’s. A day can be both; the scanner’s “NR7 + inside bar” tab lists those.
When is the NR7 scanner updated?
Every trading day after NSE publishes its end-of-day file, usually by about 8 PM IST. The last 15 to 30 scans can be opened from the date box.
Is NR7 better for intraday or swing trading?
It is built on daily candles, so it is used for next-day intraday trades and short swing trades of a few days. The NR7 high and low act as the trigger and stop levels.
What is NR4 vs NR7?
NR4 is the narrowest range of the last four days, NR7 of the last seven. NR7 is rarer and tighter; every NR7 is also an NR4.