
☰ All tutorials
Start here
Tool tutorialsHow to trade with ChartMineStocks
Stock monitorMy watchlistStock scores & checklistMarket & sectors
Nifty 50Bank NiftySensexFin NiftyDaily market reportMarket breadthSector rotationSector heatmapStock screenerRelative strength (RS)MCX commodity pricesFear & Greed IndexWhat happens after…Scanners
Top gainers & losersStocks to watch tomorrowNR7 stocks scannerInside bar stocks52-week high stocksGap up & gap down stocksRSI oversold stocksGolden cross stocksSuperTrend buy stocksScan builderEMA 9/21 crossoverMACD crossoverADX strong trendBollinger breakout / squeezeVolume spike stocksOpen = high / open = lowCandlestick pattern scannerNarrow CPR scannerF&O data
F&O ban listOI build-upOption chainPCR & max painExpiry calendarF&O lot sizesOI build-up heatmapPCR trendMax pain trendFutures basisStock screens
Quarterly growersProfit growth stocksLow P/E stocksMutual fund buyingNear 52-week low, growingDebt-free companiesHigh ROE & ROCEMagic Formula stocksLow price-to-bookSmart money
FII / DII dataShareholding changesBig-money footprintShort selling dataF&O positions by participantBulk & block dealsPromoter buyingDelivery percentageCalendars
Results calendarQuarterly results trackerBoard meetingsCorporate actionsIPO calendarIPO performanceResearch & planning
Strategy testerCompare stocksDividend yield stocksASM / GSM listExpiry-day movesSeasonality & stock historyNSE holidays 2026Position size calculatorOption payoff calculatorPivot point calculatorMore
Stock scanners hubStock screensHow to use the Profit growth stocks list
A plain-language guide to profit growth: how it is measured, where growth comes from, how to read every column of the list, three playbooks, real case studies and what happened to high-growth stocks in our own test.
What the profit growth list is, in plain words
Over the long run, a share price tends to follow the company’s profits. If a business earns twice as much in a few years, its shares are usually worth more too. That is why investors watch profit growth more closely than almost any other number.
The Profit growth stocks page lists NSE companies whose net profit in the latest quarter was at least 25% higher than in the same quarter a year earlier. On 9 Nov 2026 (prices of 6 Nov), 450 stocks passed; the page shows the top 150, sorted from the highest growth down.
Why the same quarter a year earlier, and not the quarter just before? Because many businesses are seasonal. An air-conditioner maker sells most in April–June; a fertiliser company in the monsoon. Comparing June with June removes those swings.
One line to remember: high profit growth tells you a company had a very good quarter compared with last year. It does not tell you why, whether it will last, or whether the share price already reflects it. Use the list to choose what to research; ChartMine is not a SEBI-registered adviser.
How profit growth is measured (with a real example)
The formula is simple:
| Number | Formula |
|---|---|
| Profit YoY | (This quarter’s net profit ÷ same quarter last year − 1) × 100 |
| Sales YoY | (This quarter’s sales ÷ same quarter last year − 1) × 100. Banks and lenders: total income. |
Example: SBI, September 2026 quarter
From SBI’s filings with NSE: net profit ₹25,741 Cr in the September 2026 quarter against ₹21,504 Cr in September 2025. Growth = 25,741 ÷ 21,504 − 1 = +19.7%. That is healthy for India’s largest bank, but below 25%, so SBI was not on this list.
From sales to net profit in 60 seconds
A results filing walks down from sales to profit. Hindustan Zinc’s September 2026 quarter (₹ crore, from its filing with NSE) is a clear example:
| Line | ₹ Cr | What it means |
|---|---|---|
| Revenue from operations (sales) | 15,093 | Money from selling zinc, lead, silver and other products. |
| Total income | 15,467 | Sales plus other income such as interest on cash. |
| Finance cost | 88 | Interest paid on borrowings. |
| Depreciation | 962 | The yearly wear of machines and mines, spread over their life. |
| Profit before tax | 8,572 | What is left after all expenses, before tax. |
| Net profit | 6,412 | After tax: the number the profit growth list compares. |
When profit grows much faster than sales, one of the lines in between moved: costs fell, other income rose, interest dropped or tax changed. Knowing which line moved tells you whether the growth can repeat.
What “net profit” the page uses
Many companies own subsidiaries partly. The page uses the profit that belongs to the company’s own shareholders (after removing the share owed to minority partners), from consolidated results where the company files them. If that figure looks mistagged in a filing, the page falls back to total profit.
The exact rules
- Latest quarter’s profit at least 25% above the same quarter a year earlier.
- Both quarters profitable: growth from a loss to a profit cannot be measured as a %.
- Year-ago profit at least ₹10 crore, so tiny bases do not fill the list.
- Sales growth available, and market value at least ₹500 crore.
- A sales jump of more than 6× is treated as a unit error in a filing and left out.
Types of profit growth: good, lucky and misleading
A 25% profit rise can come from very different places. Learning to tell them apart is the most useful skill this list can teach you.
| Source | What you see | How durable |
|---|---|---|
| More sales | Sales and profit up by similar amounts. | Usually the most durable. |
| Better margins | Profit up much more than sales: prices raised, costs fell, raw materials cheaper. | Depends on why. Raw-material swings can reverse. |
| Recovery from a bad year | Profit up hundreds of %, sales up modestly. | Real, but the % flatters; compare with two years ago. |
| One-time gain | Profit jumps in one quarter, sales flat; “exceptional item” in the filing. | Not repeatable. |
| Lower tax or interest | Operating profit flat, net profit up. | Partly durable (debt repaid) or not (tax refund). |
Real examples from the page on 9 Nov 2026
- Bandhan Bank: profit +456% YoY with income up only about 9% (₹622 Cr against ₹112 Cr a year earlier). The September 2025 quarter was weak, so this is mostly a recovery.
- Paytm: profit +976% (₹226 Cr against ₹21 Cr), sales +28%, P/E 134. A business that only recently turned profitable shows huge % numbers.
- Bharat Dynamics: profit +547% and sales +131% for the June 2026 quarter, yet the share was 31% lower than a year earlier. Results and price can point in different directions.
Why investors watch profit growth: advantages and limits
✅ The number markets care about
Over years, profits drive share prices more than anything else.
✅ Seasonality removed
Comparing with the same quarter last year makes very different businesses comparable.
✅ Sales shown alongside
You can spot at a glance whether growth came with more business or not.
✅ Filters tiny bases
The ₹10 crore floor keeps most “₹1 crore to ₹5 crore = +400%” cases out.
The limits
- One quarter only. The list does not check the quarters before. Use Quarterly growers for consistency.
- Base effects remain. ₹10 crore to ₹150 crore is still +1,400%.
- No valuation check. The P/E column is shown, not filtered.
- News arrives first. By the time results are filed and the list updates, the price has often reacted already. See results-day moves.
Did high profit growth lead to better returns? Our test
We rebuilt the list for two past dates using only filings made before each date, then measured each share’s change to 6 Nov 2026 (adjusted for splits and bonuses). For comparison: all NSE stocks above ₹500 crore with fundamentals, and the stocks whose profit fell.
| Start date (quarter) | Group | Stocks | Median change | Share that rose |
|---|---|---|---|---|
| 1 Jun 2026 (Mar 2026 vs Mar 2025) | Profit +25% or more | 393 | +0.9% | 52% |
| Profit fell | 370 | −2.4% | 44% | |
| All stocks | 1,366 | −1.5% | 48% | |
| 18 Aug 2026 (Jun 2026 vs Jun 2025) | Profit +25% or more | 427 | −6.0% | 31% |
| Profit fell | 343 | −8.8% | 24% | |
| All stocks | 1,363 | −6.6% | 30% |
In plain words: companies with strong profit growth did a little better than companies whose profit fell (about 3 points), but only about half a point to 2.5 points better than the average stock. In the August-to-November period most stocks fell, and the growth list fell with them. A good quarter on its own was a weak guide to the next few months. What you add (checking the source of growth, the trend, the price) matters more.
A tour of the Profit growth page
Open Profit growth stocks. The page has a heading with three facts, the table, three reminder cards and links to the other screens.

- 1How many stocks pass (the table shows the top 150).
- 2Date of the prices used.
- 3Fundamentals come from each company’s latest filed quarter.
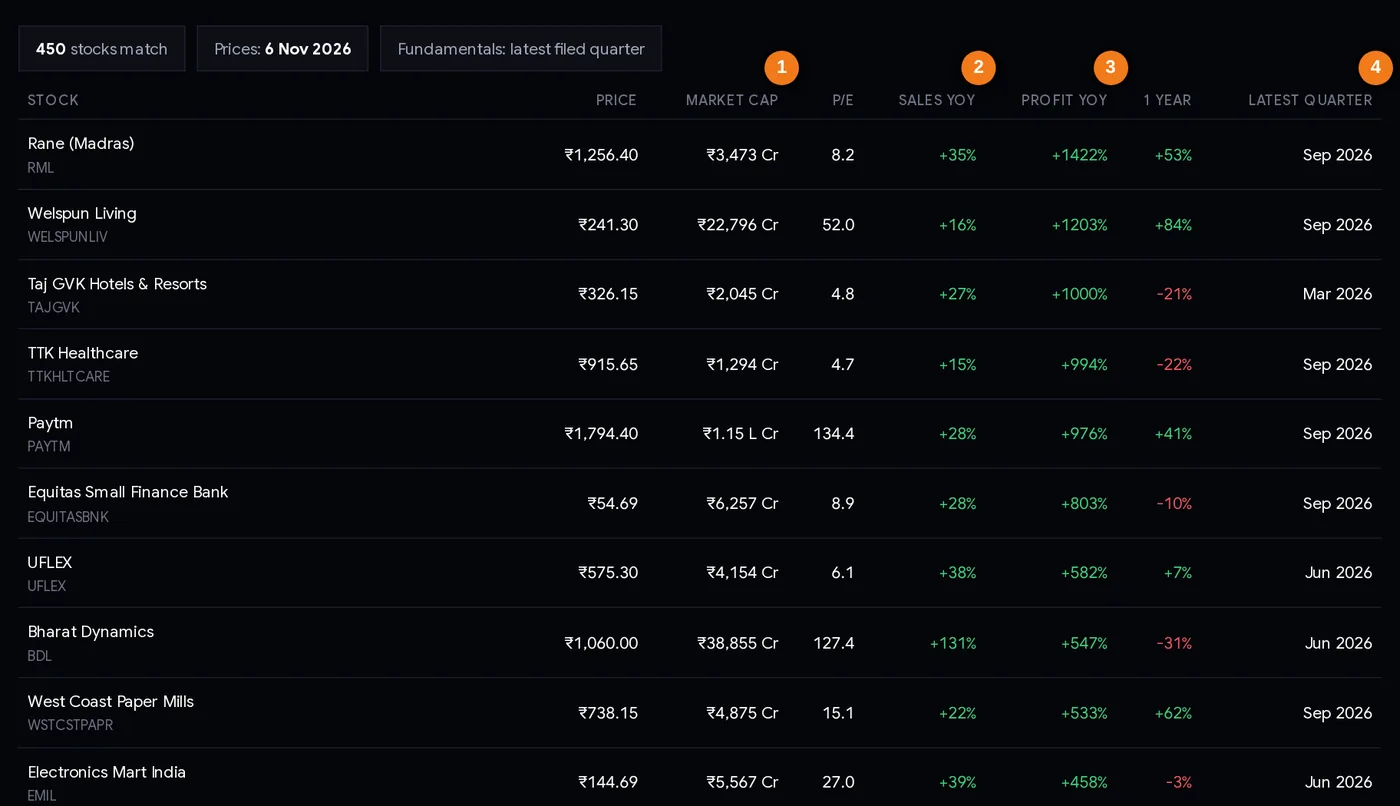
- 1Market cap: watch for small companies with big %.
- 2Sales growth: did the business grow?
- 3Profit growth (sort order, 25% minimum).
- 4Which quarter is compared.
Every column explained
| Column | How to read it |
|---|---|
| Stock | Name and NSE symbol; click for the stock page with eight quarters of bars. |
| Price | Last close. |
| Market cap | Company value in ₹ crore (L Cr = lakh crore). Helps you spot small companies with big %. |
| P/E | Price ÷ last four quarters’ earnings per share. Strong growth with a P/E of 8 and with a P/E of 130 are very different situations. |
| Sales YoY | Did the business itself grow? Compare it with the next column. |
| Profit YoY | The sort order. 25% is the minimum to appear. |
| 1 year | Share price change over a year. Tells you whether the market already rewarded the growth. |
| Latest quarter | Which quarter the comparison uses. In results season, a stock can still show an older quarter (e.g. “Mar 2026”) until its new results are in; treat those rows as stale. |

Step by step: researching the list (20 minutes)
- Check the “Latest quarter” column and focus on the newest quarter. Old quarters are stale.
- Compare Sales YoY with Profit YoY. If profit grew more than three times faster than sales, find out why before going further.
- Look at market cap. Very small companies can swing wildly; decide your own minimum.
- Open the stock page and look at the profit bars for eight quarters. Is this quarter part of a rising line, or a spike?
- Read the filing for “exceptional items” or “other income” if the jump is big. One-time gains are not growth.
- Check the P/E against the sector on the stock page.
- Check how the price reacted on results-day moves. A big jump on the day means the news is known.
- Write down your reason and exit, and size the idea so a 30–50% fall would not damage your savings.
Three playbooks
Playbook A: growth backed by sales
Keep only rows where Sales YoY is at least 15% and Profit YoY is no more than about three times Sales YoY. This removes most one-off and recovery cases. What remains grew because the business sold more.
Playbook B: two good quarters in a row
Note the names this quarter. Next results season, check which ones are on the list again. Repeated 25%+ growth is far rarer, and far more meaningful, than one quarter. The Quarterly growers list does a version of this for you.
Playbook C: growth at a sensible price
Combine with the stock screener: profit growth min 25, revenue growth min 15, P/E max 25, market cap min 5,000. It gives a much shorter list that also passes a price check.
Always plan risk before acting. Our case studies include a company with +72% profit growth whose share fell 52% in five months.
Case studies from the list’s history
All three were on the list rebuilt for 1 Jun 2026 (March 2026 quarter against March 2025). Figures from NSE filings; prices from NSE’s daily files.
1. Cupid: growth that kept going
Profit ₹36.3 Cr against ₹11.5 Cr a year earlier (+215%); sales ₹120 Cr against ₹56.5 Cr (+112%). Both rose together, and the next quarter continued (June 2026: profit ₹44.2 Cr, sales ₹154.7 Cr). The share went from ₹129.09 on 1 Jun to ₹338.90 on 6 Nov 2026 (+163%). By then its P/E was 331. Lesson: sales-backed growth that repeats is the best case, and the market can price it very fully.
2. K.P. Energy: a strong March, a flat June
Profit ₹78.6 Cr against ₹45.8 Cr (+72%) and sales ₹632 Cr against ₹401 Cr (+57%): sales-backed, it looked solid. But March 2025 had also been its biggest quarter on file: the business is lumpy. In the June 2026 quarter profit was ₹26.2 Cr against ₹25.4 Cr a year earlier, only +3%. The share fell from ₹350.55 on 1 Jun to ₹166.75 on 6 Nov 2026 (−52%). Lesson: one strong quarter, even with sales growth, can be the peak of a lumpy year. Look at all eight bars.
3. PNC Infratech: lumpy profits
Profit ₹107.9 Cr against ₹75.5 Cr (+43%). But its quarterly profits over the year before had swung between ₹77 Cr and ₹431 Cr, common for construction companies whose results depend on project timing. The share fell from ₹207.07 on 1 Jun to ₹130.20 on 6 Nov 2026 (−37%), including a 20% fall on 15 Sep 2026. Lesson: for lumpy businesses, one quarter’s growth % says little. Compare full years.
Common mistakes
- Starting with the biggest %. The top rows are mostly base effects and recoveries.
- Ignoring sales. Profit growth with flat sales is often temporary.
- Ignoring the quarter column. “Mar 2026” rows in November are stale.
- Buying after the results jump. The price reacts on the day; you are often late.
- Forgetting seasonality inside the year. A seasonal peak quarter can be followed by a weak one.
- No exit plan. Case 2 fell 52% from a list that looked strong.
Checklist before you act
- The quarter shown is the latest one.
- Sales grew too, and profit growth is not wildly above sales growth.
- Eight quarterly bars show a rising line, not one spike.
- No one-time gain explains the jump (checked in the filing).
- P/E compared with the sector.
- Price reaction to the results checked.
- Reason, exit condition and position size written down.
Glossary
| Net profit | Profit after all costs, interest and tax, owed to the company’s own shareholders. |
| YoY | Year on year: same quarter last year. |
| Consolidated | Results including subsidiaries. |
| Minority interest | The part of a subsidiary’s profit owed to its other owners. |
| Exceptional item | A one-time gain or loss shown separately in results. |
| Other income | Income not from the main business, e.g. interest on cash. |
| Margin | Profit as % of sales. |
| Base effect | A huge % caused by a small number a year earlier. |
| Lumpy | Results that swing a lot from quarter to quarter. |
Questions
Which stocks have the highest profit growth in India?
ChartMine’s Profit growth page lists NSE stocks whose latest quarterly profit is up 25% or more on the same quarter a year ago, sorted by growth. On 9 Nov 2026, 450 stocks passed.
How is quarterly profit growth calculated?
This quarter’s net profit divided by the same quarter’s profit a year earlier, minus one. Both quarters must be profitable, and the page needs at least ₹10 crore of profit a year ago.
Why compare with the same quarter last year and not the last quarter?
Many businesses are seasonal. Comparing a quarter with the same quarter a year earlier removes the season, so the growth reflects the business, not the calendar.
Is high profit growth a reason to buy a stock?
Not by itself. In our test, stocks with 25%+ profit growth did only a point or two better than the average stock over the next months. Check where the growth came from and whether it repeats.
Why do some stocks show profit growth of over 1,000%?
Because last year’s profit in that quarter was small, often after a weak period. The sales growth column gives a better sense of how much the business changed.
When is the profit growth list updated?
With every site update; it changes as companies file quarterly results with NSE, mostly in results season.