
☰ All tutorials
Start here
Tool tutorialsHow to trade with ChartMineStocks
Stock monitorMy watchlistStock scores & checklistMarket & sectors
Nifty 50Bank NiftySensexFin NiftyDaily market reportMarket breadthSector rotationSector heatmapStock screenerRelative strength (RS)MCX commodity pricesFear & Greed IndexWhat happens after…Scanners
Top gainers & losersStocks to watch tomorrowNR7 stocks scannerInside bar stocks52-week high stocksGap up & gap down stocksRSI oversold stocksGolden cross stocksSuperTrend buy stocksScan builderEMA 9/21 crossoverMACD crossoverADX strong trendBollinger breakout / squeezeVolume spike stocksOpen = high / open = lowCandlestick pattern scannerNarrow CPR scannerF&O data
F&O ban listOI build-upOption chainPCR & max painExpiry calendarF&O lot sizesOI build-up heatmapPCR trendMax pain trendFutures basisStock screens
Quarterly growersProfit growth stocksLow P/E stocksMutual fund buyingNear 52-week low, growingDebt-free companiesHigh ROE & ROCEMagic Formula stocksLow price-to-bookSmart money
FII / DII dataShareholding changesBig-money footprintShort selling dataF&O positions by participantBulk & block dealsPromoter buyingDelivery percentageCalendars
Results calendarQuarterly results trackerBoard meetingsCorporate actionsIPO calendarIPO performanceResearch & planning
Strategy testerCompare stocksDividend yield stocksASM / GSM listExpiry-day movesSeasonality & stock historyNSE holidays 2026Position size calculatorOption payoff calculatorPivot point calculatorMore
Stock scanners hubStock screensHow to read F&O positions by participant
A plain-language guide to NSE’s participant-wise open interest: who FIIs, DIIs, pros and clients are, how the long short ratio works, how to read every chart, what our 580-session test found, and five real case studies.
What participant-wise open interest is, in plain words
Every futures or options contract has two sides: someone who is long (gains if the price rises) and someone who is short (gains if it falls). Open interest (OI) is the number of contracts still open at the end of the day, not yet closed or expired.
Every evening NSE’s clearing corporation publishes a file that splits this open interest into four groups of traders and shows how many contracts each group holds long and short. This is called participant-wise open interest. It answers a question every trader asks: who is betting on a rise, and who is betting on a fall?
The F&O positions by participant page turns that file into four headline cards and three long-history charts, every trading day since July 2024 (580 sessions up to 6 Nov 2026).
One line to remember: the page shows how the big groups are positioned after the close. Positions follow the market at least as much as they lead it, so read them as context, not as a forecast.
The most quoted number is the FII long short ratio, also called FII long % in index futures: FIIs’ long index futures contracts divided by all their index futures contracts. On 6 Nov 2026 FIIs held 48,656 long and 1,49,072 short contracts, so they were 24.6% long: roughly one long for every three shorts.
The four participants
| Group | Who they are | What their positions often reflect |
|---|---|---|
| FII (FPI) | Foreign portfolio investors: overseas funds, hedge funds, foreign banks. | They own a lot of Indian shares. Selling index futures is a cheap way to hedge (protect) those holdings, so FIIs are often net short index futures even when they are not bearish on their shares. |
| DII | Indian mutual funds, insurers such as LIC, pension funds, banks. | Small in index futures. Huge short stock futures because mutual-fund arbitrage schemes buy shares and sell the futures at the same time (a hedged trade, not a bearish bet). |
| Pro | Proprietary desks: brokers and trading firms using their own money. | Fast, often short-term, arbitrage and option-writing strategies. Their long % swings around 50%. |
| Client | Everyone else trading through a broker: retail traders, wealthy individuals (HNIs), companies. | Shown as “Retail” on the charts. Usually net long index futures and net short index puts. |
It is a zero-sum table
Because every contract has a buyer and a seller, the four groups’ longs always add up to exactly the same number as their shorts. On 6 Nov 2026 both totals were 3,13,039 index futures contracts. So if FIIs are heavily short, the other three groups together must be equally long. In practice it is mostly clients on the other side: on 6 Nov 2026 FIIs were net short 1,00,416 contracts and clients net long 83,781.
What is “normal” for each group
Median index-futures long % over the 580 sessions: FII 16.1%, Pro 50.8%, DII 66.9%, Client 69.0%. FIIs were below 20% long on 62% of all days, and on 78% of days since January 2025. A low FII reading is the usual state, not an emergency.
Long, short, net and long %: the numbers explained
| Term | How it is calculated | Example (FII, 6 Nov 2026) |
|---|---|---|
| Index futures long | Open contracts that gain if the index rises. | 48,656 |
| Index futures short | Open contracts that gain if the index falls. | 1,49,072 |
| Net index futures | Long − short. Above zero = net long. | −1,00,416 |
| Long % (long-short ratio) | Long ÷ (long + short) × 100. | 24.6% |
| Net index calls | Index call contracts bought − sold. | −1,27,624 (more calls sold) |
| Net index puts | Index put contracts bought − sold. | +4,49,741 (more puts bought) |
Some websites express the same thing as a ratio, for example long ÷ short = 0.33. It carries the same information as 24.6% long.
Three details beginners miss
- Contracts, not rupees. The file counts contracts across all NSE index futures together (NIFTY, BANK NIFTY and the other indices). It does not tell you the rupee value or which index.
- Options are not a simple bet. Buying a put can be a bearish bet or insurance on a portfolio. FIIs were net buyers of index puts on 98% of the 580 days, and clients net sellers of index puts on 99%. The sign is structural; only big changes carry information.
- Expiry days distort the picture. On monthly expiry the expiring contracts disappear. On the 22 monthly expiry days we identified in the history, FII long % moved by 5.6 points on average, against 1.4 points on other days. Always compare with the session after expiry before drawing conclusions.
Why traders watch it: advantages and limits
✅ See the big bets
Cash-market data shows what institutions bought today; this shows what they are holding in derivatives, often far larger bets.
✅ Spot crowded positions
When one group is extremely long or short, a move against it can force fast covering (short covering or long unwinding).
✅ Official, daily, free
Straight from NSE’s clearing corporation every evening; history since 2024 on one page.
✅ Explains sharp moves
A fast rally while FIIs cut shorts tells you the move was partly forced buying, not only fresh optimism.
The limits: what our tests found
We tested all 580 sessions (8 Jul 2024 to 6 Nov 2026) against NIFTY 50 closes. Base rate: NIFTY was higher 5 sessions later on 48% of days, and 20 sessions later on 53%.
| Situation | Days | NIFTY up 5 sessions later | Up 20 sessions later |
|---|---|---|---|
| All days (base rate) | 576 | 48% | 53% |
| FII long % below 15% (“heavily short”) | 262 | 48% | 57% |
| FII long % 15–20% | 97 | 42% | 53% |
| FII long % 50–70% | 41 | 71% | 73% |
| FII long % above 70% | 21 | 43% | 29% |
| FIIs cut net shorts by 50,000+ contracts in 5 sessions | 76 | 53% | 36% |
| Clients 80%+ long | 34–47 | 47% | 35% |
- “FIIs are very short, so a rally is due” did not hold. Below 15% long, NIFTY behaved almost exactly like any other day.
- The level of FII long % had no link with future returns: correlation −0.01, −0.02 and −0.06 with the next 1, 5 and 20 sessions.
- Daily changes are a mirror of the day’s move. FII net index futures rose on up days and fell on down days 74% of the time (same day), but their link with the next day was just 0.05.
- Big short covering came after the rally. When FIIs cut 50,000+ net shorts in five sessions, NIFTY had already risen in 92% of those cases (+1.97% on average). The next 20 sessions were up only 36% of the time.
- The 50–70% and above-70% rows look dramatic but come only from July 2024 to May 2025, when FIIs were often net long, and the client 80%+ days all fall between June and October 2026. Small, clustered samples like these are not evidence.
So how should you use it? To understand who is driving a move and whether positions are crowded, and as one input in your own analysis. Not as a timing signal on its own. Past patterns are not a forecast.
A tour of the page
Open F&O positions by participant. It has four cards at the top and three charts.

- 1FII: index futures long %, net contracts and the 5-session change.
- 2Pro: proprietary traders.
- 3Retail (Client): retail, HNIs and companies.
- 4DII: mutual funds, insurers, pension funds.
Each card shows one group’s index futures long % (red when below 50%, green above), its net contracts, and how much that net changed over the last five sessions. On 6 Nov 2026 the FII card read “25% long, net −1,00,416; +1,40,337 in 5 sessions”: FIIs still held far more shorts than longs, but had cut their net short by 1.4 lakh contracts in a week.
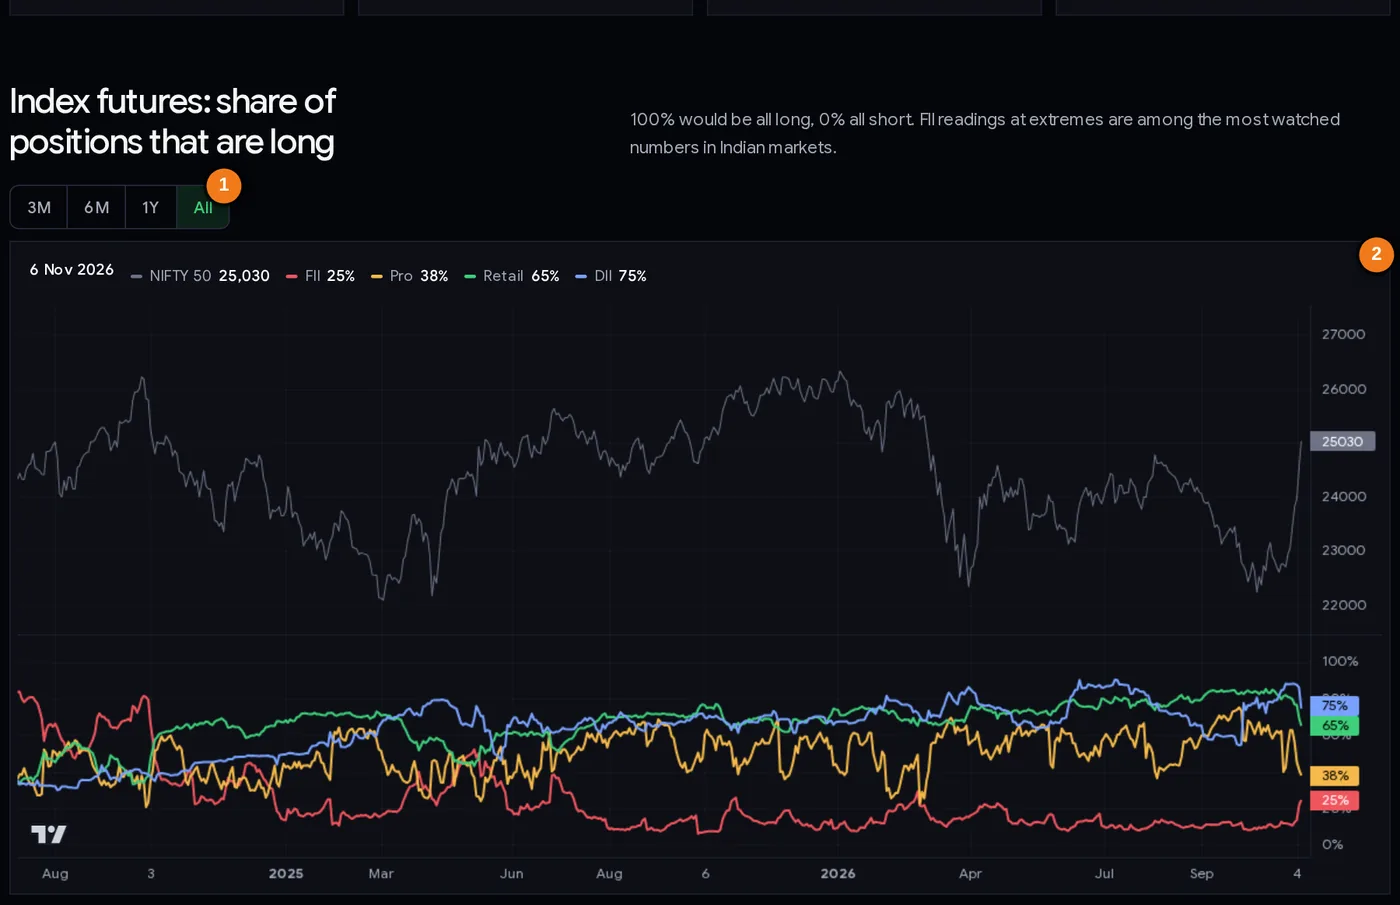
- 1Range buttons: 3M, 6M, 1Y or All.
- 2Legend with the date and each line’s value; hover the chart to read any day. NIFTY 50 is in the top panel.
Chart 1: share of positions that are long
The top panel draws NIFTY 50 in grey for reference. The lower panel has one line per group (FII red, Pro orange, Retail green, DII blue) on a 0–100% scale, with the latest values in coloured tags on the right. Use the 3M / 6M / 1Y / All buttons to change the period; the screenshot shows All, back to July 2024. Hover the chart to read each group’s value on any date in the legend at the top.
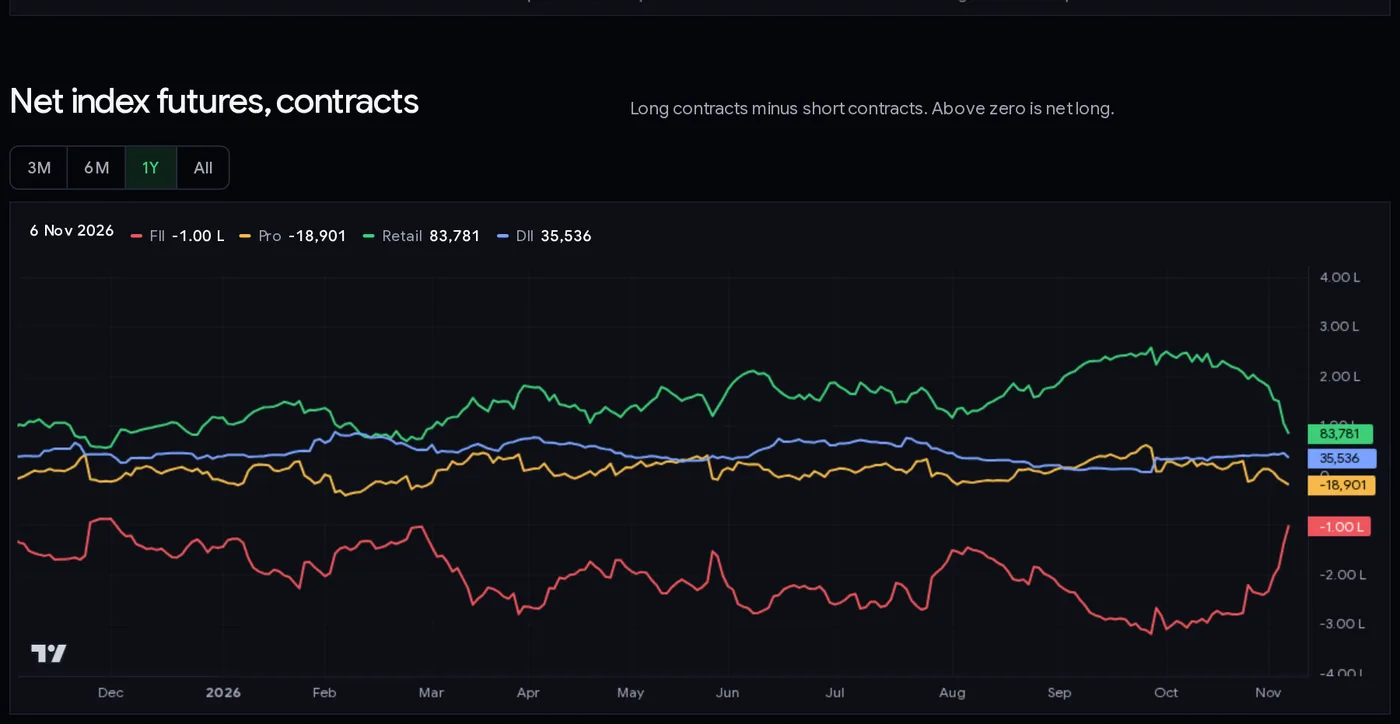
Chart 2: net index futures
Long minus short, in contracts, for each group. Above the zero line is net long. Because the table is zero-sum, the FII and Retail lines usually mirror each other. On the axis, “L” means lakh contracts (−1.00 L = −1,00,000). This chart is better than long % for seeing the size of a bet: 25% long on a small book and 25% long on a huge book are very different positions.
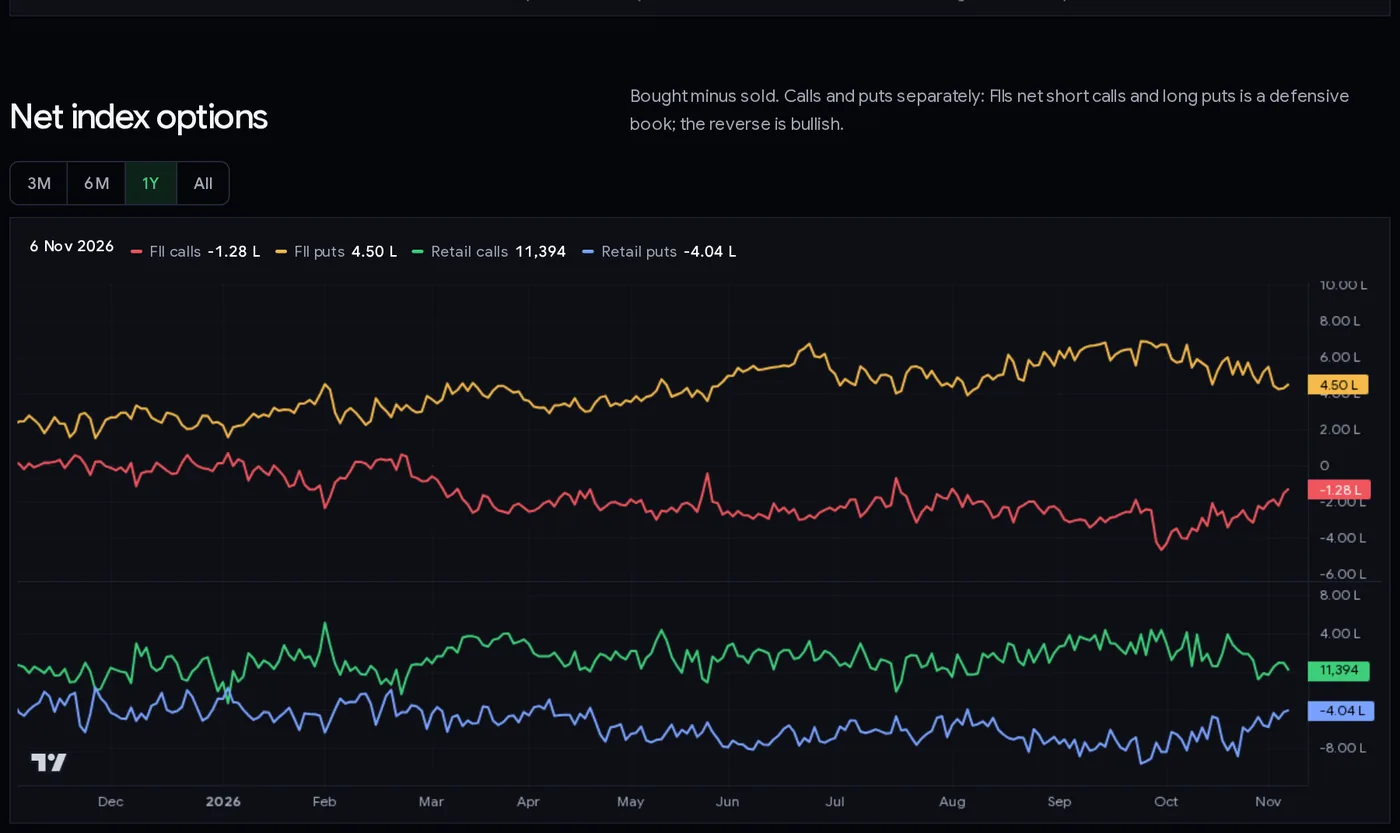
Chart 3: net index options
Calls and puts bought minus sold: FIIs in the top panel, Retail in the lower panel. FIIs net long puts and short calls is a defensive book (protection against a fall); the reverse is more bullish. Remember that FIIs are net long puts almost every day, so watch the change rather than the sign.
| Part of the page | What it tells you |
|---|---|
| Cards | Latest long %, net contracts and 5-session change per group. |
| Long % chart | How bullish or bearish each group’s futures book is, over time. |
| Net futures chart | The size of each group’s net bet in contracts. |
| Net options chart | FII and Retail call and put positions (bought − sold). |
| Range buttons | 3 months, 6 months, 1 year (default) or all history. |
The latest table with DII and Pro options and stock futures is also at the bottom of the FII / DII data page.
Step by step: a 10-minute evening routine
- After about 7:30 PM, open the page. ChartMine collects NSE’s participant file at about 7:10 PM and again around 9:40 PM on weekdays and the page is refreshed in the evening. The date of the latest data appears in the answer to “What does FII index futures long % mean?” under the charts.
- Read the FII card first. Is the long % unusual compared with the last six months (switch the chart to 6M)? Is the 5-session change big?
- Check whether today was an expiry day. Use the expiry calendar. If yes, wait for the next session before reading much into a jump.
- Compare FII with Retail. If FIIs are adding shorts while clients are adding longs, the two are betting against each other. Note who has been right recently.
- Look at the net futures chart for the size of the move, and the options chart for whether FIIs are adding protection (more puts) or removing it.
- Match it with price and other data. Did NIFTY rise while FIIs cut shorts (short covering) or fall while they added shorts? Check PCR and max pain, futures premium and OI build-up.
- Write one line in your journal and keep your trading plan, stop loss and position size unchanged unless your own price levels say otherwise.
Three ways traders use it
Playbook A: confirm a short-covering move (intraday and swing)
When NIFTY rallies sharply, traders check whether FII net index futures shorts fell at the same time. If yes, part of the rally was shorts being closed, which can be fast but can also fade once covering is done. They use this to manage an existing trade (trail the stop, book part of the profit) rather than to start a new one late. Our data showed big covering usually came after the rise, and the following 20 sessions were weaker than average.
Playbook B: the crowded-trade warning
When one group sits at an extreme for its own recent history (for example clients above 80% long, as in October 2026), traders treat it as a sign that a move against that group could be sharp. It is a reason to keep position sizes small and stops tight, not a reason to bet the other way. In our sample, clients 80%+ long was followed by a higher NIFTY 20 sessions later only 35% of the time, but that rests on 34 clustered days.
Playbook C: the hedger’s view for investors
Long-term investors use the FII options and futures picture to understand mood: rising put buying and growing futures shorts mean big money is protecting itself. Some investors respond by reviewing their own risk (asset allocation, cash levels) instead of selling in panic. The page tells you how worried institutions are; it does not tell you whether they are right.
Position size first. Whatever the participants are doing, decide how much of your capital you can lose on a trade and size it with the position size calculator. For option positions, check your maximum loss with the option payoff calculator.
Case studies from the history
Five real episodes from NSE’s participant files (580 sessions) with NIFTY 50 closes. Contract counts are index futures.
1. September 2024: FIIs heavily long at the top
On 26 Sep 2024 FIIs were 79.9% long (net +3,36,047 contracts) and NIFTY closed at 26,216.05, the highest close in the whole history until January 2026. By 31 Oct 2024 FIIs were 22.3% long (net −1,53,227) with NIFTY at 24,205.35, and by 22 Jan 2025 they were net short 3,50,328 contracts, the most in the history, with NIFTY at 23,155.35. Lesson: FIIs being very long did not warn of the fall; they turned short as the market fell. Positions followed price.
2. 30 Sep 2025: the “record low” that was an expiry effect
FII long % dropped from 16.0% to 6.0%, the lowest in the history. But FII net shorts barely changed (−1,69,584 to −1,76,090). The drop happened because it was a monthly expiry day: FII longs fell from 39,999 to 11,968 as expiring contracts closed. NIFTY was 24,611.10; 20 sessions later it was 25,877.85 (+5.1%), while FIIs cut net shorts from −1,97,578 (6 Oct) to −1,06,547 (24 Oct). Lesson: check for expiry before reading an extreme. The rally that followed was real, but the “record” headline was partly arithmetic.
3. 30 Dec 2025: very short, and the market kept falling
Another expiry-day low: FIIs 8.8% long, NIFTY 25,938.85. Anyone expecting a short-covering bounce was disappointed: by 9 Jan 2026 FIIs were 7.5% long, and 60 sessions after 30 Dec NIFTY was at 22,819.60 (−12.0%). Lesson: “too short to fall further” is not a rule. Compare with case 2: the same kind of reading, the opposite outcome.
4. March 2026: FIIs added shorts, clients added longs
From 27 Feb to 27 Mar 2026 FII net index futures went from −1,24,368 to −2,79,467 contracts, while clients’ net longs grew from +92,841 to +1,65,536. NIFTY fell from 25,178.65 to 22,819.60 (−9.4%). Clients kept adding long futures into the fall and were on the losing side as the index dropped. Lesson: when one group keeps adding positions against the trend, look at who is being proved right, and keep your own stop loss.
5. 30 Oct to 6 Nov 2026: a short-covering rally
FII net index futures went from −2,40,753 to −1,00,416 contracts in five sessions (+1,40,337), and FII long % rose from 11.1% to 24.6%. Clients went the other way: from 80.5% long (net +1,86,988) to 65.1% (net +83,781). NIFTY rose from 23,053.10 to 25,030.35 (+8.6%), while FIIs also bought about ₹45,960 crore of shares in the cash market over the same five sessions. Lesson: this is what short covering looks like on the page. The test above found such covering usually comes after the rise and the following weeks are not reliably stronger, so treat it as an explanation, not a promise.
Common mistakes
- “FIIs are 90% short, so the market must crash.” Low FII long % has been the normal state since 2025, often a hedge on their shares. Below 15% long, NIFTY behaved like any other day.
- “FIIs are very short, so a short squeeze is due.” Case 3: 8.8% long, and NIFTY fell 12% over the next 60 sessions.
- Ignoring expiry days. Long % can jump several points just because contracts expired (case 2).
- Reading long % without the size. Check net contracts too.
- Calling put buying bearish. FIIs are net put buyers almost every day; puts are often insurance.
- Reading DII stock futures shorts as bearish. They are mostly mutual-fund arbitrage hedges.
- Trading the next day on tonight’s numbers. The correlation of daily position changes with the next day’s move was 0.05.
Checklist before you use the numbers
- The data is for the latest session (published in the evening).
- Today was not an expiry day, or I am comparing with the day after expiry.
- I compared today’s FII long % with its own last 6–12 months, not with 50%.
- I checked net contracts, not just the percentage.
- I looked at what clients did on the other side.
- I matched the change with NIFTY’s move: covering after a rise, or new shorts after a fall?
- I am using it as context. My entry, stop loss and position size come from my plan.
Glossary
| Open interest (OI) | Contracts still open at the end of the day. |
| Participant-wise OI | NSE’s daily split of open interest by Client, DII, FII and Pro. |
| Long / short | Gains if the price rises / falls. |
| Net | Long − short (futures) or bought − sold (options), in contracts. |
| Long %, long-short ratio | Long ÷ (long + short) × 100. |
| Hedge | A position taken to protect another, such as shorting index futures to protect a share portfolio. |
| Short covering | Buying back short positions, which pushes prices up. |
| Long unwinding | Selling long positions, which pushes prices down. |
| Expiry | The day a futures or options contract ends; expiring positions disappear from OI. |
| Arbitrage | Buying shares and selling their futures together to earn the price gap with little risk. |
| Pro | Proprietary traders: brokers trading their own money. |
| Client | Retail traders, HNIs and companies trading through brokers. |
Questions
What is the FII long short ratio?
It is FIIs’ long index futures contracts as a share of their total long and short index futures contracts, from NSE’s participant-wise open interest. On 6 Nov 2026 it was 24.6% long (48,656 long, 1,49,072 short).
What does it mean when FIIs are heavily short in index futures?
They hold many more short than long index futures contracts. Often this is a hedge against their large share holdings. Since 2025 FIIs have been below 20% long on most days, and in ChartMine’s test readings below 15% did not predict a rise or a fall.
Where does participant-wise OI data come from?
From NSE Clearing’s daily file of F&O open interest by participant type (Client, DII, FII, Pro), published after the close. ChartMine collects it every weekday evening and keeps the history since July 2024.
Who are Pro and Client in NSE F&O data?
Pro means proprietary traders: brokers and trading firms trading their own money. Client means everyone else trading through a broker, including retail traders, wealthy individuals and companies.
Is FII short covering bullish?
It pushes prices up while it happens. But in our 580-session test, big covering (50,000+ contracts in five sessions) mostly came after NIFTY had already risen, and NIFTY was higher 20 sessions later only 36% of the time.
Why do DIIs have huge short positions in stock futures?
Mostly because mutual-fund arbitrage schemes buy shares in the cash market and sell the same stocks’ futures to earn the price difference. The position is hedged, so it is not a bearish bet.
Why did FII long percentage drop sharply on expiry day?
On monthly expiry the expiring contracts close and disappear from open interest. If FIIs held more of their longs in the expiring month, their long % falls even though their view did not change. On expiry days FII long % moved 5.6 points on average versus 1.4 on other days.