
☰ All tutorials
Start here
Tool tutorialsHow to trade with ChartMineStocks
Stock monitorMy watchlistStock scores & checklistMarket & sectors
Nifty 50Bank NiftySensexFin NiftyDaily market reportMarket breadthSector rotationSector heatmapStock screenerRelative strength (RS)MCX commodity pricesFear & Greed IndexWhat happens after…Scanners
Top gainers & losersStocks to watch tomorrowNR7 stocks scannerInside bar stocks52-week high stocksGap up & gap down stocksRSI oversold stocksGolden cross stocksSuperTrend buy stocksScan builderEMA 9/21 crossoverMACD crossoverADX strong trendBollinger breakout / squeezeVolume spike stocksOpen = high / open = lowCandlestick pattern scannerNarrow CPR scannerF&O data
F&O ban listOI build-upOption chainPCR & max painExpiry calendarF&O lot sizesOI build-up heatmapPCR trendMax pain trendFutures basisStock screens
Quarterly growersProfit growth stocksLow P/E stocksMutual fund buyingNear 52-week low, growingDebt-free companiesHigh ROE & ROCEMagic Formula stocksLow price-to-bookSmart money
FII / DII dataShareholding changesBig-money footprintShort selling dataF&O positions by participantBulk & block dealsPromoter buyingDelivery percentageCalendars
Results calendarQuarterly results trackerBoard meetingsCorporate actionsIPO calendarIPO performanceResearch & planning
Strategy testerCompare stocksDividend yield stocksASM / GSM listExpiry-day movesSeasonality & stock historyNSE holidays 2026Position size calculatorOption payoff calculatorPivot point calculatorMore
Stock scanners hubStock screensHow to use the Quarterly growers list
A plain-language guide to companies whose sales and profit have risen quarter after quarter: what the rule means, the types of growers, how to read the list, three playbooks, four real case studies and how the list did in our own test.
What a quarterly grower is, in plain words
Every listed company in India reports its results four times a year: for the quarters ending June, September, December and March. Each report tells you two simple things: how much the company sold (sales, also called revenue) and how much it kept after all costs and taxes (net profit).
A quarterly grower is a company whose sales and profit both went up in each of its last three quarters, each time compared with the quarter just before. Put another way: line up its last four quarterly numbers and they climb like steps, for sales and for profit.
Why does that matter? A single good quarter can be luck: a big one-time order, a tax refund, a sale of land. Three increases in a row are much harder to get by luck. They suggest the business itself is getting bigger and more profitable.
The Quarterly growers page runs this check on every NSE company with a market value above ₹500 crore and lists those that pass. On 9 Nov 2026 (prices of 6 Nov) 123 stocks passed.
One line to remember: steady growth is a good sign about the business. It says nothing about whether the share price is reasonable. Use the list to choose what to research; ChartMine is not a SEBI-registered adviser.
Key ideas: QoQ, YoY, sales, profit and the base
| Term | Meaning |
|---|---|
| Quarter | Three months. India’s financial year runs April to March, so Q1 = April–June, Q2 = July–September, Q3 = October–December, Q4 = January–March. |
| QoQ (quarter on quarter) | This quarter versus the one just before. The quarterly growers rule uses QoQ. |
| YoY (year on year) | This quarter versus the same quarter last year. The table’s growth columns use YoY, because it removes seasonal swings. |
| Sales / revenue | Money from selling products or services. For banks and lenders, total income is used instead. |
| Net profit | What is left after every cost, interest and tax, owed to the company’s own shareholders. |
| Base | The starting number a growth % is measured from. A small base makes growth look huge. |
A real example of the rule: Birla Cable
From the company’s filings with NSE (₹ crore):
| Quarter ending | Sales | Net profit |
|---|---|---|
| Sep 2025 | 176.1 | 0.71 |
| Dec 2025 | 204.5 | 4.02 |
| Mar 2026 | 214.1 | 10.80 |
| Jun 2026 | 266.6 | 30.70 |
| Sep 2026 | 354.8 | 37.81 |
The last four rows climb every time, for both sales and profit, so Birla Cable passes. Its “Profit YoY” on the page is +5,225%: Sep 2026 profit (₹37.81 Cr) against Sep 2025 (₹0.71 Cr). That giant number is a base effect: a year ago the profit was tiny. The sales growth of +102% describes the business change far better.
The exact rules the page uses
- Sales and profit both higher than the previous quarter, three times in a row (four rising quarters).
- The latest quarter is profitable, and sales in the first of the four quarters were positive.
- No quarter’s sales more than three times the previous quarter’s: such a jump is almost always a mistake in units in one filing, so it is skipped.
- Market value at least ₹500 crore: below that, tiny numbers and filing errors dominate.
- Up to 150 stocks are shown, sorted by profit growth YoY, highest first.
Types of growers you will meet
Not every company on the list grows for the same reason. Learning to tell them apart is most of the work.
| Type | What it looks like | What to check |
|---|---|---|
| Steady compounder | Sales up 10–25% YoY, profit a little faster, every quarter. | Is the P/E already high? Steady businesses are rarely cheap. |
| Turnaround | Profit up hundreds of % YoY from a weak year, share price often still below last year. | Why was last year weak, and is the reason gone? |
| Cyclical upswing | Metals, chemicals, commodities: prices of what they sell went up. | Can the cycle turn? Profits fall as fast as they rose. |
| Small base | Profit growth in thousands of %, very small profits a year ago. | Look at sales growth and the size of the business. |
| Seasonal | Strong season makes three quarters rise, then a weak quarter follows. | Compare YoY, not QoQ, for these. |
On 9 Nov 2026 you could see all of these on the page. Welspun Living showed profit +1,203% YoY with sales only +16%: a big profit swing on modest sales growth. CreditAccess Grameen and Muthoot Microfin showed profit +299% and +263% YoY while their share prices were still 23% and 10% lower than a year earlier: profits recovering from a weak quarter a year before. Hindustan Zinc (P/E 11.5, profit +142%) is a metal producer whose results depend heavily on zinc and silver prices.
Why investors watch quarterly growers: advantages and limits
✅ Filters out one-off quarters
Three increases in a row rule out a single lucky quarter.
✅ Both lines must rise
Profit growth without sales growth (cost cuts, one-time gains) does not pass.
✅ Early signal
Improving businesses often show up here before they appear in news headlines.
✅ Ready every evening
The page is rebuilt with every site update; new names appear as results are filed.
The limits
- It looks backwards. The fourth quarter of growth may be the last.
- Seasonality. A business with a strong season can show three rising quarters every year.
- No price check. A company can grow and still be very expensive.
- Data quirks. Some filings have unit errors; the page skips the worst, but always confirm with the stock page.
Did the growers beat the market? Our test
We rebuilt the list as it would have looked on 17 Feb 2026, when results for the December 2025 quarter were in, using only filings made before that day. 63 stocks passed. We then measured each share’s change to 6 Nov 2026 (adjusted for splits and bonuses) and compared it with all 1,360 NSE stocks above ₹500 crore that had fundamentals.
| 17 Feb → 6 Nov 2026 | Quarterly growers | All stocks |
|---|---|---|
| Median change | +11.1% | +0.6% |
| Average change | +19.1% | +9.0% |
| Share that rose | 62% | 51% |
So in this period the growers did clearly better than the average stock. But read the spread too: the best rose about 294% (Cupid, adjusted for its bonus issue) and the worst fell 88% (Indo Thai Securities). Nearly four out of ten growers still fell. One nine-month period in one market is not proof; treat this as encouraging, not as a rule.
A tour of the Quarterly growers page
Open Quarterly growers. The page is simple: a heading, three facts, the table, three reminders and links to the other screens.

- 1How many stocks pass the rule today.
- 2Date of the prices used.
- 3Fundamentals come from each company’s latest filed quarter.
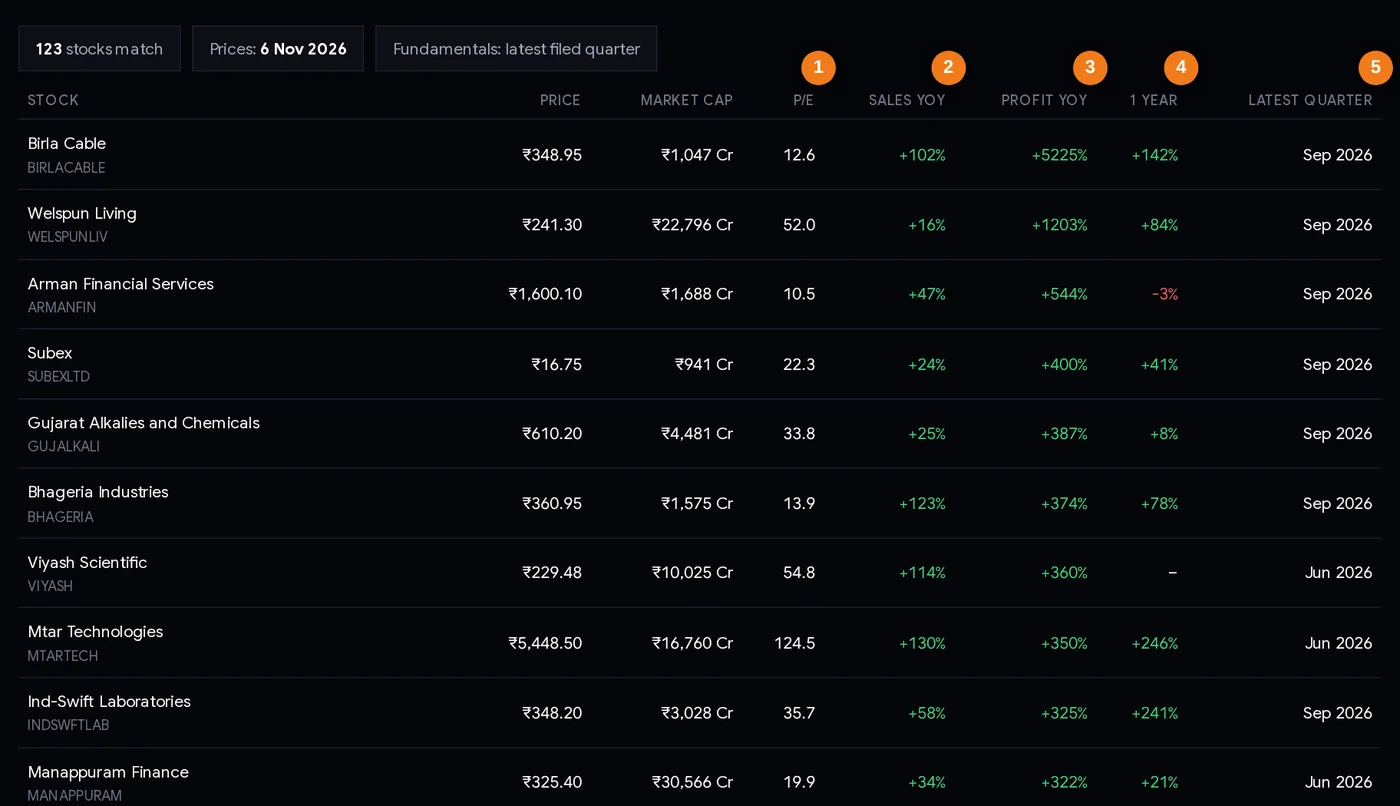
- 1P/E on the last four quarters.
- 2Sales growth on a year ago.
- 3Profit growth on a year ago (sort order).
- 4Share price change over a year.
- 5Which quarter the numbers come from.
Every column explained
| Column | How to read it |
|---|---|
| Stock | Company name and NSE symbol. Click to open its ChartMine page with eight quarters of sales and profit bars. |
| Price | Last close (the date is shown above the table). |
| Market cap | Company value in ₹ crore; “L Cr” means lakh crore. |
| P/E | Price ÷ earnings per share of the last four quarters. “–” if it cannot be computed. |
| Sales YoY | Latest quarter’s sales versus the same quarter a year ago. |
| Profit YoY | The same for profit. The list is sorted by this column. Very large numbers usually mean a small base. |
| 1 year | Share price change over the last year. “–” for recent listings. |
| Latest quarter | Which quarter the numbers are from. In results season some companies still show the earlier quarter until they file. |

The three cards under the table are the page’s own short reminders: steady is not one-off, check the base, then check the price.
Step by step: from list to shortlist (20 minutes)
- Check the dates above the table: price date and how many stocks match.
- Skip the top of the list at first. It is sorted by profit growth, so the first rows are often small-base cases. Scroll down to companies with sales growth of 15–60% and profit growth of 20–100%.
- Set a size floor for yourself. Many beginners prefer companies above ₹5,000 crore: more information, more trading volume.
- Open the stock page and look at the eight quarterly bars. Is the climb smooth, or does one quarter carry everything?
- Check the P/E against the sector. The stock page shows the sector median. Growth at P/E 25 and growth at P/E 120 are very different bets.
- Check the price trend. A grower whose share keeps falling may be facing something the results do not show yet.
- Note the next results date from the board meetings calendar. The fifth quarter decides whether the story continues.
- Write down your reason and your exit: what result or price would tell you the idea is wrong.
Three playbooks
Playbook A: steady growth at a fair price
From the list, keep companies with sales growth of 15% or more, profit growth not wildly above sales growth, and a P/E at or below their sector median. Study these first. They are the closest to “quality at a reasonable price”.
Playbook B: wait for the fifth quarter
Instead of acting on four rising quarters, put the names on a watchlist and wait for the next result. If the fifth quarter also rises, the trend is better established. Godrej Consumer (case 3 below) shows why patience helps.
Playbook C: combine with other evidence
Cross-check with the mutual fund buying list and the relative strength ranking. A grower that funds are adding and whose price is already strong has several independent signals pointing the same way. Sky Gold (case 1) had all three in early 2026.
Whatever you do, size each position so that a 30% fall would not hurt your overall savings badly. Our test included growers that fell 30% to 88%.
Case studies from the list’s history
All four companies were on the list as rebuilt for 17 Feb 2026. Figures from their NSE filings; prices from NSE’s daily files.
1. Sky Gold and Diamonds: the steady climb that kept going
Sales rose ₹1,058 Cr → ₹1,131 Cr → ₹1,484 Cr → ₹1,768 Cr over the four quarters to December 2025; profit ₹38.2 Cr → ₹43.6 Cr → ₹67.0 Cr → ₹80.5 Cr. Mutual funds raised their stake from 8.66% to 10.33% in the March 2026 quarter. Growth continued (profit ₹127.9 Cr in September 2026) and the share went from ₹371 on 17 Feb to ₹951.95 on 6 Nov 2026 (+157%). It was still on the list on 9 Nov 2026, now at P/E 37.2. Lesson: when growth continues, the list can find good businesses early. The P/E is higher now, so the same stock is a different proposition today.
2. Cupid: growth and a re-rating
Sales ₹56.5 Cr → ₹93.5 Cr and profit ₹11.5 Cr → ₹32.8 Cr over the four quarters to December 2025. The share rose about 294% from 17 Feb to 6 Nov 2026, adjusted for its 4:1 bonus issue on 9 Mar 2026 (the quoted price fell from ₹429.55 to about a fifth on that day only because each share became five). By then the P/E was 331. Lesson: part of the gain came from the market paying a much higher multiple. Multiples can shrink as fast as they grow.
3. Godrej Consumer: four rising quarters, then a step back
Sales ₹3,598 Cr → ₹4,099 Cr and profit ₹412 Cr → ₹637 Cr over the four quarters to December 2025; the last step alone was +39%. In the March 2026 quarter profit was ₹452 Cr. The share fell from ₹1,214.80 on 17 Feb to ₹851 on 6 Nov 2026 (−29.9%). Lesson: when the last quarter jumps much more than the earlier ones, ask whether it can repeat.
4. Indo Thai Securities: the small-base warning
Quarterly sales went ₹5.9 Cr → ₹14.2 Cr → ₹23.8 Cr → ₹27.8 Cr while the company was valued at about ₹3,464 Cr on 17 Feb 2026. After a weaker June quarter the share hit its lower price limit on 3 and 4 Aug 2026; the September 2026 quarter showed a loss of ₹35.8 Cr, and the share went from ₹260.76 to ₹31.46 (−88%). Lesson: a very small business with a very large valuation leaves no room for one bad quarter. Look at the size of sales, not only the direction.
Common mistakes
- Starting from the top row. The highest profit growth is usually a small base.
- Ignoring the price. Growth you pay P/E 300 for needs years of more growth to justify it.
- Forgetting seasons. Compare YoY for seasonal businesses.
- Treating four quarters as a promise. In our test 38% of growers still fell.
- Ignoring business size. ₹28 crore of quarterly sales cannot support a ₹3,000 crore valuation for long without big growth.
- Not checking the stock page. The bars show eight quarters; the list only proves four.
Checklist before you act
- Sales growth is real (YoY above roughly 10%) and not only profit growth.
- The climb is smooth across the eight quarterly bars, with no single giant jump.
- Profit growth % is not a small-base effect.
- P/E compared with the sector median.
- Price trend checked (1-year return, RS rating).
- Next results date known.
- Reason to own and exit condition written down.
- Position size chosen so a 30% fall is survivable.
Glossary
| Quarterly grower | Sales and profit up QoQ for three quarters in a row. |
| QoQ | Quarter on quarter: versus the previous quarter. |
| YoY | Year on year: versus the same quarter last year. |
| Base effect | A huge growth % caused by a very small starting number. |
| Turnaround | A business recovering from losses or a weak period. |
| Cyclical | A business whose profits rise and fall with an economic or commodity cycle. |
| Re-rating | The market paying a higher (or lower) P/E for the same company. |
| Lower price limit (circuit) | The most a share may fall in one day on NSE; trading stops at that price. |
Questions
What is a quarterly grower stock?
A company whose sales and profit both increased in each of its last three quarters compared with the quarter before, so four quarterly numbers rise in a line. ChartMine lists the NSE stocks above ₹500 crore that pass.
Which stocks have increasing sales and profit every quarter?
The Quarterly growers page lists them, from companies’ results filed with NSE. On 9 Nov 2026, 123 stocks passed the three-quarter rule.
How often is the quarterly growers list updated?
With every site update. It changes most in results season, when companies file new quarterly numbers (roughly mid-January, April to May, July to August and October to November).
Why is profit growth over 1,000% on some stocks?
Because profit in the same quarter last year was very small. That is a base effect; sales growth gives a better picture of how much the business changed.
Do quarterly growers outperform the market?
In our test the list built on 17 Feb 2026 had a median gain of 11.1% to 6 Nov 2026, against 0.6% for all stocks, but 38% of the growers still fell. One period is not proof.
What is the difference between QoQ and YoY growth?
QoQ compares a quarter with the one just before it; YoY compares it with the same quarter a year earlier. YoY removes seasonal effects, so the table shows YoY even though the list rule uses QoQ.