
☰ All tutorials
Start here
Tool tutorialsHow to trade with ChartMineStocks
Stock monitorMy watchlistStock scores & checklistMarket & sectors
Nifty 50Bank NiftySensexFin NiftyDaily market reportMarket breadthSector rotationSector heatmapStock screenerRelative strength (RS)MCX commodity pricesFear & Greed IndexWhat happens after…Scanners
Top gainers & losersStocks to watch tomorrowNR7 stocks scannerInside bar stocks52-week high stocksGap up & gap down stocksRSI oversold stocksGolden cross stocksSuperTrend buy stocksScan builderEMA 9/21 crossoverMACD crossoverADX strong trendBollinger breakout / squeezeVolume spike stocksOpen = high / open = lowCandlestick pattern scannerNarrow CPR scannerF&O data
F&O ban listOI build-upOption chainPCR & max painExpiry calendarF&O lot sizesOI build-up heatmapPCR trendMax pain trendFutures basisStock screens
Quarterly growersProfit growth stocksLow P/E stocksMutual fund buyingNear 52-week low, growingDebt-free companiesHigh ROE & ROCEMagic Formula stocksLow price-to-bookSmart money
FII / DII dataShareholding changesBig-money footprintShort selling dataF&O positions by participantBulk & block dealsPromoter buyingDelivery percentageCalendars
Results calendarQuarterly results trackerBoard meetingsCorporate actionsIPO calendarIPO performanceResearch & planning
Strategy testerCompare stocksDividend yield stocksASM / GSM listExpiry-day movesSeasonality & stock historyNSE holidays 2026Position size calculatorOption payoff calculatorPivot point calculatorMore
Stock scanners hubStock screensHow to use the Volume spike scanner
A plain-language guide to volume shockers: how a spike is measured, the types of spikes, why delivery % matters, an honest two-year test of what followed, a tour of the scanner, playbooks and real case studies.
What a volume spike is, in plain words
Volume is the number of shares that changed hands in a day. Every stock has its own normal level: a large bank may trade crores of shares a day, a small company only a few thousand. What matters is not the raw number but how today compares with the stock’s own usual day.
A volume spike (traders also say volume shocker) is a day when a stock trades far more than usual. The volume spike scanner measures it in a simple way:
Volume × = today’s volume ÷ the average volume of the previous 20 sessions. A value of 2 means twice the usual volume; 3 means three times. The scanner lists every stock at 2× or more.
A real example: on Friday 13 Nov 2026, BF Utilities traded 1,00,16,750 shares. Over the previous 20 sessions it had averaged only about 45,700 shares a day, so its volume was 219× normal. The price rose 10.72% to ₹498.55. On the day before, 12 Nov, it had traded just 30,048 shares.
A day like that tells you something unusual happened. It does not, by itself, tell you what happened or what comes next. This tutorial shows how to read a spike properly, what our two-year test found, and how traders fit the list into a routine.
The scanner covers every actively traded NSE stock with enough history (1,304 stocks on 13 Nov 2026), not only F&O stocks. That day 142 stocks traded 2× or more and 81 traded 3× or more; only 16 of the 142 were F&O stocks.
Types of volume spikes
Volume always needs a partner: the price move, and how much of the volume was “real” ownership change. The same 3× day can mean very different things.
| Type | What you see | What it often means |
|---|---|---|
| Up on heavy volume | 2×+ volume, price closes higher | Demand: buyers were willing to pay up. Often news, results or a breakout from a range. |
| Down on heavy volume | 2×+ volume, price closes lower | Supply: holders were selling. Often bad news, results, or a large holder exiting. |
| Heavy volume, flat price | 2×+ volume, change near zero | Absorption: a big seller met a big buyer (or the reverse). Often a block or bulk deal. |
| High-delivery spike | 2×+ volume with delivery 50%+ | Many shares actually changed owners and were kept, not traded out the same day. |
| Low-delivery spike | 2×+ volume with delivery under ~15% | Mostly same-day trading: speculators and trading firms buying and selling repeatedly. |
| Extreme spike | 10× or more | Usually a specific event in a normally quiet stock. In our test these did worse than average afterwards. |
Delivery %: the most useful second number
Delivery % is the share of the day’s traded quantity that buyers took into their demat accounts instead of squaring off the same day. If 1 lakh shares traded and delivery was 60%, about 60,000 shares changed owners for longer than a day. On 13 Nov 2026 BF Utilities had 219× volume but only 4.12% delivery: about 96% of its huge volume was same-day trading. NSE’s bulk-deal list for that day shows several trading firms each buying and selling almost the same quantity (one bought and sold 5,14,165 shares each way). Read more in the delivery percentage tool.
Why traders watch volume spikes: advantages and limits
✅ Something changed
A 2× or 3× day is rarely random. It points you to the stocks where news, results or big players are active today.
✅ Confirms a move
A breakout or breakdown on heavy volume shows real participation; the same move on light volume is easier to reverse.
✅ Marks levels
The high and low of a heavy-volume day often become reference prices that the stock returns to later.
✅ Bigger moves follow
In our test, stocks moved more than usual the next day after a spike, in either direction. Useful for planning risk.
What our two-year test says (please read this part)
We took split- and bonus-adjusted daily data for 1,459 NSE stocks and checked every day from 19 Nov 2024 to 15 Oct 2026: about 6.4 lakh stock-days, including 59,764 days with 2× volume. For each, we measured what the stock did over the next day and the next 20 sessions. A handful of obviously broken data points were removed.
| Group | Cases | Next day: closed up | Next day: average size of move | After 20 days: closed up | After 20 days: median return |
|---|---|---|---|---|---|
| All stock-days (baseline) | 6,37,977 | 47% | 1.85% | 45% | −1.08% |
| 2× volume | 59,764 | 47% | 2.38% | 45% | −1.21% |
| 2× volume, price up | 40,238 | 46% | 2.40% | 44% | −1.54% |
| 2× volume, price down | 19,526 | 48% | 2.34% | 48% | −0.53% |
| 3× volume | 30,474 | 47% | 2.58% | 44% | −1.63% |
| 10× volume | 5,459 | 47% | 3.14% | 41% | −2.49% |
| 2× up, delivery 50%+ | 9,909 | 49% | 2.10% | 49% | −0.36% |
| 2× up, delivery under 50% | 29,817 | 45% | 2.50% | 43% | −2.00% |
What this means in plain words:
- A volume spike did not predict direction. After 2× days, stocks closed up the next day 47% of the time, exactly like an ordinary day.
- It did predict bigger moves. The average next-day move was 2.38% after a 2× day and 3.14% after a 10× day, against 1.85% normally. Plan wider stops or smaller positions.
- “Price up on heavy volume” was not a buy signal. Over 20 days these stocks did slightly worse than the baseline (44% up).
- Delivery helped a little. Up-days with 50%+ delivery did better than low-delivery ones (49% versus 43% up after 20 days), but that is still close to a coin toss.
- Extreme spikes faded. After 10× days only 41% of stocks were higher 20 sessions later.
- The period was weak for many smaller stocks (the median stock fell over a typical 20-day window), so look at the gaps between rows, not the signs alone.
So how should you use it? As an attention list: it tells you where something is happening. Your job is to find out what happened (news, results, deals), mark the spike day’s high and low, and wait for the price to show its hand.
A tour of the scanner screen
Open the volume spike scanner. The page has the date and tabs at the top, the filters, and the results table.

- 1Scan for: pick the session.
- 22× volume: at least twice the 20-day average.
- 33× volume: at least three times.
- 42× volume and the price closed up.
- 52× volume and the price closed down.
Each tab shows its count for the chosen day. On 13 Nov 2026: 142 in 2× volume, 81 in 3× volume, 82 in 2× volume, price up and 60 in 2× volume, price down. The first three tabs are sorted by volume × (biggest spike first); the price-down tab is sorted by the day’s change, biggest fall first.
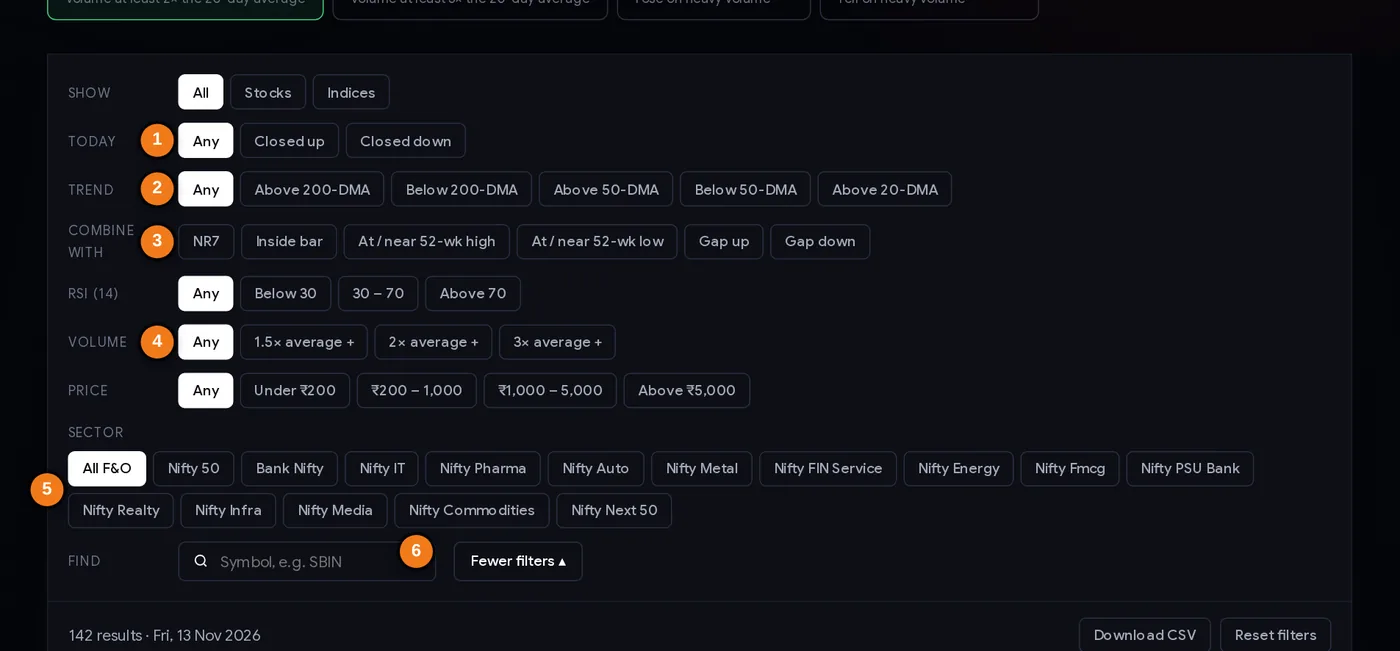
- 1Closed up or down today
- 2Trend: vs the 200-day or 50-day average
- 3Combine with another scan
- 4Stricter volume level
- 5Sector (NIFTY sector index members)
- 6Find a symbol
The filters
- Today: closed up or closed down.
- Trend: above or below the 200-day or 50-day average. A spike in a stock above its 200-DMA is a different story from one in a long downtrend.
- Combine with: keep only stocks that also had an NR7, inside bar, a 52-week high or low nearby, or a gap up or down.
- More filters opens RSI, a stricter volume level (e.g. 3×+), a price band and sector buttons (these use the stock lists of NIFTY sector indices, so they keep only index members).
- Find jumps to a symbol. Download CSV saves the list; Reset filters clears everything. Filters stay in the address bar, so a link opens the same view.
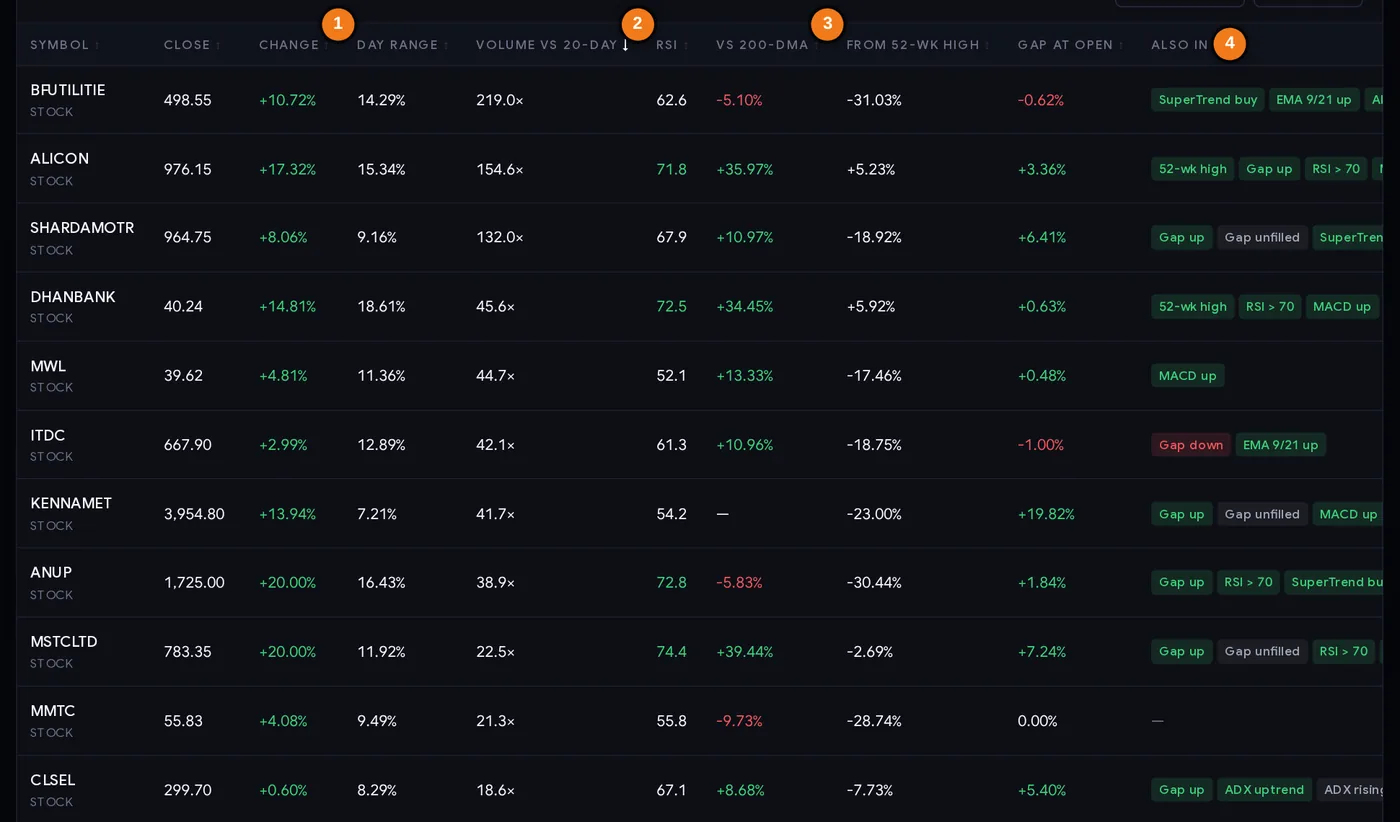
- 1The day’s price change
- 2Volume vs the 20-day average
- 3Distance from the 200-day average
- 4Other scans the stock is in today
Every column explained
| Column | What it tells you |
|---|---|
| Symbol | The NSE symbol. |
| Close / Change | Closing price and the day’s change in %. The first question for any spike: which way did the price go? |
| Day range | High minus low as % of the close. A spike with a huge range was a volatile, contested day. |
| Volume vs 20-day | Today’s volume ÷ the average of the previous 20 sessions. |
| RSI | 14-day RSI. Above 70 after a spike means the stock is already stretched. |
| vs 200-DMA | How far the close is above or below the 200-day average, the long-term trend. |
| From 52-wk high | Distance from the 52-week high. A spike at a new high is a breakout story; 40% below the high is a different one. |
| Gap at open | How far the open was from the previous close. A big gap usually means overnight news. |
| Also in | Other scans the stock appears in today (52-week high, SuperTrend flip, open = high, candle patterns and so on). |
Where is delivery %? This table does not show it. To see volume × and delivery side by side, open the scan builder and add the signal Volume 2×+: its table has a Delivery column. Or check each stock’s page.
Step by step: your evening routine (15 minutes)
- Open the scanner after the evening update (data is usually ready by about 8 PM IST on trading days). Check the date in “Scan for”.
- Glance at the tab counts. On 13 Nov 2026, 142 stocks had 2× volume, of which 82 closed up and 60 down. A day with far more up-spikes than down-spikes (or the reverse) says something about the market’s mood.
- Start with the 3× tab and the Trend filter that matches your style (above 200-DMA for trend followers).
- Find out why. For each name, check the bulk and block deals, the results calendar and the company’s announcements on the stock page.
- Check delivery % in the scan builder or on the stock page. Low delivery means mostly same-day trading.
- Mark the spike day’s high and low on your chart. These are the levels to watch next.
- Shortlist 3 to 5 names and write the plan: what price action would confirm the idea, and where you would be wrong.
- Next day, wait. Our test showed bigger-than-usual moves after spikes in both directions. Let the first 15–30 minutes pass before acting.
Three playbooks
Playbook A: the high-delivery breakout
- Tab 2× volume, price up; Combine with At / near 52-wk high; Trend Above 200-DMA.
- Keep only names with delivery 50% or more (scan builder or stock page) and no results due in the next few days.
- The spike day’s low is the line in the sand. A close back below it says the breakout failed.
- Many traders wait for a pullback towards the breakout level rather than buying the spike day’s high. Size with the position size calculator.
Playbook B: the spike low as support
After a heavy-volume day, the low of that day often matters. If a stock spikes up on 3× volume and later drifts back towards the spike day’s low on light volume, some traders treat a hold of that low as a lower-risk area, with a stop just below it. If it closes below the low on heavy volume again, the buyers of the spike day are now losing money and selling can speed up.
Playbook C: stand aside
Skip a spike when: delivery is very low (mostly same-day trading); the stock already moved 10–20% on the day and RSI is above 75; the volume came from one bulk or block deal with no news; the stock is thinly traded on normal days (its normal volume is so small that a modest order looks huge); or results are due.
These are examples of how traders organise their thinking, not recommendations. Spikes are followed by bigger moves in both directions, so always decide your stop loss and position size before entry.
Case studies: 13 Nov 2026 and earlier spikes
Real spikes from the scanner’s data, with what we can verify. Prices in ₹.
1. BF Utilities, 13 Nov 2026: 219× volume, 4% delivery
1,00,16,750 shares against a 20-session average of about 45,700. Price +10.72% to 498.55. Turnover about ₹505 crore in a stock that normally trades about ₹1.9 crore a day. Delivery only 4.12%. The bulk-deal list shows several trading firms buying and selling nearly equal amounts. Lesson: the biggest spike of the day was mostly churning, not investors taking positions. Volume × alone would have ranked it first.
2. IIFL Capital Services, 13 Nov 2026: heavy volume, flat price
9.66× volume, price +0.54% to 354.15, delivery 73.09%. Bulk deals that day: three sellers sold 63,15,728 shares between them. Large supply was absorbed with almost no price change. Lesson: a flat price on heavy, high-delivery volume usually means a big holder exited and others took the shares. Whether that is good or bad is a judgement; the scanner only shows that it happened.
3. Amber Enterprises, 13 Nov 2026: gap down, then a 9% up day
The F&O stock opened at 6,056, below the previous close of 6,209, then rallied to a high of 6,980 and closed at 6,772: +9.07% on 13.93× volume (27,20,361 shares, turnover about ₹1,817 crore), delivery 10.89%. The scanner tagged it with a gap down and a bullish engulfing candle. Lesson: the open and the close can tell opposite stories on a spike day; the day’s range (14.47%) shows how contested it was.
4. Three earlier spikes and what happened 15 sessions later
| Stock, date | Volume × | Day’s change | Delivery | 15 sessions later |
|---|---|---|---|---|
| Indian Hotels, 29 Sep 2026 | 14.1× | +0.47% (714.35) | 77.25% | 782.30 on 22 Oct: +9.5% |
| Swiggy, 4 Sep 2026 | 13.1× | +2.53% (276.10) | 80.69% | 256.00 on 28 Sep: −7.3% |
| Max Financial Services, 24 Sep 2026 | 21.4× | −9.78% (1,410.00) | 50.37% | 1,294.90 on 16 Oct: −8.2% |
Indian Hotels and Swiggy look almost the same on the spike day: huge, high-delivery volume and a small price change. One rose 9.5% over the next 15 sessions, the other fell 7.3%. Max Financial fell nearly 10% on heavy volume and kept falling. Lesson: volume tells you that big money moved; it does not tell you which way the next move goes. That is exactly what the two-year test showed.
Common mistakes
- Reading “high volume” as “bullish”. Heavy volume confirms whichever way the price went, and our test found no next-day direction edge.
- Ignoring delivery. BF Utilities’ 219× day had 4.12% delivery.
- Chasing the spike day’s close. Moves after spikes are bigger in both directions; entering late on a 15% up day leaves a wide stop.
- Not checking why. Bulk and block deals, results and announcements explain most spikes.
- Trusting spikes in thin stocks. A stock that normally trades a few thousand shares can show 10× on one ordinary order.
- No stop loss because “big players are in”. Max Financial fell 8.2% more in 15 sessions after its 21× day.
- Expecting the list to stay the same. The spike is measured against the last 20 sessions; after a few busy days the average rises and the same volume no longer counts as 2×.
Checklist for a volume spike
- The scan date is the latest trading day.
- Price direction noted: up, down or flat on the spike.
- Delivery % checked; very low delivery treated with caution.
- Reason found: news, results, bulk/block deal, or unknown.
- Trend checked: above or below the 200-DMA, distance from the 52-week high.
- Normal liquidity is enough to trade (not a thin stock).
- Spike day’s high and low marked; confirmation level written down.
- Stop loss and position size decided, allowing for bigger-than-usual moves.
Glossary
| Volume | Number of shares traded in a day. |
| Volume × (vs 20-day) | Today’s volume ÷ the average of the previous 20 sessions (split- and bonus-adjusted). |
| Volume shocker | Another name for a stock trading far above its usual volume. |
| Delivery % | Share of traded quantity taken into demat accounts rather than squared off the same day. |
| Turnover | Value traded in the day, in ₹ (price × shares). |
| Bulk deal | A trade by one client of more than 0.5% of a company’s shares in a day, reported by NSE. |
| Block deal | A large trade done in a special window at a set price, reported by NSE. |
| Absorption | Heavy volume with little price change: big supply met by big demand (or the reverse). |
| 200-DMA | The average closing price of the last 200 sessions; a common long-term trend line. |
| Gap | The difference between today’s open and yesterday’s close. |
Questions
What are volume shockers in the stock market?
Stocks trading far more shares than usual. ChartMine counts a stock as a volume shocker when its volume is at least twice the average of its previous 20 sessions. On 13 Nov 2026, 142 NSE stocks qualified.
How is a volume spike calculated?
Today’s traded shares divided by the average of the previous 20 sessions, using split- and bonus-adjusted data. A value of 3 means three times the usual volume.
Is a volume spike bullish?
Not by itself. In ChartMine’s test of about 60,000 2× volume days from Nov 2024 to Oct 2026, stocks closed higher the next day 47% of the time, the same as an ordinary day. Spikes were followed by bigger moves in both directions.
What is the difference between volume and delivery?
Volume is every share traded. Delivery is the part that buyers took into their demat accounts instead of squaring off the same day. A spike with high delivery means more shares really changed owners.
Why does a stock show huge volume but low delivery?
Most of the trading was same-day buying and selling, often by speculators and trading firms. On 13 Nov 2026 BF Utilities traded 219× its usual volume with only 4.12% delivery.
When is the volume spike list updated?
Every trading day in the evening after NSE publishes its daily files, usually by about 8 PM IST.
Should I buy a stock with a volume spike?
The scanner is information, not advice, and ChartMine is not a SEBI-registered adviser. Find out why the volume came, check delivery and trend, and decide your stop loss and position size before any trade.