
☰ All tutorials
Start here
Tool tutorialsHow to trade with ChartMineStocks
Stock monitorMy watchlistStock scores & checklistMarket & sectors
Nifty 50Bank NiftySensexFin NiftyDaily market reportMarket breadthSector rotationSector heatmapStock screenerRelative strength (RS)MCX commodity pricesFear & Greed IndexWhat happens after…Scanners
Top gainers & losersStocks to watch tomorrowNR7 stocks scannerInside bar stocks52-week high stocksGap up & gap down stocksRSI oversold stocksGolden cross stocksSuperTrend buy stocksScan builderEMA 9/21 crossoverMACD crossoverADX strong trendBollinger breakout / squeezeVolume spike stocksOpen = high / open = lowCandlestick pattern scannerNarrow CPR scannerF&O data
F&O ban listOI build-upOption chainPCR & max painExpiry calendarF&O lot sizesOI build-up heatmapPCR trendMax pain trendFutures basisStock screens
Quarterly growersProfit growth stocksLow P/E stocksMutual fund buyingNear 52-week low, growingDebt-free companiesHigh ROE & ROCEMagic Formula stocksLow price-to-bookSmart money
FII / DII dataShareholding changesBig-money footprintShort selling dataF&O positions by participantBulk & block dealsPromoter buyingDelivery percentageCalendars
Results calendarQuarterly results trackerBoard meetingsCorporate actionsIPO calendarIPO performanceResearch & planning
Strategy testerCompare stocksDividend yield stocksASM / GSM listExpiry-day movesSeasonality & stock historyNSE holidays 2026Position size calculatorOption payoff calculatorPivot point calculatorMore
Stock scanners hubStock screensHow to use the Stock monitor and stock pages
A complete, plain-language guide to ChartMine’s stock monitor (1,536 NSE stocks on one screen) and the stock pages behind it: every column and filter, every section of a stock page using SBI as the example, the daily “Today” write-up, price levels by delivered volume, IPO stocks, Telegram alerts, a shortlist routine, three playbooks and real case studies.
What the stock monitor is, in plain words
The Stock monitor is one big table of 1,536 NSE stocks (session of 13 Nov 2026): every F&O stock, every stock that trades at least ₹1 crore a day (median over the last 60 sessions), and recent IPOs from their fifth trading session. For each one you see its price, returns from one day to one year, how far it is from its 52-week high, how much of its volume is delivered, how volatile it is, and its RS rating. You can sort any column, filter with one tap, search by name, and star stocks into your watchlist.
Every name in the table opens the stock’s own stock page, for example /stock/sbin/. That page is a full research file for one company: chart, a daily write-up of the latest session, price levels by delivered volume, scores, a “stock DNA” profile, results, shareholding, peers, cash flow, ten years of history, dividends, delivery, events, F&O data, seasonality and private notes. IPO stocks also get an IPO box, and every page has a Telegram alerts button.
So the tool has two levels:
- The monitor answers “which stocks should I look at?”
- The stock page answers “what do I need to know about this one?”
One line to remember: the monitor and stock pages organise facts from NSE’s files and company filings. They help you research faster; they do not say whether to buy or sell.
The numbers you will see, explained
| Measure | What it means | How it is calculated |
|---|---|---|
| RS rating | How strong the stock has been over a year compared with all others, 1 to 99. | 12-month return with the latest quarter counted twice, ranked as a percentile. Stocks with less than a year of trading show a dash. See the RS tutorial. |
| 1D, 1W, 1M, 3M, 1Y | Price change over 1, 5, 21, 63 and 250 sessions. | From adjusted closing prices (splits and bonuses removed). |
| From 52W high | How far below its highest price of the past year the stock closed. 0% = at the high. | Close ÷ 52-week high − 1. |
| Delivery | The share of traded shares that actually changed owners (not squared off the same day), averaged over 60 sessions. | NSE’s delivery data. |
| Volatility | How much the stock typically swings, as a yearly %. Divide by about 16 to get a typical day’s move. | Standard deviation of daily returns over the last year × √250. |
| Big-buyer day | A day when delivered shares were at least 3× the stock’s normal, with a normal-or-higher delivery %. | Normal = median of the previous 50 sessions. |
| RSI (14-day) | A 0–100 momentum gauge. Above 70 is often called overbought, below 30 oversold. | Average up-moves vs average down-moves over 14 sessions. |
| Price levels by delivered volume | The price zones where the most shares were actually delivered. Zones below the close are shown as support, zones above as resistance. | Each day’s delivered shares are spread evenly across that day’s high–low range, over the last 250 sessions; the clear peaks are the levels. |
Why delivery matters
When you buy and sell the same shares within a day, nothing really changes hands. When shares are delivered, the buyer takes them into a demat account. High delivery suggests investors are active; low delivery, mostly intraday trading. A sudden jump in delivered shares (a big-buyer day) means large ownership changes, but it can be heavy selling just as easily as buying: on 13 Nov 2026, of the 66 stocks with a big-buyer day, 31 closed up and 35 closed down.
Volatility in practice
On 13 Nov 2026 the median stock in the monitor had a volatility of about 41% a year (a typical day ±2.6%). SBI was 24% (about ±1.5% a day). The calmest included Castrol India (15%). Higher volatility means wider stop losses and smaller position sizes for the same risk.
Why use it: advantages and limits
✅ Every liquid stock on one screen
Sort 1,536 stocks by any measure in one click.
✅ One-tap filters
F&O only, big-buyer today, near 52-week high, or your own watchlist, as visible buttons.
✅ Deep stock pages
A daily write-up, price levels, results, shareholding, peers, events, F&O and seasonality for one company, in plain English.
✅ Free and private
No login. Your watchlist and notes stay in your own browser. Telegram alerts are optional.
The limits (please read this part)
- End-of-day data. The monitor and stock pages are rebuilt every evening from NSE’s closing files. During market hours the numbers are from the previous session; the “Updated” line says which.
- Not every listed stock. Very illiquid stocks (median turnover under ₹1 crore a day) are left out unless they are in F&O.
- Past numbers only. Returns, RS, delivery, volatility and price levels describe the past. They do not forecast. A stock near its 52-week high can fall; a stock 40% below can keep falling; a support zone can break.
- Short history for new listings. A recent IPO gets a page from its fifth session, but without Stock DNA or scores until it has enough history, and without an RS rating until it has traded for a year.
- Automatic text. “Today”, “At a glance” and “Pros and cons” are written by rules from the data. They are facts, not opinions, and can miss context (a one-off gain, a merger, a court case).
- Filings can be late or restated. Fundamentals come from company filings with NSE; check the original filing before a big decision.
A tour of the monitor
Open the Stock monitor. A line under the heading shows when the page was last updated and which trading session the data is for (on 14 Nov 2026 it read “data for the trading session of Fri 13 Nov 2026”). Below it are the search box and five view buttons.
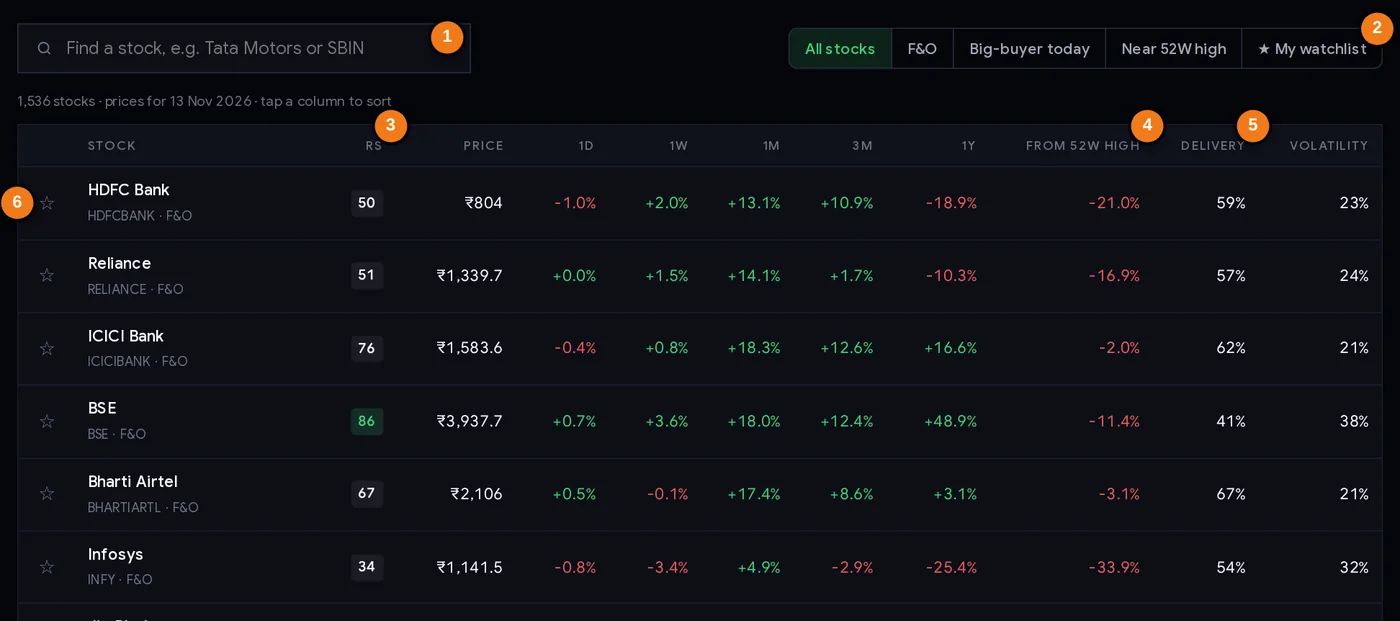
- 1Find a stock by name or symbol
- 2Views: all, F&O, big-buyer today, near 52W high, my watchlist
- 3RS rating
- 4Distance from the 52-week high
- 5Delivery % (60-session average)
- 6Star to add to your watchlist
The controls
| Control | What it does (counts for 13 Nov 2026) |
|---|---|
| Find a stock | Type part of a name or symbol, e.g. “tata” or “SBIN”. The table filters as you type. |
| All stocks | All 1,536 stocks. Default sort: most traded first (60-day median turnover). |
| F&O | Only stocks with futures and options (219). |
| Big-buyer today | Stocks with a big-buyer day in the latest session (66). |
| Near 52W high | Stocks within 3% of their 52-week high (93). |
| ★ My watchlist | Only the stocks you starred. See the watchlist tutorial. |
| Column headers | Click to sort; click again to reverse (↓ high to low, ↑ low to high). |
| ☆ star | Adds the stock to your watchlist (★ when added). Saved in this browser only. |
| Show more | The table shows 100 rows at first; the button adds 200 at a time. |
Under each stock name a small line shows its symbol, F&O if it has derivatives, and a green big-buyer day tag if it had one in the latest session. The RS badge is highlighted when it is 80 or more and styled differently when it is 20 or less. A dash in the RS column means less than a year of trading (169 stocks on 13 Nov 2026).
A tour of a stock page (SBI, 13 Nov 2026)
Click any stock to open its page. Here is State Bank of India with the data for 13 Nov 2026.
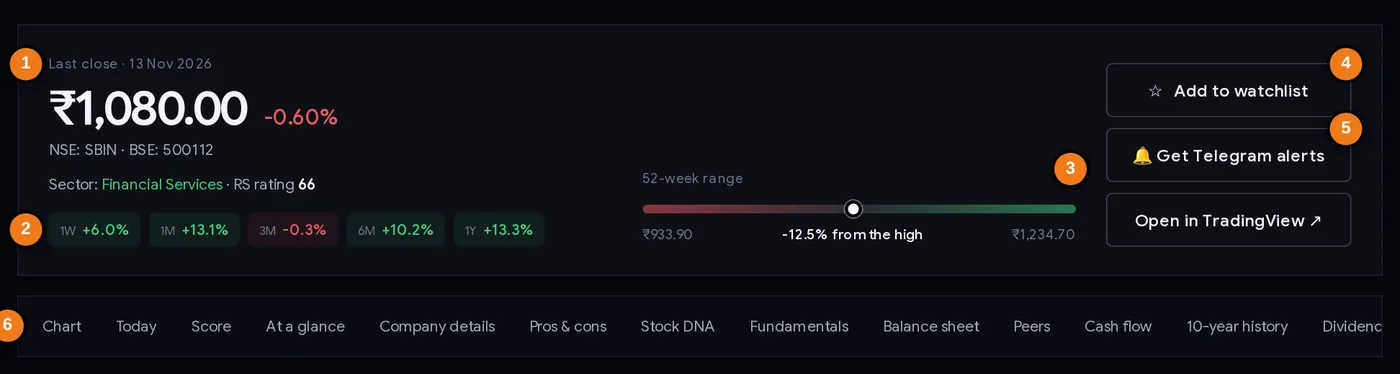
- 1Last close and day’s change
- 2Returns from 1 week to 1 year
- 352-week range and distance from the high
- 4Add to watchlist
- 5Get Telegram alerts for this stock
- 6Jump to any section of the page
The top block gives the last close (₹1,080.00, −0.60%), the sector and RS rating (66), returns from one week to one year (1W +6.0%, 1Y +13.3%), and the 52-week range bar (₹933.90 to ₹1,234.70; the close was 12.5% below the high). Buttons let you add the stock to your watchlist, get Telegram alerts for it, or open it in TradingView. The row of section buttons jumps down the page.
| Section | What you learn (SBI, 13 Nov 2026) |
|---|---|
| Chart | Candles with 50 and 200-day averages; volume with the delivered part coloured; markers for big-buyer days, deals and results. |
| Today | A write-up of the latest session, the last five sessions and price levels by delivered volume (next section). |
| Score | Quality 69, Valuation 58, Momentum 66 out of 100 against 1,359 stocks; passes 10 of 14 checks on the 18-point checklist. |
| At a glance | +13.29% in a year against −1.54% for NIFTY 50; 57% delivered vs a 54% average; 4 big-buyer days in three months; calmer than 96% of stocks. |
| Company details | Industry (Public Sector Bank), ISIN, NSE and BSE codes, NSE listing date (1 March 1995), face value (₹1). |
| Pros and cons | Rule-based facts: “P/E of 11.0 is below its sector’s median of 17.1.” |
| Stock DNA | Ranks from 0 to 100 among the 1,448 most traded stocks (shown below). |
| Fundamentals | Market cap ₹9.97 lakh crore, P/E 11.0, Q2 FY27 net profit ₹25,741 Cr (+19.70% YoY), shareholding (promoters 55.5%, mutual funds 13.7%, FIIs 11.1%). |
| Balance sheet | For banks: ROE (14.4%), book value (₹750.50, P/B 1.4), deposits, advances. For others: debt, cash and returns. |
| Peers | The 7 companies nearest in size in the sector (SBI is number 3 of 165 Financial Services companies) with P/E, P/B, ROE, growth, 1-year return and scores. Tap a heading to sort. |
| Cash flow | Operating, investing and financing cash flow, capex and dividends, by year. For banks it is not compared with profit. |
| 10-year history | Income, profit and EPS since FY16: income +10.0% and profit +21.4% a year over 10 years. |
| Dividends & bonus | ₹17.35 in the last 12 months (a 1.61% yield); split ₹10 → ₹1 in 2014. |
| Delivery | A 12-month delivery calendar and the big-buyer days (8 in a year) with the move five sessions later. |
| Timeline | Everything that happened, newest first: results, big-buyer days, dividends, new highs, big moves. |
| F&O | Futures ₹1,082.20, open interest 9.58 crore (−0.97%, long unwinding), PCR 0.84, max pain ₹1,030 (23 Nov expiry), 26% of the market-wide limit, and a “Last 20 sessions” strip: one coloured square per day for its build-up type. |
| Results-day moves | ±1.3% over the last 12 results, about 1.5× a normal day; closed higher on 49% of 74 results. |
| Seasonality | Average return by calendar month since 2000 (November: +6.03%, higher in 77% of years). |
| My notes | Private notes, saved only in your browser. |
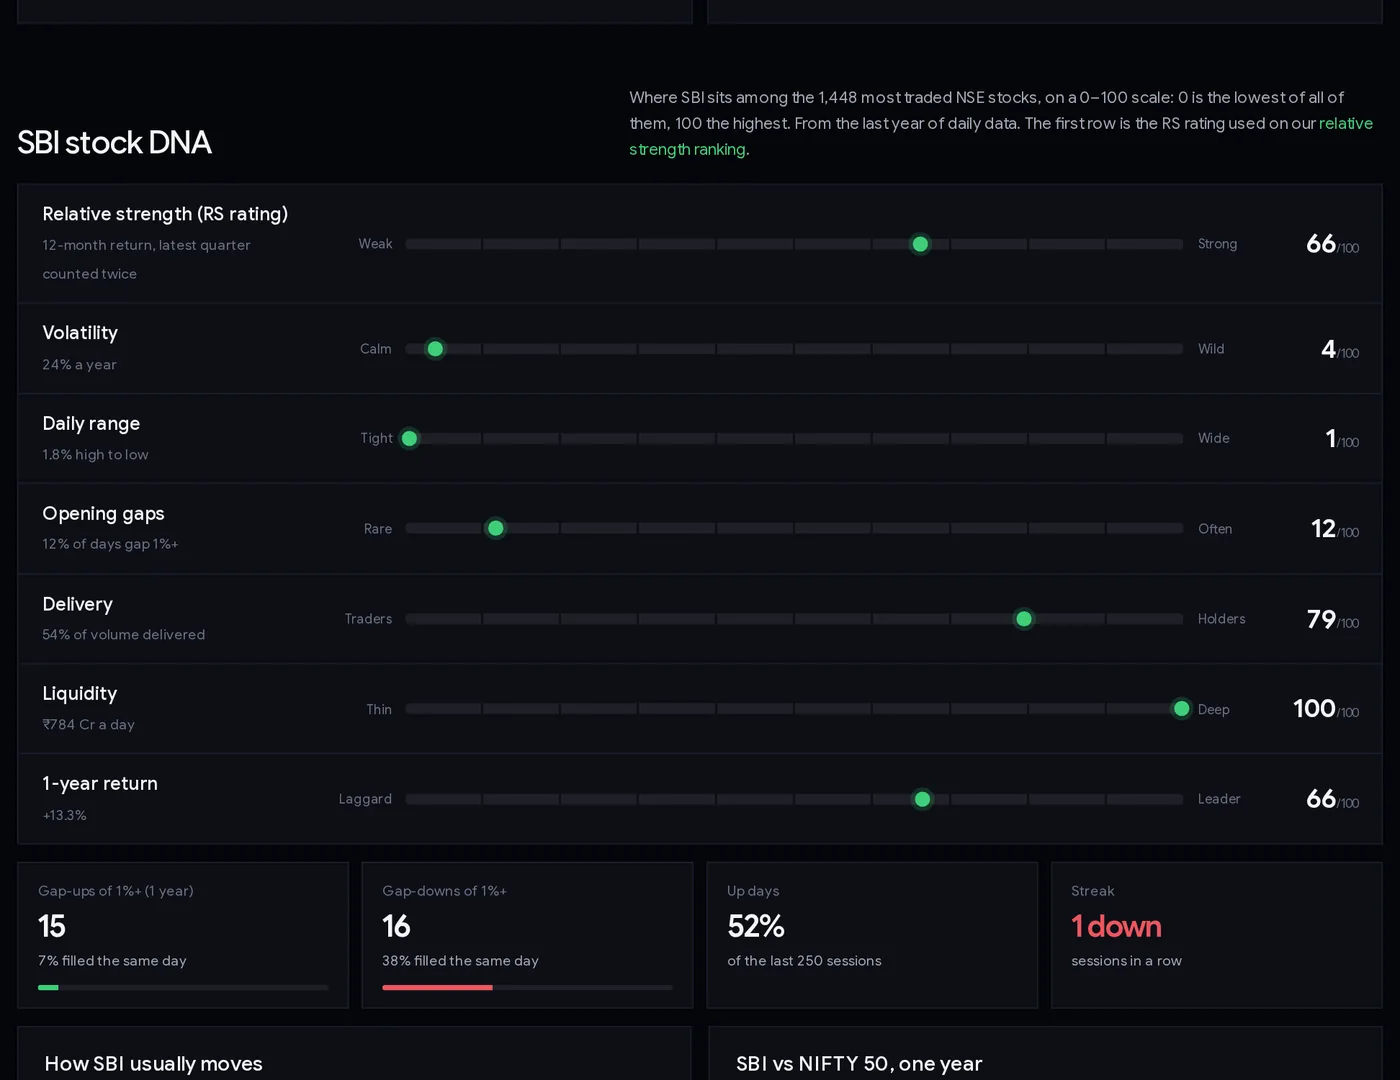
The Stock DNA bars are percentiles. SBI on 13 Nov 2026: RS 66/100, volatility 4/100 (24% a year: calm), daily range 1/100 (1.8%), opening gaps 12/100, delivery 79/100 (54%: investor-heavy), liquidity 100/100 (₹784 Cr a day). In one glance: a calm, very liquid, investor-held stock with middling one-year strength.
The newest parts: Today, price levels, IPO box and alerts
The Today write-up
Under the chart, every stock page has a heading like “SBI share price today: what happened on 13 November”: a 300–450 word account of the latest session, written every trading evening from NSE’s end-of-day data by fixed rules, with no advice words. It covers the day’s range and sector rank, the last ten sessions, volume and delivery against normal, the 50 and 200-day averages, the 14-day RSI, the nearest price levels, F&O data and how the stock usually trades.
For SBI on 13 Nov 2026 it noted that the stock fell 0.60% while the typical Financial Services stock fell 0.89% (SBI ranked 74th of 167), that 57% of 1.59 crore shares were delivered against a 54% average, and that RSI was 72, adding that strong stocks can stay above 70 for weeks.
A Last five sessions table follows: close, change, volume and delivery %. Read the dates: SBI’s table included the short Sunday session of 8 Nov (Diwali Muhurat trading, only 19.51 lakh shares), and there was no session on 10 Nov.
Price levels by delivered volume
The last card in the section is a sideways bar chart. Each bar is a narrow price band; its length is how many shares were delivered in that band over the last 250 sessions (each day’s delivered shares are spread across that day’s high–low range). Peaks below the close are listed as support zones, peaks above as resistance, nearest first, with the distance and the share of the year’s delivery in each.
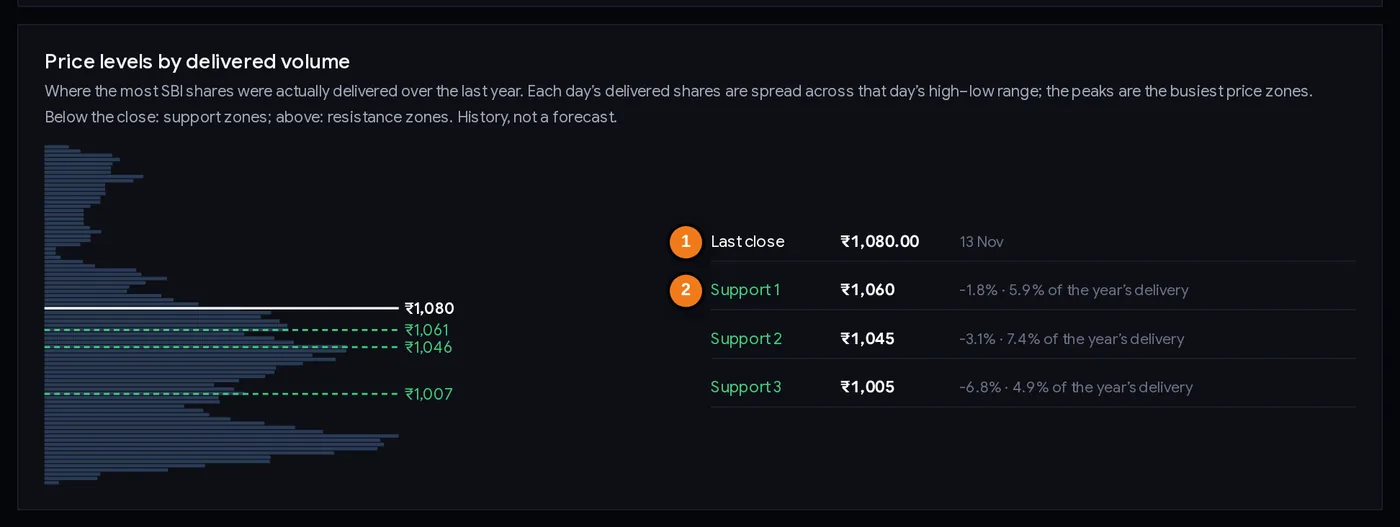
- 1Last close (the white line on the chart)
- 2Support zones below the close, nearest first, with the share of the year’s delivery
On 13 Nov 2026 SBI’s supports were about ₹1,060 (−1.8%, 5.9% of the year’s delivery), ₹1,045 and ₹1,005. No zone above the close met the rule, so no resistance was listed. For a stock listed under a year ago the chart uses all its sessions: MANIPALHOS (listed 5 Aug 2026) showed about ₹667 below (−2.1%) and ₹718 above (+5.4%). Traders use such zones to see where a move may pause and to place a stop loss beyond a zone, not exactly on it. They are history, not a forecast; a price can cut straight through.
The IPO box
Stocks that came through an IPO in ChartMine’s records (from October 2024) show an IPO section: issue price, listing date, subscription, listing gain at the opening price, return since the IPO, and how the listing gain ranked among 228 main-board IPOs.
| Stock (13 Nov 2026) | Issue price | Listed | Subscribed | Listing gain | Since IPO |
|---|---|---|---|---|---|
| Swiggy | ₹390.00 | 13 Nov 2024 | 3.59× | +7.7% | −52.1% |
| Shiprocket | ₹97.00 | 19 Aug 2026 | 99.4× | +35.1% | +32.2% |
New listings trading ₹1 crore a day get a page from their fifth session, but no Stock DNA or score until about six months of history. On 13 Nov 2026 there were 88 such young pages, including Shiprocket, MANIPALHOS and SBI Funds Management. See also IPO performance and the IPO calendar.
🔔 Get Telegram alerts
This button opens ChartMine’s Telegram alerts bot with the stock ready to add. On trading days at about 8:25 PM it sends one message about your stocks, only when something happened (a big move, a 52-week high or low, a big-buyer day, a signal, a deal, results ahead). The watchlist tutorial explains the commands. An alert is information to check, not a signal to trade.
Step by step: from 1,536 stocks to a shortlist
- Open the monitor in the evening (it is rebuilt after NSE’s files arrive; the site refreshes at about 8 PM and again around 10:15 PM IST). Check the “Updated” line: it names the trading session.
- Pick a view. F&O if you trade derivatives; Near 52W high for strength; Big-buyer today for unusual delivery.
- Sort by the column that matches your idea. RS for leaders, 1D for today’s movers, From 52W high for pullbacks, Volatility (low to high) for calmer names.
- Scan the first 20–30 rows and open two or three stock pages in new tabs.
- On each page read “Today”, then the timeline. What happened, how unusual were volume and delivery, and is there a result, dividend or deal that explains it?
- Check the chart, the price levels and the DNA. Is the trend up or down? Where are the nearest busy zones? Is the stock calm or wild? Is it liquid enough for your size?
- Star the ones worth following and write a one-line note in “My notes”: why you are watching and what would make you act. For an evening message when something happens, tap 🔔 Get Telegram alerts.
- Size before you trade. Use the stock’s volatility and the nearest zone to place a sensible stop, then the position size calculator.
Three ways people use it
Playbook A: the evening scan (swing traders)
Tap Near 52W high, sort by RS. These are strong stocks close to their highs. Open each page, skip those with results in the next few days (check the timeline and the results tracker), and keep the ones with a tight, orderly chart. Look at the support zones in the Today section: they show where many shares changed hands below the price. Star them; decide entry, stop and size before the next open.
Playbook B: the delivery detective
Tap Big-buyer today, keep the default sort (most traded first). For each name, look at the day’s move and the timeline. A big-buyer day on an up day after a long base can mean accumulation; on a sharp down day (like Thermax on 6 Nov 2026) it means heavy selling found buyers. Check the bulk and block deals to see if a known investor was involved.
Playbook C: the investor’s research file
Before buying any company, read its stock page top to bottom: fundamentals and peers (is the valuation reasonable for its sector?), shareholding changes (are promoters or funds adding?), dividends, results-day behaviour, and the DNA (how volatile is it, really?). Write your reasons in My notes. Revisit the page every quarter after results.
Whatever you do, decide what you are willing to lose on each idea before you buy. The data helps you choose; the stop loss protects you when the choice is wrong.
Case studies from 6 to 13 Nov 2026
1. SBI’s timeline: two big-buyer days, opposite stories
On 9 Feb 2026 SBI jumped 7.46% to ₹1,146 on a big-buyer day (2.19 crore shares delivered, 4.6× normal), its best day of the year. On 8 May 2026 it fell 6.66%, its worst day of the year; on 11 May, also a big-buyer day (3.4× normal), it fell another 4.48%. In November the pattern turned: SBI had big-buyer days on 5 Nov (+2.80%; five sessions later it was +7.96%), 11 Nov (+1.84%) and 12 Nov (+2.38%). Lesson: the timeline shows all of these side by side. Heavy delivery tells you big money was active, not which side it was on.
2. Thermax, 6 Nov 2026: “big-buyer” on a −17% day
Thermax appeared in the Big-buyer today view with delivery about 16× its normal, and it closed 17.27% lower at ₹2,746.30. Its row told the rest: RS 20, −31.2% over 3 months, 48% below its 52-week high, in Capital goods (the weakest sector that day). On 13 Nov 2026 Thermax was in the same view again, this time on a +1.98% day, still 47.4% below its high with RS 16. Lesson: always read the 1D column and the trend columns next to the big-buyer tag.
3. Near 52W high, 6 Nov 2026: 46 names, very different stories
The view held 46 stocks. ICICI Bank closed at its high (+4.75% on the day, RS 77); Divi’s Labs closed at its high after +51.7% in a year; Lumax Auto Technologies was 0.64% below its high after +101% in a year. A large bank breaking out, a large pharma trending, a small-cap doubling. Lesson: the filter finds candidates; the stock page tells you which kind each one is.
4. F&O view versus all stocks, 6 Nov 2026
Across all 1,421 stocks, 468 rose and 948 fell that day. In the F&O view, 134 rose and 82 fell. A week later, on 13 Nov 2026, it was the other way round: across all 1,536 stocks 543 rose and 990 fell, and in the F&O view only 54 rose while 164 fell. Lesson: the view you pick changes the picture. If you only watch F&O names, you can miss a broad sell-off in smaller stocks; the market breadth page shows the whole market.
5. Two IPO pages, 13 Nov 2026: same box, opposite stories
Exactly two years after listing, Swiggy closed at ₹186.70: −52.1% from its ₹390 issue price, RS 1, 55.7% below its 52-week high. Shiprocket, listed on 19 Aug 2026, was +32.2% at ₹128.20, but its page had no RS, Stock DNA or score yet: under three months of history. Lesson: the IPO box tells you how the listing went; the rest of the page tells you what happened after. A short history means fewer facts to judge, so size smaller.
Common mistakes
- Treating the monitor as live prices. It is end-of-day.
- Reading “big-buyer day” as “buying”. Case 2: −17.27% on a 16× delivery day.
- Sorting by 1Y return and buying the top. The wildest movers often carry the most risk; check volatility and liquidity.
- Skipping the timeline. Results, dividends and deals explain most big moves.
- Trusting the automatic pros and cons blindly. They are data-driven facts; they cannot judge one-off items or management quality.
- Ignoring liquidity. A stock trading ₹2 crore a day cannot absorb a large order without moving the price.
- Forgetting that the watchlist and notes live in one browser. Clearing site data deletes them.
- Treating support zones as floors. A price can fall straight through them.
- Expecting full data on a new listing. Recent IPOs lack Stock DNA, score and RS until they have enough history.
Research checklist for one stock
- Data date checked (latest trading day).
- Trend: price vs 50 and 200-day averages on the chart; distance from 52-week high.
- RS rating and the sector’s strength.
- Today write-up read; nearest support and resistance zones noted (as history, not targets).
- Timeline read: results, dividends, deals, big-buyer days, big moves.
- Upcoming results or ex-dates noted.
- Fundamentals and peers checked if holding for more than a few weeks.
- Volatility and liquidity fit your position size.
- Entry, stop loss and size written in My notes before acting.
Glossary
| Turnover | Value of shares traded, in ₹ crore. |
| Delivery % | Share of traded quantity taken into demat accounts rather than squared off intraday. |
| RS rating | 1–99 rank of 12-month performance against all tracked stocks. |
| P/E | Price ÷ earnings per share of the last four quarters. |
| Open interest (OI) | Number of futures or options contracts still open. |
| Market-wide limit (MWPL) | The cap on total F&O open interest in a stock; at 95% it enters the F&O ban. |
| Seasonality | Average behaviour by calendar month over many years. |
| Support zone | A price area below the close where many shares were delivered in the past. |
| Resistance zone | A price area above the close where many shares were delivered in the past. |
| Listing gain | How far a new share opened above (or below) its IPO issue price on listing day. |
Questions
How can I see all NSE stocks on one screen?
The ChartMine Stock monitor lists 1,536 actively traded NSE stocks (every F&O stock, stocks trading ₹1 crore a day or more, and recent IPOs from their fifth session) with returns, RS rating, distance from the 52-week high, delivery and volatility. Sort any column and filter with one tap.
What is a big-buyer day on ChartMine?
A day when a stock’s delivered shares were at least 3× its normal (the median of the previous 50 sessions) with a normal-or-higher delivery %. It shows heavy real ownership change; it can happen on up days or down days.
Is the stock monitor live?
No. It is rebuilt every trading day evening from NSE’s end-of-day files, and an “Updated” line names the session. For live sector moves during market hours, use the sector heatmap.
What does delivery percentage mean?
The share of traded shares that were actually delivered into demat accounts instead of being bought and sold within the same day. Higher delivery usually means more investor activity.
How does ChartMine find support and resistance levels for a stock?
From delivered volume: each day’s delivered shares over the last 250 sessions are spread across that day’s high–low range, and the busiest price zones are marked. Zones below the close are support, above are resistance. They describe the past, not the future.
What is on a ChartMine stock page?
A price chart, a daily write-up of the latest session, price levels by delivered volume, scores, a summary, pros and cons, stock DNA, fundamentals, balance sheet, peers, cash flow, 10-year history, dividends, delivery, a timeline, F&O data, results-day moves, seasonality and private notes.
Why does a new IPO stock page have no stock DNA or score?
Recent IPOs get a page from their fifth trading session, but rankings need more history. Stock DNA and scores appear once the stock has traded for about six months, and the RS rating after a year.
Is the stock monitor a stock recommendation tool?
No. It organises public NSE and company data for research and education. ChartMine is not a SEBI-registered adviser and does not recommend stocks.