
☰ All tutorials
Start here
Tool tutorialsHow to trade with ChartMineStocks
Stock monitorMy watchlistStock scores & checklistMarket & sectors
Nifty 50Bank NiftySensexFin NiftyDaily market reportMarket breadthSector rotationSector heatmapStock screenerRelative strength (RS)MCX commodity pricesFear & Greed IndexWhat happens after…Scanners
Top gainers & losersStocks to watch tomorrowNR7 stocks scannerInside bar stocks52-week high stocksGap up & gap down stocksRSI oversold stocksGolden cross stocksSuperTrend buy stocksScan builderEMA 9/21 crossoverMACD crossoverADX strong trendBollinger breakout / squeezeVolume spike stocksOpen = high / open = lowCandlestick pattern scannerNarrow CPR scannerF&O data
F&O ban listOI build-upOption chainPCR & max painExpiry calendarF&O lot sizesOI build-up heatmapPCR trendMax pain trendFutures basisStock screens
Quarterly growersProfit growth stocksLow P/E stocksMutual fund buyingNear 52-week low, growingDebt-free companiesHigh ROE & ROCEMagic Formula stocksLow price-to-bookSmart money
FII / DII dataShareholding changesBig-money footprintShort selling dataF&O positions by participantBulk & block dealsPromoter buyingDelivery percentageCalendars
Results calendarQuarterly results trackerBoard meetingsCorporate actionsIPO calendarIPO performanceResearch & planning
Strategy testerCompare stocksDividend yield stocksASM / GSM listExpiry-day movesSeasonality & stock historyNSE holidays 2026Position size calculatorOption payoff calculatorPivot point calculatorMore
Stock scanners hubStock screensHow to use the Magic Formula screen
A plain-language tutorial on Joel Greenblatt’s Magic Formula: what earnings yield, enterprise value and return on capital mean, how ChartMine ranks NSE companies and what it excludes, how to read the page, and what the 1 Jun 2026 top ten actually did.
What the Magic Formula is, in plain words
In 2005 the American investor Joel Greenblatt wrote a short book, The Little Book That Beats the Market, with a simple idea: buy good businesses at cheap prices, and do it with a mechanical rule so that emotions do not get in the way. He called the rule the “Magic Formula”. The name is marketing; the method is plain arithmetic.
The formula looks at every company through two numbers:
- How good is the business? Measured by return on capital: how much operating profit it earns on the money tied up in it.
- How cheap is the share? Measured by earnings yield: how much operating profit you get for the price of the whole company.
Every company is ranked on each number, the two ranks are added, and the companies with the lowest combined score are the “best”: the best mix of quality and price.
The Magic Formula stocks page does this for NSE companies after each update and shows the top 50.
One line to remember: the Magic Formula is a way to build a basket of reasonably priced good businesses and hold it for a year. Greenblatt was clear that it can lag the market for long stretches. It is not a list of stocks to trade next week.
The building blocks: EBIT, enterprise value, earnings yield, ROCE
Four terms do all the work. Each is explained with a real company.
| Term | Plain meaning | How ChartMine calculates it |
|---|---|---|
| EBIT (operating profit) | Profit before interest and tax. What the business earns, before lenders and the government take their share. | Profit before tax + finance costs, summed over the last four quarters. |
| Enterprise value (EV) | The price to buy the whole company: its shares, plus its debts (which you would take over), minus its cash (which you would get). | Market cap + borrowings − cash, bank balances and current investments, from the latest balance sheet. |
| Earnings yield (EY) | EBIT ÷ EV, in %. Like the interest rate you would “earn” on buying the whole company. Higher = cheaper. | Last four quarters’ EBIT ÷ EV. |
| ROCE (return on capital) | EBIT ÷ the capital in the business. Higher = better business. | Last four quarters’ EBIT ÷ average (equity + borrowings). |
Worked example: Coal India (data of 6 Nov 2026)
- EBIT over the last four reported quarters (Jul 2025 to Jun 2026): profit before tax ₹41,079 crore + finance costs ₹1,278 crore = ₹42,357 crore.
- Market cap at ₹400 a share: ₹2,46,509 crore. Borrowings: ₹15,435 crore. Cash and investments: ₹72,659 crore.
- EV = 2,46,509 + 15,435 − 72,659 = ₹1,89,285 crore.
- Earnings yield = 42,357 ÷ 1,89,285 = 22.4%. ROCE: 32%.
Why not just use P/E? Coal India’s P/E was 7.9, which is an “earnings yield” of 1 ÷ 7.9 = 12.7% on the share price. The EV version is higher (22.4%) because it uses profit before tax and gives credit for Coal India’s large cash pile. EV-based earnings yield lets you compare a debt-heavy company and a cash-rich one fairly.
How the ranking works (step by step)
- Start with eligible companies. Regular (non-finance) NSE companies with a market cap of at least ₹1,000 crore, positive EBIT and positive EV, four recent quarters of results and a balance sheet on the same basis.
- Remove companies the numbers would mislead on:
- Banks, NBFCs and other finance companies: borrowing is their business, so EV and ROCE mean something different.
- Holding companies with large minority interests: when the profit belonging to the company’s own shareholders is less than 90% of total consolidated profit, much of the EBIT belongs to other owners of subsidiaries, so EV/EBIT flatters the stock.
- Lease-heavy companies: lease liabilities are not reported separately in NSE filings, so they would be missing from EV and capital, making the company look cheaper and better than it is. A company is treated as lease-heavy when its finance costs are more than 20% of its borrowings and more than 10% of its EBIT.
- One-off quarters: if one quarter’s profit is more than three times the median of the last four, it is left out.
- Rank by earnings yield: highest EY = rank 1.
- Rank by ROCE: highest ROCE = rank 1.
- Add the two ranks. Lowest total = best. Show the top 50.
The 6 Nov 2026 ranking, worked out
We recalculated the ranking from the same filings and 6 Nov 2026 prices: 836 companies passed the filters, and the top ten came out in the same order as the live page except that two neighbours (Garuda and K.P. Energy, whose scores differ by two points) swapped places. The exact positions can shift slightly from day to day as new filings arrive. Here is how the top of the list was built:
| Company | Earnings yield (position) | ROCE (position) | Score |
|---|---|---|---|
| Chennai Petroleum | 33.4% (6th) | 58% (22nd) | 28: 1st on the list |
| Panama Petrochem | 34.8% (5th) | 49% (31st) | 36: 2nd |
| NALCO | 20.4% (19th) | 43% (38th) | 57: 3rd |
| Hindustan Zinc | 12.4% (72nd) | 94% (7th) | 79: 7th |
| Coal India | 22.4% (15th) | 32% (94th) | 109: 10th |
Notice how the formula balances the two: Hindustan Zinc is far from the cheapest, but its 94% ROCE pulls it up; Coal India is among the cheapest but only average on quality. Neither number alone decides.
How this differs from Greenblatt’s original
- Greenblatt measured capital as net working capital + net fixed assets; ChartMine uses equity + borrowings (capital employed), because that is what the filings give reliably.
- EBIT here is profit before tax plus finance costs, so it includes other income such as interest on cash.
- Greenblatt suggested buying 20–30 top names over a year and holding each for about a year. The page shows 50 so you can choose.
Advantages and limits (with an honest test)
✅ Removes emotion
A fixed rule stops you from buying only what is exciting or avoiding what is boring.
✅ Quality and price together
Most screens look at one or the other. Combining them avoids both “great but overpriced” and “cheap but broken”.
✅ Fair across capital structures
EV-based earnings yield compares debt-heavy and cash-rich companies on equal terms.
✅ Transparent
Both numbers are shown in the last column; you can check any company on its stock page.
The limits
- Backward-looking. It uses the last four quarters. If profits are at a peak, the formula sees a cheap, high-quality company just before profits fall.
- Cyclicals crowd the top. On 6 Nov 2026, five of the top ten were oil refiners and lubricant makers (Chennai Petroleum, Panama Petrochem, Gandhar Oil, Savita Oil, MRPL), all with profit up 200–420% on a year earlier: classic peak-margin numbers.
- Long losing stretches. Greenblatt himself stressed that the formula can trail the market for years at a time, which is when most people give up.
- Single stocks are noisy. The method is meant for a basket. Any one name can fall sharply.
What happened in a five-month test
We rebuilt the ranking on 1 Jun 2026 using only data filed before that day (four quarters to March 2026 and March 2026 balance sheets), took the top 50 and checked prices on 6 Nov 2026 (price change only; dividends not included):
| Group | Stocks | Median change | Average | Share that rose |
|---|---|---|---|---|
| Magic Formula top 50 (49 with prices) | 49 | −5.0% | −4.3% | 45% |
| All companies that passed the filters | 749 | −2.2% | +1.3% | 46% |
| All eligible stocks | 1,238 | −2.6% | +1.5% | 45% |
In plain words: over those five months the Magic Formula basket did worse than the market. That is one short period, and the formula is designed for holding periods of a year or more across many years. But it is a real result, and exactly the kind of stretch Greenblatt warned about. ChartMine’s balance-sheet history starts in 2025, so we could not test longer.
A tour of the screen
Open the Magic Formula stocks page.

- 1The method and the exclusions: banks, NBFCs, holding companies, under ₹1,000 crore.
- 2Always 50: the top 50 by combined rank.
- 3Date of the prices used.
- 4Fundamentals from each company’s latest filings.
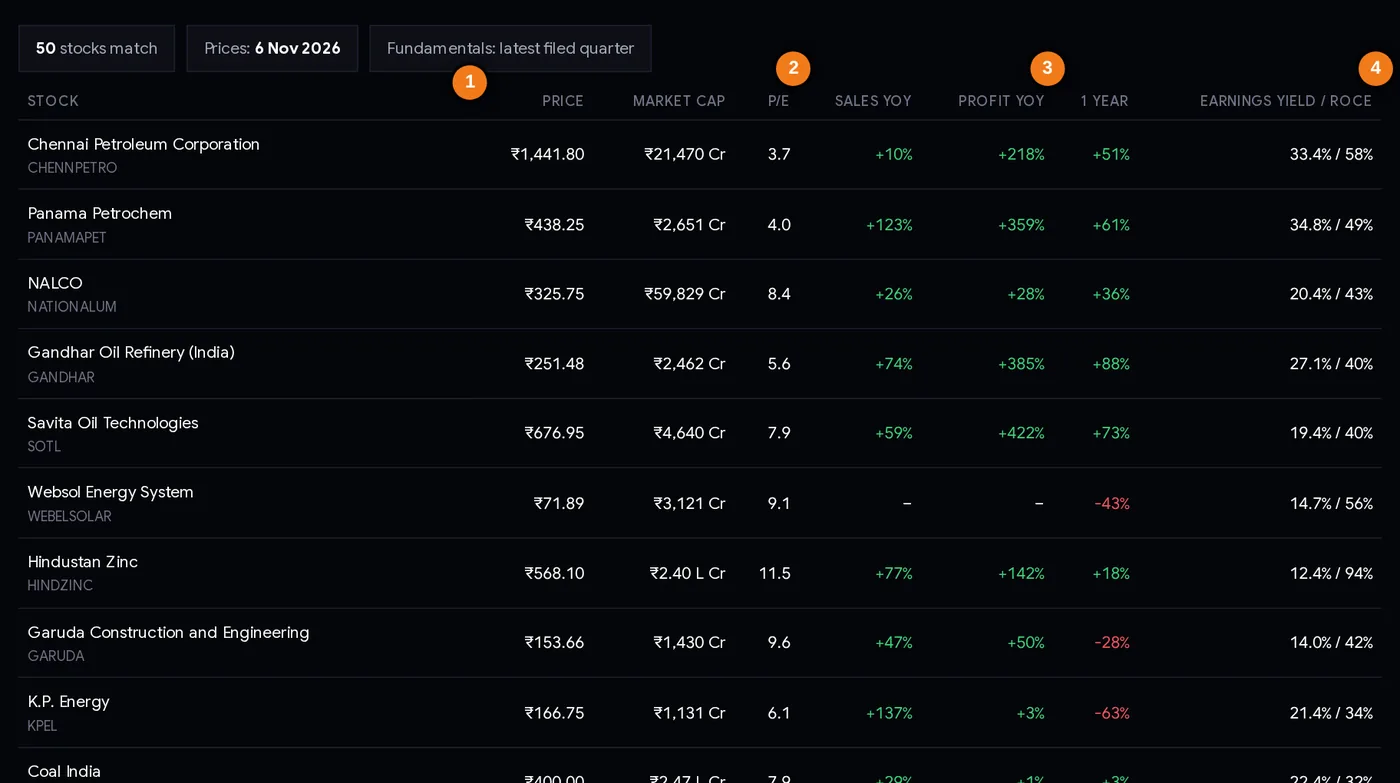
- 1Company and symbol, in rank order
- 2P/E: very low values often mean cyclical peak profits
- 3Profit growth on a year ago
- 4Earnings yield / ROCE: the two ranked numbers
Every column explained
| Column | What it tells you |
|---|---|
| Stock | Company and NSE symbol; click for the stock page. |
| Price / Market cap | Last close and market value (all names are ₹1,000 crore or more). |
| P/E | Price ÷ earnings per share, last four quarters. Many Magic Formula names have low P/Es; a P/E under 5 is often a cyclical warning. |
| Sales YoY / Profit YoY | Latest quarter against a year earlier. Profit up several hundred percent usually means unusually good margins. |
| 1 year | Share price change over the last year. |
| Earnings yield / ROCE | The two numbers that are ranked. The list is ordered by the combined rank, so the row order is the formula’s ranking. |

The three notes under the table summarise the method: Greenblatt’s idea, that it is meant as a basket, and that the numbers are trailing, not forecasts.
Step by step: running the formula the way it was designed
- Decide the size of the basket (Greenblatt suggested 20–30 stocks) and the total amount you are willing to put into this strategy.
- Open the list and read the top names. Remove any you cannot understand or that fail your own basic checks (fraud news, auditor resignations, pledged promoter shares).
- Limit sector crowding. If half the top 20 are refiners, cap any one industry at, say, two or three names, so one commodity price cannot sink the whole basket.
- Buy in instalments over the year (for example a few names each quarter), not all on one day. This spreads out timing risk.
- Hold each stock about a year, then replace it with the current top names. Do not sell early because a name is down; do not hold forever because it is up.
- Keep a record of every purchase and sale, and judge the strategy over several years, not months.
- Check taxes. In India, gains on shares held over 12 months are taxed as long-term capital gains at a lower rate than short-term gains, which partly explains why one-year holding periods are popular.
Three ways investors use the list
Playbook A: the mechanical basket (Greenblatt’s way)
Follow the steps above with discipline: 20–30 names, staggered buying, one-year holds, rebalance. The rule is the strategy; your job is to stick to it during bad years.
Playbook B: the idea generator
Use the list as a starting point for normal research. Pick names from the top 50 that you would be happy to own for years, read their results history and balance sheet, and skip the cyclical peaks. Many investors combine it with the debt-free and quarterly growers screens.
Playbook C: the cycle-aware version
Exclude companies whose profit is up more than, say, 100% on a year ago or whose industry is clearly at a peak, and keep the steadier compounders (for example Infosys was on the 6 Nov 2026 list with a 9.7% earnings yield and 42% ROCE, profit up 6%). This gives up some of the formula’s cheapness in exchange for less cyclical risk.
Position size matters most. In our 1 Jun 2026 test, one stock in the top ten fell 52% and another rose 104%. With 20–30 equal, small positions, no single name can make or break the result. Never put a large share of your savings into one Magic Formula stock.
Case study: the top ten of 1 Jun 2026
We rebuilt the ranking as it would have looked on 1 Jun 2026, then checked each of the top ten on 6 Nov 2026 (NSE closing prices, ₹; dividends not included).
| Rank | Stock | EY / ROCE on 1 Jun | 1 Jun close | 6 Nov close | Change |
|---|---|---|---|---|---|
| 1 | Solarworld Energy (SOLARWORLD) | 26.0% / 34% | 201.24 | 108.97 | −45.9% |
| 2 | Chennai Petroleum | 24.7% / 32% | 1,096.90 | 1,441.80 | +31.4% |
| 3 | Coal India | 17.1% / 32% | 472.60 | 400.00 | −15.4% |
| 4 | SRM Contractors | 14.3% / 32% | 509.70 | 370.35 | −27.3% |
| 5 | Sharda Motor Industries | 11.9% / 35% | 847.10 | 865.85 | +2.2% |
| 6 | D. P. Abhushan (DPABHUSHAN) | 12.5% / 32% | 930.80 | 1,900.50* | +104.2% |
| 7 | NALCO | 11.1% / 36% | 434.20 | 325.75 | −25.0% |
| 8 | Garuda Construction | 10.6% / 36% | 170.56 | 153.66 | −9.9% |
| 9 | MSTC | 15.3% / 28% | 444.30 | 589.80 | +32.7% |
| 10 | K.P. Energy | 11.2% / 33% | 350.55 | 166.75 | −52.4% |
*D. P. Abhushan has no NSE closing price in our data after 2 Nov 2026; the figure is its 2 Nov close.
What the ten tell you
- Four rose, six fell. The median change was about −12.7%; the simple average was about −0.5%, because one stock more than doubled.
- That is the basket logic in action. A few big winners can carry many losers. Someone who bought only rank 1 lost 46%; someone who held all ten was roughly flat.
- Dividends matter for high-yield names. Coal India paid ₹21 a share in dividends in this period (about 4.4% of its 1 Jun price) and Chennai Petroleum paid ₹79 (about 7%). A price-only comparison understates their return.
- Cheap can get cheaper. Solarworld and K.P. Energy looked cheap on trailing profits and still halved. The formula cannot see what happens next.
A second look: Chennai Petroleum, then and now
Ranked 2nd on 1 Jun with a 24.7% earnings yield, it rose 31% by 6 Nov and was ranked 1st with a 33.4% earnings yield, profit up 218% on a year earlier and a P/E of 3.7. When profit rises faster than the price, the stock looks cheaper even after a rally. That is exactly when cyclical risk is highest, and why Playbook C exists.
Common mistakes
- Buying only the top one or two names. The method relies on a basket; single names are a coin toss with fat tails.
- Giving up after a bad few months. The formula can lag for years; judge it over a full cycle or do not use it.
- Ignoring the cycle. Refiners, metals and commodity producers at peak profits look like perfect Magic Formula stocks.
- Buying everything on one day. Stagger purchases through the year.
- Forgetting what is excluded. Banks, NBFCs, holding companies, lease-heavy companies and small companies are not on the list by design.
- Treating the ranking as advice. It is arithmetic on public filings. ChartMine is not a SEBI-registered adviser.
Checklist before building a basket
- I understand the strategy can trail the market for two or three years.
- Basket of 20–30 names planned, equal small sizes.
- No more than two or three names from one industry.
- Names with profit up 100%+ or P/E under 5 checked for cyclical peaks.
- Purchases spread over the year; each holding reviewed after about 12 months.
- Basic red flags checked (governance news, auditor changes, pledged shares).
- Total amount in the strategy is money I will not need for several years.
Glossary
| Magic Formula | Joel Greenblatt’s method: rank by earnings yield and return on capital, add the ranks, buy the lowest totals. |
| EBIT | Earnings before interest and tax. Here: profit before tax + finance costs, last four quarters. |
| Enterprise value (EV) | Market cap + borrowings − cash and investments. The price of the whole company. |
| Earnings yield | EBIT ÷ EV, in %. Higher = cheaper. |
| ROCE | EBIT ÷ average (equity + borrowings), in %. Higher = better business. |
| Minority interest | The part of a subsidiary’s profit that belongs to its other shareholders, not the listed parent. |
| Cyclical | A business whose profits rise and fall with prices or the economy. |
| Rebalance | Selling old holdings and buying the current top names, usually yearly. |
| Basket | A group of stocks bought together so no single one dominates the result. |
Questions
What is the Magic Formula in stock investing?
Joel Greenblatt’s method from The Little Book That Beats the Market: rank companies by earnings yield (EBIT ÷ enterprise value) and by return on capital, add the two ranks, and buy a basket of the companies with the lowest combined score, holding each for about a year.
Does the Magic Formula work in India?
No method is certain to work, in India or elsewhere. In ChartMine’s five-month test (1 Jun to 6 Nov 2026) the top 50 NSE Magic Formula stocks did worse than the market, with a median price change of −5.0% against −2.6%. The method is designed for multi-year use with a basket of stocks.
How is earnings yield calculated?
Earnings yield is EBIT (profit before tax plus finance costs over the last four quarters) divided by enterprise value (market cap plus borrowings minus cash, bank balances and current investments).
Why are banks excluded from the Magic Formula?
Banks and NBFCs borrow as their business, so enterprise value and return on capital do not mean the same thing for them. Greenblatt also excluded financial companies.
How many Magic Formula stocks should I buy?
Greenblatt suggested 20 to 30 stocks, bought in instalments over a year and each held for about a year. Buying only one or two names makes the result depend on luck.
How often is the Magic Formula list updated?
With every ChartMine site update after the close: prices daily, results and balance sheets as companies file them. The ranking changes most in results season.
Why are so many refiners on the Magic Formula list?
Because the formula uses the last four quarters, companies with unusually high recent profits, such as refiners in a strong margin period, look both cheap and high-quality. Those profits may not last, so many investors limit such names.