
☰ All tutorials
Start here
Tool tutorialsHow to trade with ChartMineStocks
Stock monitorMy watchlistStock scores & checklistMarket & sectors
Nifty 50Bank NiftySensexFin NiftyDaily market reportMarket breadthSector rotationSector heatmapStock screenerRelative strength (RS)MCX commodity pricesFear & Greed IndexWhat happens after…Scanners
Top gainers & losersStocks to watch tomorrowNR7 stocks scannerInside bar stocks52-week high stocksGap up & gap down stocksRSI oversold stocksGolden cross stocksSuperTrend buy stocksScan builderEMA 9/21 crossoverMACD crossoverADX strong trendBollinger breakout / squeezeVolume spike stocksOpen = high / open = lowCandlestick pattern scannerNarrow CPR scannerF&O data
F&O ban listOI build-upOption chainPCR & max painExpiry calendarF&O lot sizesOI build-up heatmapPCR trendMax pain trendFutures basisStock screens
Quarterly growersProfit growth stocksLow P/E stocksMutual fund buyingNear 52-week low, growingDebt-free companiesHigh ROE & ROCEMagic Formula stocksLow price-to-bookSmart money
FII / DII dataShareholding changesBig-money footprintShort selling dataF&O positions by participantBulk & block dealsPromoter buyingDelivery percentageCalendars
Results calendarQuarterly results trackerBoard meetingsCorporate actionsIPO calendarIPO performanceResearch & planning
Strategy testerCompare stocksDividend yield stocksASM / GSM listExpiry-day movesSeasonality & stock historyNSE holidays 2026Position size calculatorOption payoff calculatorPivot point calculatorMore
Stock scanners hubStock screensHow to use the mutual fund buying list
A plain-language guide to following institutional investors: what the shareholding pattern is, how stake changes are measured, the types of fund buying, every column of both tables, three playbooks, real case studies and what our own test found.
What this list shows, in plain words
Indian mutual funds manage lakhs of crores of rupees from millions of SIP investors. They employ full-time analysts who meet company managements and study every result. Naturally, many retail investors want to know: which shares are the funds buying?
Every listed company must tell NSE, once a quarter, who owns its shares: promoters, mutual funds, foreign investors, insurance companies, retail investors and others. This is the shareholding pattern. By comparing two quarters, you can see whose stake went up and whose went down.
The Stocks mutual funds are buying page does that comparison for every NSE company above ₹500 crore. It shows two tables:
- Stocks where mutual funds raised their stake by at least 0.5 percentage points between the last two quarterly patterns.
- Stocks where foreign investors (FIIs) did the same.
On 9 Nov 2026 (prices of 6 Nov, holdings as of 30 Sep 2026 compared with 30 Jun 2026), 273 stocks had mutual fund buying of at least 0.5 points. Each table shows the 150 biggest rises.
One line to remember: the list tells you what funds did in the last quarter, not what they will do next, and not whether they were right. ChartMine is not a SEBI-registered adviser; use the list as one clue in your own research.
Key ideas: shareholding pattern, points and who the investors are
| Holder | Who they are |
|---|---|
| Promoters | Founders, families or parent companies that control the business (and the government in PSUs). |
| Mutual funds (MF) | Indian asset management companies investing SIP and lump-sum money. |
| FII / FPI | Foreign institutional (portfolio) investors: overseas funds, pension funds, sovereign funds. |
| Insurance companies | LIC and private insurers investing policyholders’ money. |
| Retail | Individual investors. |
Points, not percent
If funds owned 10% of a company and now own 11%, their stake rose by 1 percentage point. That is how the page measures change, and 0.5 points is the minimum to appear. In a small company, a single fund buying can move the stake by several points; in a giant like HDFC Bank, 1 point means thousands of crores.
A real example: HDFC Bank, quarter by quarter
From HDFC Bank’s shareholding patterns filed with NSE:
| Quarter end | Mutual funds | Foreign investors |
|---|---|---|
| 30 Sep 2025 | 26.02% | 48.39% |
| 31 Dec 2025 | 26.66% | 47.67% |
| 31 Mar 2026 | 29.54% | 44.05% |
| 30 Jun 2026 | 30.62% | 41.83% |
| 30 Sep 2026 | 31.88% | 39.40% |
Mutual funds added stake every quarter (+1.26 points in the latest one), while foreign investors reduced theirs by about 9 points over the year. Someone sells every share that someone else buys. Seeing both sides together is more informative than either alone.
Timing: when the data arrives
Companies file the shareholding pattern within 21 days after each quarter ends (31 March, 30 June, 30 September, 31 December). So the list changes mostly in the three weeks after each quarter end, and the information is always a few weeks old. The page compares two quarter-end filings and skips extra mid-quarter filings (which some companies make after a large deal) as the base.
Types of institutional buying you will see
| Pattern | What it usually means | Real example (from NSE filings) |
|---|---|---|
| Steady accumulation | Funds add a little every quarter over a year. | HDFC Bank: MF 26.0% → 31.9% over four quarters. |
| Other side of a promoter sale | The promoter sells a block; funds buy it. | KFin Technologies: promoters 22.8% → 14.1% and MF 16.7% → 27.0% in the September 2026 quarter. |
| Replacing foreign sellers | FIIs sell, domestic funds buy. | Swiggy: MF 17.2% → 29.0% and FII 16.1% → 8.9% from December 2025 to September 2026. |
| New listing | Funds build positions after an IPO. | Recent listings with no 1-year return, e.g. Shadowfax. |
| Unusually large jump | A big block purchase, or a change in how a holder is classified in the filing. | Foseco India: MF 0.38% → 13.41% in one quarter, promoter unchanged at 63.54%. Check the filing before reading too much into it. |
The pattern matters. Funds buying because a promoter sold is very different from funds buying while the promoter also holds steady.
Why investors follow fund buying: advantages and limits
✅ Professional research
Funds study companies in depth. Their buying is a hint about where research effort is going.
✅ Hard data
Shareholding patterns are official filings, not rumours.
✅ Both sides visible
The FII table next to the MF table shows who is buying and who is selling.
✅ Liquidity clue
Stocks with growing institutional ownership tend to get more research coverage and trading.
The limits
- It is weeks old. Holdings are as of the quarter end, filed up to 21 days later.
- Funds buy for many reasons. New fund launches, index changes and inflows force buying regardless of view.
- Funds can be wrong, and they hold for years; a retail investor’s horizon may differ.
- No price at which they bought is shown. They may have bought far below today’s price.
- Daily buying is not visible. For deals as they happen, see bulk and block deals.
Did following fund buying pay? Our test
We took the change in holdings from 31 Dec 2025 to 31 Mar 2026, which was public by 22 Apr 2026, and measured each share’s price change to 6 Nov 2026 (adjusted for splits and bonuses). Comparison: all NSE stocks above ₹500 crore with fundamentals.
| 22 Apr → 6 Nov 2026 | Stocks | Median change | Share that rose |
|---|---|---|---|
| Mutual funds +0.5 points or more | 247 | −0.7% | 49% |
| Mutual funds −0.5 points or more | 159 | −3.5% | 43% |
| Foreign investors +0.5 points or more | 163 | −5.2% | 40% |
| All stocks | 1,376 | −1.9% | 47% |
In plain words: stocks funds bought did slightly better than the average (about 1 point) and better than stocks funds sold (about 3 points). Stocks foreign investors bought did worse than average in this period. The differences are small, cover one six-month period, and the spread inside each group was huge: from −51% to +126% among the fund-bought stocks. Fund buying is a clue, not a signal you can follow blindly.
A tour of the page
Open Stocks mutual funds are buying. A heading with three facts, the mutual fund table, the foreign investor table, three reminder cards and links to the other screens.

- 1How many stocks had mutual fund buying of 0.5 points or more.
- 2Date of the prices used.
- 3Holdings and results come from each company’s latest filings.
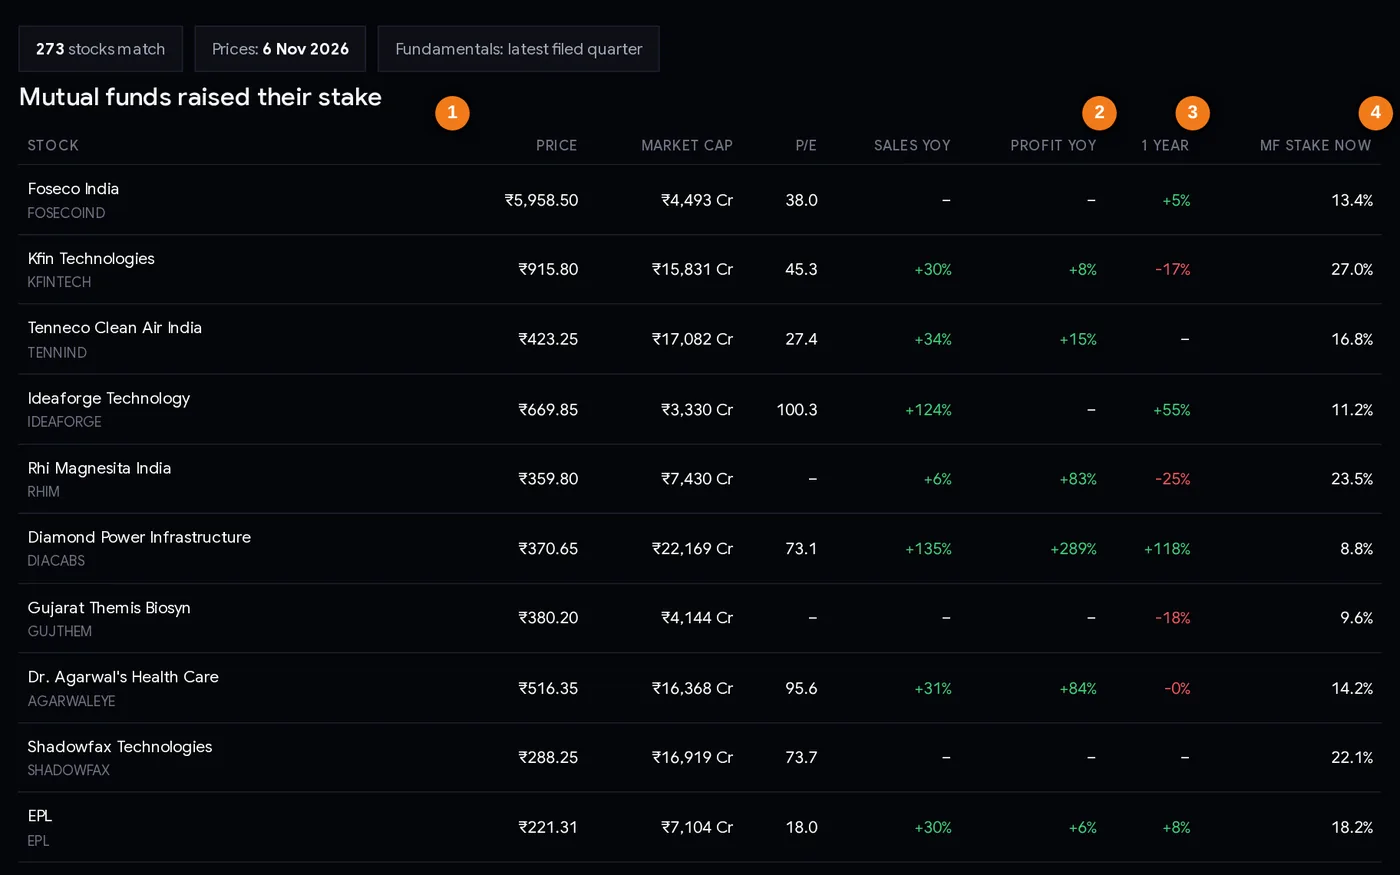
- 1Stock: biggest rise in fund stake first.
- 2Profit growth on a year ago: are results improving?
- 3Share price change over a year.
- 4Mutual funds’ total stake now.
Every column explained
| Column | How to read it |
|---|---|
| Stock | Name and symbol. The table is sorted by the size of the rise in fund stake, largest first. Click for the stock page, which shows the full ownership history and the exact change in points. |
| Price / Market cap | Last close; company value (L Cr = lakh crore). Small companies can see big point changes from one fund. |
| P/E | Price ÷ last four quarters’ EPS; “–” for loss-makers or recent listings. |
| Sales YoY / Profit YoY | Latest quarter against a year earlier. Funds buying a company whose results are improving is a stronger combination. |
| 1 year | Share price change over a year. Funds buying a stock that fell 50% are making a contrarian bet. |
| MF stake now | Mutual funds’ total stake after the rise. |
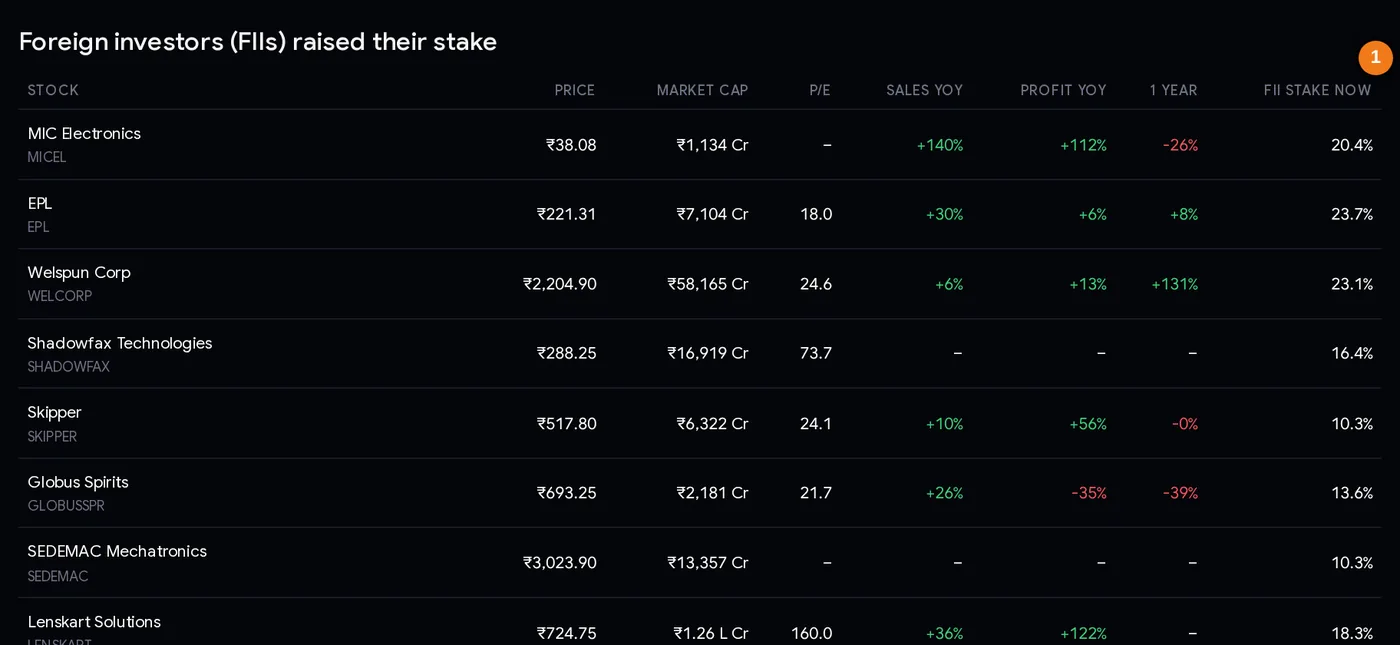
- 1Foreign investors’ total stake now.
The second table is the same for foreign investors, with “FII stake now” in the last column. A stock in both tables had both groups adding. A stock high in one table and losing stake in the other (check the stock page or the screener’s FII chg and MF chg columns) is changing hands between them.
Step by step: using the list well (20 minutes)
- Check the holdings date. The list reflects the latest quarter-end; in the three weeks after a quarter end, not every company has filed yet.
- Scan for names you understand. Skip businesses you cannot explain in a sentence.
- Open the stock page and read the ownership history. Who sold to the funds: promoters, FIIs, retail?
- Check the results columns. Funds buying a company with rising sales and profit is more reassuring than buying into losses.
- Look at the price trend. A stock down 40% with funds buying is a bet that the worst is over; it may not be.
- Check the size of the change versus company size. +5 points in a ₹1,500 crore company can be one fund.
- Write down why you would own it apart from “funds bought it”. If you cannot, skip it.
- Size the position and set an exit before acting.
Three playbooks
Playbook A: funds buying plus growing results
From the MF table keep stocks whose Sales YoY and Profit YoY are both positive. Cross-check with Quarterly growers. Institutions adding to a company whose results keep improving gives two independent pieces of evidence.
Playbook B: watch who is selling
Use the stock screener: MF chg min 0.5 and FII chg max −0.5. These are stocks moving from foreign to domestic hands. It tells you about money flows, not direction; in our cases below, such stocks went both up and down.
Playbook C: track a theme over several quarters
Steady accumulation over three or four quarters (like HDFC Bank above) shows conviction better than one big jump. Save the stock pages of names you care about and review the ownership chart after each quarter. The shareholding changes page helps with the bigger picture.
Funds can hold through a 40% fall; you may not be able to. Size positions to your own risk, not to the fund’s.
Case studies: the same signal, very different outcomes
All three had mutual funds raising their stake by more than 0.5 points between 31 Dec 2025 and 31 Mar 2026, public by 22 Apr 2026. Figures from NSE filings; prices from NSE’s daily files.
1. Laurus Labs: funds early in a growth phase
MF stake 9.49% → 11.22% (+1.73 points). Profit was rising: ₹252 Cr (Dec 2025 quarter) and ₹279 Cr (Mar 2026), then ₹368 Cr and ₹441 Cr in the next two quarters. The share went from ₹1,096.10 on 22 Apr to ₹2,340 on 6 Nov 2026 (+113%). Interestingly, by 30 Sep 2026 the MF stake had fallen back to 8.26% while foreign investors raised theirs to 30.84%. Lesson: fund buying combined with improving results worked well here, and funds themselves later sold into the rise.
2. Swiggy: funds kept buying, the price kept falling
MF stake 17.23% → 20.23% (+3.0 points), and funds kept adding all year, to 29.0% by September 2026. Foreign investors went the other way (16.07% → 8.86%). The company was still loss-making (loss of ₹800 Cr in the March 2026 quarter, ₹922 Cr in September 2026) though sales grew. The share fell from ₹294.70 on 22 Apr to ₹191.17 on 6 Nov 2026 (−35%). Lesson: heavy fund buying did not stop a large fall. Funds can take a multi-year view you may not share.
3. Sky Gold and Diamonds: small company, three signals
MF stake 8.66% → 10.33% (+1.67 points) in a company valued at roughly ₹6,500 Cr. It was also on the quarterly growers list, with sales and profit rising every quarter. The share went from about ₹422 on 22 Apr to ₹951.95 on 6 Nov 2026 (+126%). Lesson: fund buying worked best in our examples when results confirmed it. In smaller companies, a single fund’s purchase can move the stake a lot, so read it together with the results.
Common mistakes
- Copying funds blindly. Our test: only about 1 point better than average.
- Ignoring who sold. A promoter selling to funds is a different story from funds buying in the market.
- Forgetting the delay. The data is weeks old when published.
- Reading points as percent. +1 point on a 10% stake is +10% more shares held by funds.
- Trusting odd jumps. A rise of 13 points in one quarter deserves a look at the filing.
- Holding through any fall because “funds own it”. Swiggy fell 35% while funds bought more.
Checklist before you act
- Holdings date checked; the change is between two quarter-end filings.
- I know who sold to the funds (promoters, FIIs, others).
- Sales and profit are improving, or I knowingly accept a turnaround bet.
- The size of the change makes sense for the size of the company.
- Price trend and P/E checked.
- My own reason to own it, beyond fund buying, is written down.
- Exit condition and position size decided.
Glossary
| Shareholding pattern | The quarterly filing showing who owns a company’s shares. |
| Percentage point | The unit of change in a stake: 10% to 11% is +1 point. |
| MF | Indian mutual funds. |
| FII / FPI | Foreign institutional / portfolio investors. |
| DII | Domestic institutional investors: mutual funds, insurers, banks, pension funds. |
| Promoter | The controlling founder, family, parent company or government. |
| Block deal | A large trade between two parties in a special trading window. |
| Accumulation | Building a stake gradually over time. |
Questions
Which stocks are mutual funds buying right now?
ChartMine’s page lists NSE stocks where mutual funds raised their stake by 0.5 points or more in the latest quarterly shareholding pattern. On 9 Nov 2026, 273 stocks qualified (holdings as of 30 Sep 2026).
How can I see mutual fund holding changes in a stock?
Open the stock’s ChartMine page: the ownership section shows promoter, FII, mutual fund, insurance and retail stakes for recent quarters and the change from the previous quarter.
Where does the mutual fund buying data come from?
From each company’s shareholding pattern filed with NSE every quarter, within 21 days of the quarter end.
Should I buy stocks that mutual funds are buying?
Not just for that reason. In our test, stocks funds added to did only about 1 point better than the average stock over six months, and outcomes ranged from −51% to +126%. Use it as one clue alongside results and price.
What is the difference between FII and DII buying?
FIIs (FPIs) are foreign investors; DIIs are Indian institutions such as mutual funds and insurers. They often move in opposite directions, so the page shows both tables.
How often does the mutual fund buying list change?
Mostly once a quarter, in the three weeks after each quarter end when companies file their shareholding patterns. Prices update daily.