
☰ All tutorials
Start here
Tool tutorialsHow to trade with ChartMineStocks
Stock monitorMy watchlistStock scores & checklistMarket & sectors
Nifty 50Bank NiftySensexFin NiftyDaily market reportMarket breadthSector rotationSector heatmapStock screenerRelative strength (RS)MCX commodity pricesFear & Greed IndexWhat happens after…Scanners
Top gainers & losersStocks to watch tomorrowNR7 stocks scannerInside bar stocks52-week high stocksGap up & gap down stocksRSI oversold stocksGolden cross stocksSuperTrend buy stocksScan builderEMA 9/21 crossoverMACD crossoverADX strong trendBollinger breakout / squeezeVolume spike stocksOpen = high / open = lowCandlestick pattern scannerNarrow CPR scannerF&O data
F&O ban listOI build-upOption chainPCR & max painExpiry calendarF&O lot sizesOI build-up heatmapPCR trendMax pain trendFutures basisStock screens
Quarterly growersProfit growth stocksLow P/E stocksMutual fund buyingNear 52-week low, growingDebt-free companiesHigh ROE & ROCEMagic Formula stocksLow price-to-bookSmart money
FII / DII dataShareholding changesBig-money footprintShort selling dataF&O positions by participantBulk & block dealsPromoter buyingDelivery percentageCalendars
Results calendarQuarterly results trackerBoard meetingsCorporate actionsIPO calendarIPO performanceResearch & planning
Strategy testerCompare stocksDividend yield stocksASM / GSM listExpiry-day movesSeasonality & stock historyNSE holidays 2026Position size calculatorOption payoff calculatorPivot point calculatorMore
Stock scanners hubStock screensHow to use the Futures basis tool
A plain-language tutorial on futures premium and discount: how the basis and yearly carry are calculated, what moves them, how to read every part of the page, a test of the popular “discount is bearish” idea, and real case studies.
What the futures basis is, in plain words
A futures contract is an agreement to buy or sell a stock or an index at a fixed price on a future date (the expiry). On NSE, stock and index futures expire every month. The futures price is usually a little different from the spot price, the price of the share or index today.
That difference is the basis. ChartMine shows it as a percentage:
Premium (basis %) = (futures price ÷ spot price − 1) × 100
Positive = futures above spot (a premium). Negative = futures below spot (a discount).
Why is there a gap at all? Buying a future instead of the share lets you hold the same exposure while paying only a margin, so the money you did not spend can earn interest. The futures price therefore normally carries a small extra amount, roughly the interest on the full value until expiry. The share also pays any dividend to its owner, which the futures buyer does not get, so an expected dividend pulls the futures price down.
The futures basis page shows the near-month premium for NIFTY 50 and BANK NIFTY every day since July 2024, and today’s premium for every F&O stock, sorted from the deepest discount up.
One line to remember: a normal basis is a small premium that melts to zero at expiry. A basis that is unusually low or negative is a question to investigate (dividend? heavy shorting? closing-price noise?), not a signal by itself.
Premium and carry: the two numbers on the page
The raw premium has one problem: it shrinks automatically as expiry gets closer, because there are fewer days of interest left. A 0.5% premium with 25 days to go and a 0.5% premium with 3 days to go mean very different things. So the page also shows a yearly carry rate:
Carry, % a year = premium % × 365 ÷ days to expiry
This puts every day on the same scale, like an interest rate. Since July 2024 NIFTY’s carry has had a median of about 6.2% a year, close to typical short-term interest rates in India. The page leaves out the last two days before expiry, when tiny premiums divided by one or two days give wild numbers.
A worked example with real numbers
| 29 Oct 2026 | 6 Nov 2026 | |
|---|---|---|
| NIFTY spot close | 22,936.75 | 25,030.35 |
| Nov futures close (expiry 23 Nov) | 23,047.40 | 25,032.40 |
| Premium in points | 110.65 | 2.05 |
| Premium % | 0.48% | 0.01% |
| Days to expiry | 25 | 17 |
| Carry, % a year | 0.48 × 365 ÷ 25 = 7.0% | 0.008 × 365 ÷ 17 = 0.2% |
In six sessions the index rose about 9%, yet the futures premium almost disappeared. The futures did not “lead” the rally; they lagged it. More on this in the case studies.
What can move the basis
| Cause | Effect on the futures price |
|---|---|
| Interest cost (normal carry) | Small premium that shrinks to zero at expiry. |
| An expected dividend before expiry | Lower premium or a discount, roughly equal to the dividend as a % of the price. |
| Heavy short selling through futures | Can push futures below spot. |
| Strong demand for long futures | Higher premium than normal carry. |
| Closing-price timing | Futures and spot closes are calculated separately, so a single day can show a small premium or discount that means nothing. |
Why watch the basis: advantages and limits
✅ Spots dividends and special situations
A stock future at a steady discount often points to a dividend before expiry. The page lists them all at the top of its table.
✅ Shows the cost of a futures trade
If you buy futures instead of shares, the premium is part of what you pay. Carry tells you that cost as a yearly rate.
✅ Adds context to OI build-up
A long build-up with a rising premium, or a short build-up with futures at a discount, gives a fuller picture of what futures traders are doing.
✅ Index history since 2024
The NIFTY and BANK NIFTY charts let you see what a normal premium looks like through many expiries.
The limits (please read this part)
Many traders believe a NIFTY future at a discount is bearish and a big premium is bullish. We tested that on the same data: every day since July 2024 with at least three days to expiry, and NIFTY’s move over the next five sessions.
| When NIFTY carry was… | Days | Average move, next 5 sessions | Higher after 5 sessions |
|---|---|---|---|
| Below zero (futures at a discount) | 32 | +0.22% | 50% |
| Above 10% a year (rich premium) | 61 | −0.11% | 48% |
| Any day | 510 | −0.03% | 47% |
- A discount was not bearish in this period: the index was higher after five sessions half the time, slightly better than average.
- A rich premium was not bullish either.
- One-day readings are noisy. NIFTY’s premium went from −0.50% on 3 Aug 2026 to +0.42% on 6 Aug 2026, three sessions later, while the index barely moved.
- For stocks, a discount is very often a dividend (see the case studies), which is a known, mechanical effect, not a market view.
So how should you use it? To understand prices (why is this future cheap?), to know your cost of carry, and as supporting context for OI data. Not as a stand-alone direction signal.
A tour of the futures basis page
Open the futures basis page. It has a chart card for NIFTY 50, the same for BANK NIFTY, and a table of every stock future.
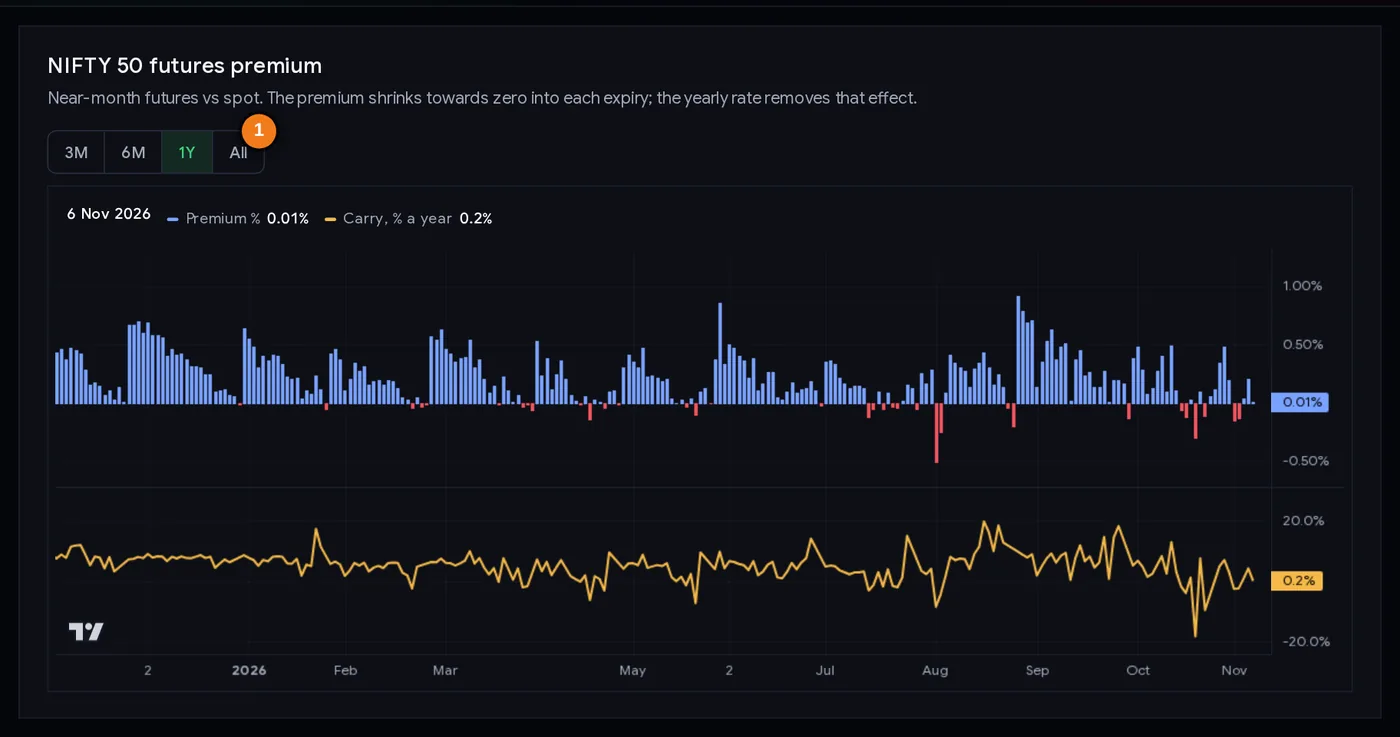
- 1Range buttons: 3 months, 6 months, 1 year or all history since July 2024.
Reading the index chart
- Top pane, bars: premium %. Blue bars above zero are a premium, red bars below zero a discount. Watch how each month’s bars shrink towards zero into expiry, then jump when the next month becomes the near month.
- Bottom pane, orange line: carry, % a year. This removes the shrinking effect. Most of the time it moves in a band; the sharp spikes are usually close to expiry or on single noisy days.
- Legend: hover over any day to see that day’s premium and carry. The range buttons change the period shown.
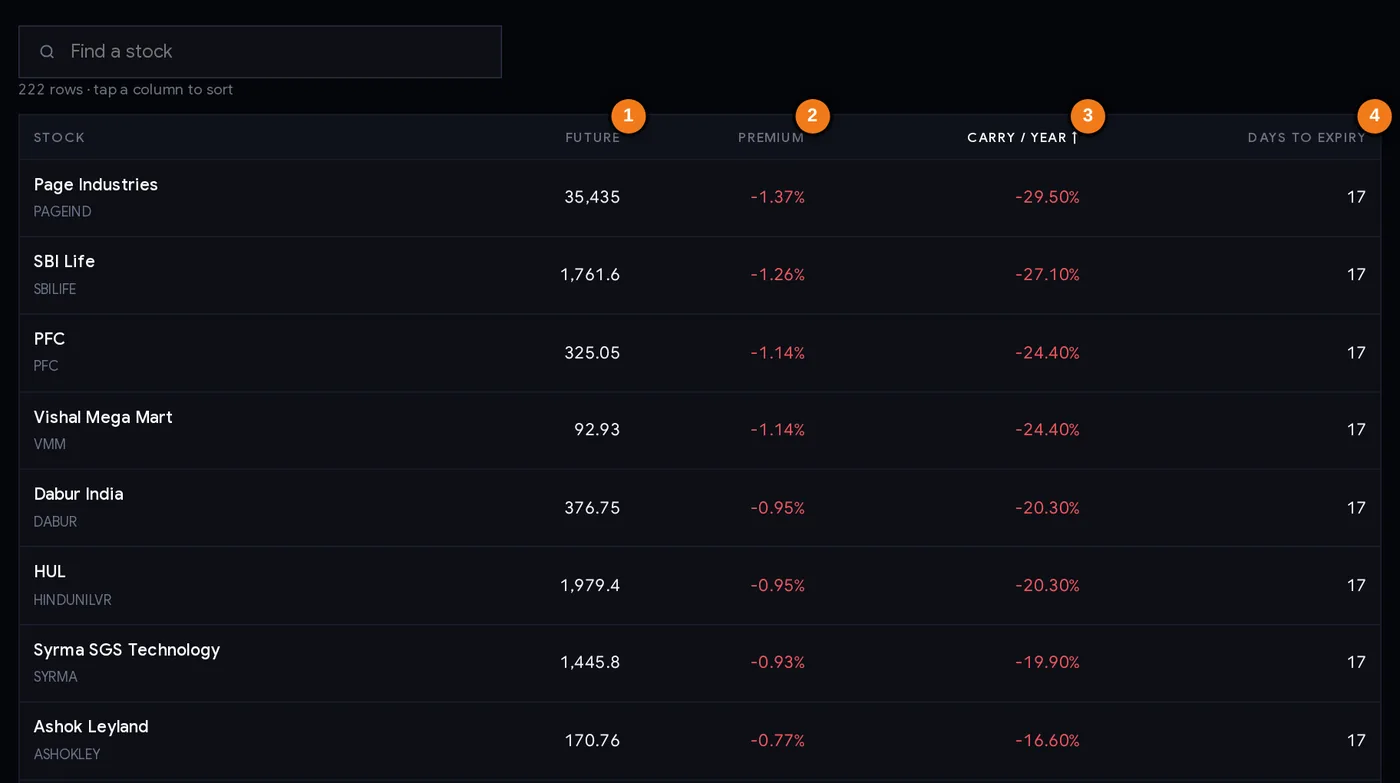
- 1Near-month futures price.
- 2Premium (or discount) to spot.
- 3Yearly carry rate; the table is sorted by it.
- 4Days to expiry.
Every column of the stock table
| Column | What it tells you |
|---|---|
| Stock | Name and symbol; click to open the stock page. |
| Future | The near-month futures closing price. |
| Premium | Futures vs spot, in %. Negative = discount. |
| Carry / year | The premium turned into a yearly rate. The table is sorted by this, lowest (deepest discount) first. |
| Days to expiry | Calendar days until the near-month contract expires. All stocks share the same monthly expiry. |
On 6 Nov 2026, 80 of the 222 stock futures in the table were at a discount and the median carry was 1.75% a year, unusually low because spot prices had run up fast in the rally.
Step by step: checking a stock future
- Find the stock in the table (sort by any column, or scroll). Note the premium, carry and days to expiry.
- Compare with normal. A carry of roughly 5–8% a year is in line with NIFTY’s usual range. A big negative carry is unusual.
- Check for a dividend. Open corporate actions. If an ex-dividend date falls before expiry, divide the dividend by the share price: if that is close to the discount, the dividend explains it.
- Check the history. Was the stock at a discount for several days, or just today? A one-day discount with no dividend may just be closing-price noise.
- Check the build-up. On the OI build-up page, see whether open interest rose (new positions) or fell, and in which direction.
- Check the calendar. Within two or three days of expiry the premium is tiny and the carry rate is unreliable.
- Decide whether it matters for your trade. For a futures buyer a discount is a slightly cheaper entry; for a short seller it is slightly worse. It rarely changes the trade by itself.
How traders use the basis
Playbook A: futures or shares?
If you want exposure to a stock for a few weeks, compare the futures premium with what holding the shares would cost you. A future trading at a premium has the interest built in; one at a discount because of a dividend has the dividend built out. Neither is “free”. The position size calculator handles lot sizes for futures.
Playbook B: reading build-up with the premium
Traders often combine three things: price change, OI change and premium. A long build-up while the premium widens suggests buyers are willing to pay up for futures. A short build-up with futures slipping to a discount suggests sellers are pressing. Treat this as description, then use price levels for the actual trade.
Playbook C: the dividend check before a short trade
If you short a stock future that is at a discount because of a dividend, remember the spot price is expected to fall by about the dividend on the ex-date. That fall is already in the futures price, so it is not extra profit for the short seller. Check the ex-date before reading the discount as weakness.
Risk first. Futures are leveraged: one RELIANCE lot (500 shares) at ₹1,323 on 6 Nov 2026 was worth about ₹6.6 lakh. Always size from your stop loss, not from the margin your broker asks for.
Case studies from real data
1. HUL, Nov 2026: a discount that is simply a dividend
From 28 Oct 2026, when the November contract became the near month, HUL’s future traded below spot every day, by 0.79% to 1.00% on seven of the eight sessions. On 6 Nov the spot close was ₹1,998.34 and the future ₹1,979.40: a 0.95% discount. NSE’s corporate actions list showed an interim dividend of ₹19, ex-date 12 Nov 2026. ₹19 ÷ ₹1,998.34 = 0.95%. The discount matched the dividend almost exactly.
2. Dabur, 6 Nov 2026: the same pattern
Dabur’s future closed at ₹376.75 against a spot of ₹380.35, a 0.95% discount. Dabur had an interim dividend of ₹3.50, ex-date 9 Nov 2026: ₹3.50 ÷ ₹380.35 = 0.92%. Again, most of the discount was the dividend.
3. Page Industries and SBI Life, 6 Nov 2026: unexplained one-day discounts
These two topped the table with discounts of 1.37% and 1.26% (carry −29.5% and −27.1% a year). Neither had a dividend in the corporate actions list. The day before, the gaps were only 0.04% and 0.16%. Lesson: a sudden one-day discount without a dividend might be selling pressure in futures, or just the two closing prices being struck at slightly different moments. Wait for a second day before reading anything into it.
4. NIFTY, 29 Oct to 6 Nov 2026: a rally the futures did not lead
As NIFTY rose from 22,937 to 25,030, the premium went from +0.48% (29 Oct) to a discount of −0.14% on 2 Nov and −0.13% on 3 Nov, and was just +0.01% on 6 Nov. Many traders expect a strong rally to come with a fat futures premium. This one did not: the buying was stronger in the spot market than in futures.
5. NIFTY, 3 Aug 2026: the deepest discount, then nothing
On 3 Aug 2026 NIFTY’s future closed 0.50% below spot with 22 days to expiry (carry −8.4% a year), the lowest reading with more than a week to go in the whole history. Three sessions later it was back to a +0.42% premium. Over the following week NIFTY drifted from about 24,615 (4 Aug) to 24,472 (11 Aug), a small move. The extreme reading did not lead to anything dramatic.
Common mistakes
- Reading every discount as bearish. For stocks it is often a dividend; for NIFTY our test found no edge.
- Comparing raw premiums across different days to expiry. Use the carry rate.
- Trusting the last two days before expiry. The premium is tiny and the yearly rate meaningless.
- Reacting to a one-day blip (case 3). Look at several days.
- Forgetting leverage. A small premium is nothing next to the size of a full futures lot.
- Ignoring corporate actions. Dividends, splits and bonuses all affect futures pricing.
Checklist before you use the basis
- I looked at the carry rate, not only the raw premium.
- The contract has more than three days to expiry.
- I checked for a dividend or other corporate action before expiry.
- I checked whether the discount or premium has lasted more than one day.
- I looked at the OI build-up for the same stock.
- My trade comes from price levels, with a stop loss and a position size based on the full lot value.
Glossary
| Futures contract | An agreement to buy or sell at a fixed price on the expiry date. |
| Spot | The current price of the share or index. |
| Basis / premium | Futures price minus spot, shown as % of spot. |
| Discount | A negative basis: futures below spot. |
| Cost of carry | The interest (minus dividends) built into the futures price. |
| Carry, % a year | Premium % × 365 ÷ days to expiry. |
| Near month | The futures contract with the closest expiry. |
| Ex-dividend date | The day from which a buyer of the share no longer gets the declared dividend; the share price usually falls by about the dividend. |
| Lot size | The fixed number of shares in one futures contract. |
| Rollover | Closing the near-month contract and opening the next month’s. |
Questions
What is futures basis in the stock market?
The difference between a futures price and the spot price. ChartMine shows it as a percentage of spot: positive is a premium, negative a discount.
Why do stock futures trade at a discount?
Most often because a dividend is due before expiry; the share price is expected to drop by the dividend, and the futures price already reflects it. On 6 Nov 2026 HUL’s 0.95% discount matched its ₹19 dividend almost exactly.
Is NIFTY futures at a discount bearish?
Not reliably. Since July 2024, on the 32 days NIFTY futures were at a discount with at least three days to expiry, the index was higher five sessions later 50% of the time, slightly better than on an average day.
How is carry per year calculated?
Premium % × 365 ÷ days to expiry. For example 0.48% with 25 days left is about 7.0% a year.