
☰ All tutorials
Start here
Tool tutorialsHow to trade with ChartMineStocks
Stock monitorMy watchlistStock scores & checklistMarket & sectors
Nifty 50Bank NiftySensexFin NiftyDaily market reportMarket breadthSector rotationSector heatmapStock screenerRelative strength (RS)MCX commodity pricesFear & Greed IndexWhat happens after…Scanners
Top gainers & losersStocks to watch tomorrowNR7 stocks scannerInside bar stocks52-week high stocksGap up & gap down stocksRSI oversold stocksGolden cross stocksSuperTrend buy stocksScan builderEMA 9/21 crossoverMACD crossoverADX strong trendBollinger breakout / squeezeVolume spike stocksOpen = high / open = lowCandlestick pattern scannerNarrow CPR scannerF&O data
F&O ban listOI build-upOption chainPCR & max painExpiry calendarF&O lot sizesOI build-up heatmapPCR trendMax pain trendFutures basisStock screens
Quarterly growersProfit growth stocksLow P/E stocksMutual fund buyingNear 52-week low, growingDebt-free companiesHigh ROE & ROCEMagic Formula stocksLow price-to-bookSmart money
FII / DII dataShareholding changesBig-money footprintShort selling dataF&O positions by participantBulk & block dealsPromoter buyingDelivery percentageCalendars
Results calendarQuarterly results trackerBoard meetingsCorporate actionsIPO calendarIPO performanceResearch & planning
Strategy testerCompare stocksDividend yield stocksASM / GSM listExpiry-day movesSeasonality & stock historyNSE holidays 2026Position size calculatorOption payoff calculatorPivot point calculatorMore
Stock scanners hubStock screensHow to use the Expiry-day moves tool
A plain-language tutorial on expiry days: how the page measures moves, what 190 monthly expiries since 2011 show for NIFTY and BANK NIFTY, how to read the stock table, how traders prepare, and real expiry-day case studies.
What this tool answers, in plain words
Every F&O contract on NSE has an expiry day: the last day it trades, when all open positions are settled. Index options expire every week (NIFTY) or every month (BANK NIFTY and the others); stock futures and options expire once a month.
Many traders believe expiry days are special: wilder swings, sudden spikes in the last hour, a market “pinned” to a big strike. The expiry-day moves page checks that belief with data. It answers three questions:
- Do NIFTY and BANK NIFTY move more on monthly expiry days than on other days? Every monthly expiry since 2011 (190 of them).
- And on weekly expiry days? Every weekly expiry since July 2024.
- Which F&O stocks move more (or less) on monthly expiry day than on a normal day? Each stock’s own record since 2016.
It also shows the average path of the index through the five sessions before monthly expiry, and the result of the last ten monthly expiries.
One line to remember: on average, expiry days have moved only a little more than normal days for NIFTY (±0.77% against ±0.72%) and slightly less for BANK NIFTY. The big expiry-day moves in history came with big news, not with expiry itself.
The key ideas and how they are measured
How a “move” is measured
The page uses the close-to-close change: today’s closing price against yesterday’s. It then takes the size of that change, ignoring direction. A day of −1.2% and a day of +1.2% both count as a 1.2% move. That is shown as ±. Averaging the size tells you how lively a type of day is, whichever way it went.
| Term on the page | Meaning |
|---|---|
| Monthly expiry day | Average size of the move on monthly expiry days (last Thursday of the month until August 2025, last Tuesday from September 2025; a holiday moves it to the previous trading day). |
| Other days | Average size of the move on all other days in the same period. |
| Ratio (×) | Expiry-day move ÷ other-day move. 1.06× means expiry days moved 6% more than normal days (not 6 percentage points). |
| Closed higher on expiry | The share of expiry days that ended up, against the same share for other days. |
| Weekly expiry days | The same comparison for weekly option expiries, from NSE’s F&O data since July 2024. |
| T-4 … Expiry | The average % change from the close five sessions before expiry, day by day, up to the expiry close. |
Monthly vs weekly expiry
- Monthly expiry settles every stock future and option plus the monthly index contracts. Big funds roll their positions from one month to the next around it.
- Weekly expiry settles only the weekly index options. It is the day heavy option-selling and option-buying activity is concentrated.
In 2026, for example, the monthly expiry was usually a Tuesday, but on 30 Mar 2026 it fell on a Monday and the next NIFTY futures expiry shown on the page is Monday 23 Nov 2026: holidays move expiry days. Check the expiry calendar.
Why this matters: advantages and limits
✅ Replaces a myth with a number
Instead of “expiry days are crazy”, you see the exact average move on 190 monthly expiries since 2011.
✅ Stock-by-stock records
The table shows which F&O stocks have tended to move more on expiry day, with how many expiries back that up.
✅ Helps plan option trades
If you buy or sell options into expiry, knowing a typical move size helps you judge whether a premium is cheap or expensive.
✅ Recent history in view
The last ten monthly expiries are listed, so you can see if the recent pattern differs from the long-run one.
What the numbers actually say
| NIFTY 50 | BANK NIFTY | |
|---|---|---|
| Monthly expiry day (190 since 2011) | ±0.77% | ±0.93% |
| Other days | ±0.72% | ±0.98% |
| Ratio | 1.06× | 0.95× |
| Closed higher on expiry day | 49% (53% other days) | 53% (53%) |
| Weekly expiry days since Jul 2024 | ±0.60% (±0.62% other days) | ±0.56% (±0.71% other days) |
And the “expiry effect” has faded. For NIFTY, splitting the 190 monthly expiries into periods:
| Period | Expiry days | Other days |
|---|---|---|
| 2011–2015 (60 expiries) | ±0.86% | ±0.80% |
| 2016–2020 (60) | ±0.79% | ±0.73% |
| 2021–2026 (70) | ±0.66% | ±0.65% |
The limits
- Close-to-close hides the intraday swing. An expiry day can whip 1% up and 1% down and still close flat. The page measures where the day ended, not how wild the path was.
- Averages hide the extremes. The average is small, but single expiry days have moved more than 4% (see the case studies).
- Stock records are noisy. A stock’s ratio is built from its monthly expiries since 2016, at most about 130 days. One extreme day can change it a lot.
- Direction is a coin toss. 49% for NIFTY and 53% for BANK NIFTY closed higher on expiry day. There is no reliable up or down bias.
A tour of the expiry-day moves page
Open the expiry-day moves page. At the top is the next NIFTY futures expiry date and a link to the expiry calendar. Then come one card for NIFTY 50 and one for BANK NIFTY, and finally the stock table.
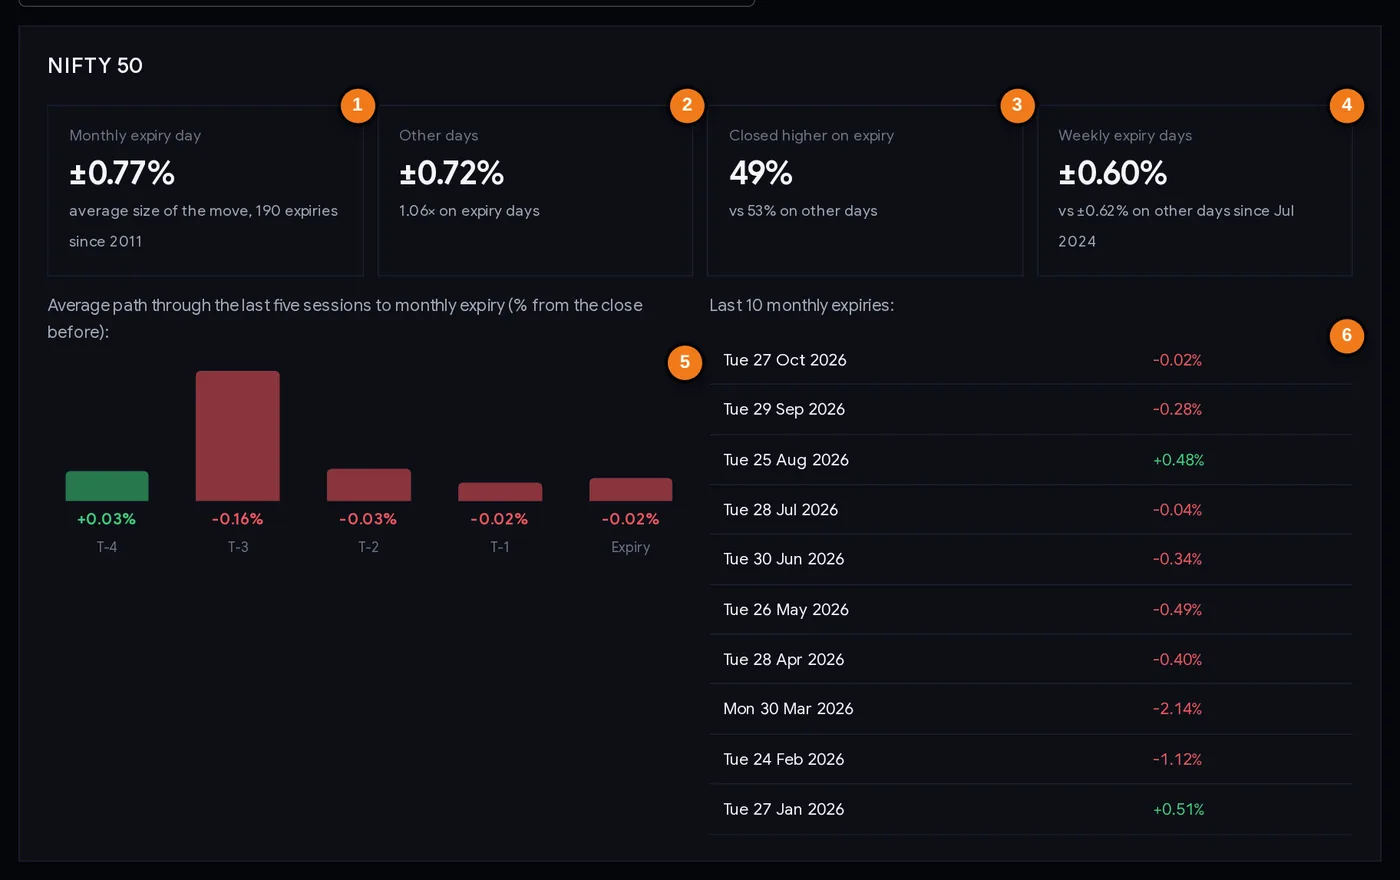
- 1Average move size on monthly expiry days since 2011.
- 2Average move size on other days, and the ratio.
- 3Share of expiry days that closed higher, vs other days.
- 4Weekly expiry days vs other days since July 2024.
- 5Average path through the five sessions before monthly expiry.
- 6The last ten monthly expiries.
The bar chart (5) shows the average path through the last five sessions before monthly expiry, as a % change from the close before the five sessions. For NIFTY the bars are all tiny (+0.03% to −0.16%): there is no meaningful pre-expiry drift on average. The table (6) lists the last ten monthly expiries, newest first, with that day’s close-to-close change.
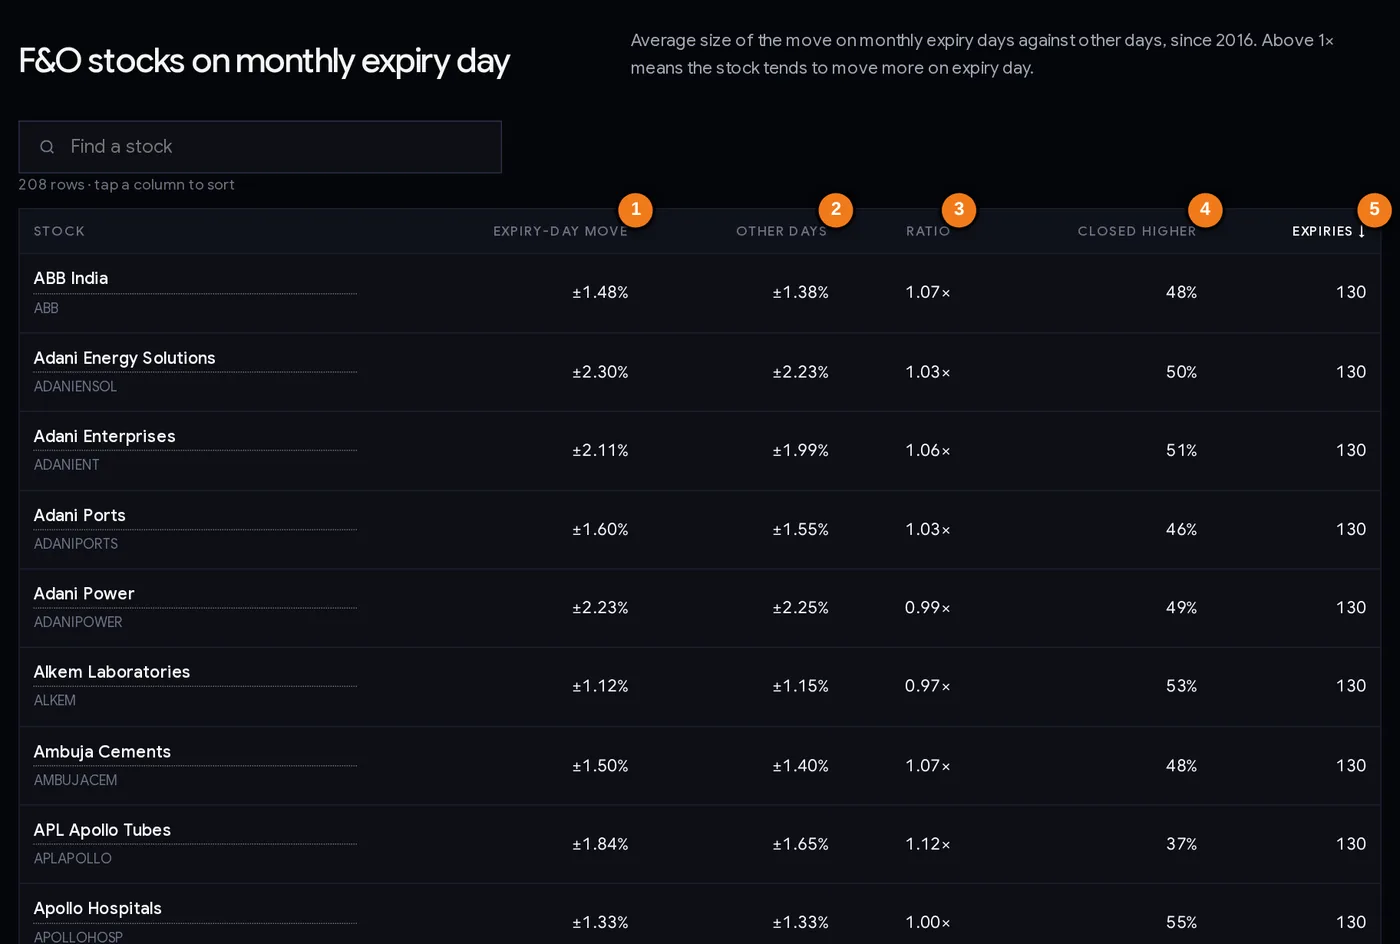
- 1Average move size on monthly expiry days since 2016.
- 2Average move size on other days.
- 3Ratio: above 1× = moves more on expiry day.
- 4Share of expiry days that closed higher.
- 5Number of expiries in the record (sorted by this).
Every column of the stock table
| Column | What it tells you |
|---|---|
| Stock | Name and symbol; click for the stock page. |
| Expiry-day move | The stock’s average move size on monthly expiry days since 2016. |
| Other days | Its average move size on all other days. |
| Ratio | Expiry ÷ other. Above 1× = moves more on expiry day. The table opens sorted by this. |
| Closed higher | Share of expiry days the stock ended up. |
| Expiries | How many monthly expiries are in the record. In the picture the table has been sorted by this column (tap its header), so the longest records come first. |
On 6 Nov 2026 the table covered 208 stocks. The median ratio was exactly 1.00×; 142 stocks were between 0.9× and 1.1×, 31 were at 1.1× or more and 35 at 0.9× or less.
Check outliers. If one stock shows a ratio far above all the others (for example 3× when nearly everything is between 0.7× and 1.3×), a single unusual day in its price history can be the cause. Open the stock’s page and look at its expiry days before trusting the number.
Reading the numbers: worked examples
Turning percentages into points and rupees
Percentages are easier to compare, but you trade in points and rupees. With NIFTY at 25,030 (6 Nov 2026):
| Figure | In % | In NIFTY points | Per lot of 65 |
|---|---|---|---|
| Average monthly expiry-day move | ±0.77% | about ±193 | about ₹12,500 |
| Average other-day move | ±0.72% | about ±180 | about ₹11,700 |
| Average weekly expiry-day move | ±0.60% | about ±150 | about ₹9,800 |
| Largest expiry-day move since 2011 | −4.78% | about −1,196 | about ₹77,800 |
The difference between an expiry day and a normal day is about 13 points on average. The difference between an average expiry day and the worst one is more than 1,000 points. Plan for the second number.
Reading two stock rows
- Reliance: expiry-day move ±1.11%, other days ±1.19%, ratio 0.93×, closed higher on 44% of 130 expiries. In plain words: Reliance has been slightly calmer on expiry day than on a normal day, with a long record behind the number.
- HDFC Bank: ±1.00% vs ±0.97%, ratio 1.03×, 49% higher, 130 expiries. Expiry day has been an ordinary day for it.
A ratio of 0.93× or 1.03× is too close to 1 to change how you trade. Only ratios well away from 1, backed by many expiries, deserve attention, and even then they say nothing about direction.
Step by step: preparing for an expiry
- Confirm the date. Read the next expiry at the top of the page and check the expiry calendar for holidays.
- Know the normal move. For NIFTY the average expiry-day move is about ±0.77%; at 25,000 that is roughly 190 points. For BANK NIFTY ±0.93%.
- Compare with what options are pricing. On the option chain, the at-the-money straddle (call + put at the nearest strike) shows the move the option market expects. If it is far larger or smaller than the typical move, ask why (events? recent volatility?).
- Check the last ten expiries. Have recent expiry days been calmer or wilder than the long-run average?
- For a stock, sort the table by “Expiries”, find the stock and check its ratio and record length. Fewer than about 24 expiries is a thin record.
- Check the news calendar. Results, policy meetings and global events on expiry day matter far more than expiry itself.
- Size the trade for the extreme, not the average. Use the position size calculator.
How traders use expiry-day statistics
Playbook A: option sellers checking the cushion
Traders who sell options on expiry morning want their strikes outside the likely move. The average move (±0.77% for NIFTY monthly, ±0.60% for weekly) gives a sense of scale, but the history includes days of −4.8% and +3.9%. A seller must decide in advance how a move several times the average would be handled, with a stop loss or by buying protection. The option payoff calculator shows the worst case.
Playbook B: option buyers avoiding “expiry lottery” thinking
Cheap far-away options on expiry day look tempting. The data says the typical expiry day is an ordinary day, so most of those options expire worthless. If you buy, size so that losing the whole premium is acceptable.
Playbook C: stock traders around monthly expiry
Some stocks have tended to move a little more on expiry day (Torrent Pharma 1.30× over 130 expiries; Kotak Bank and Wipro around 1.2×), some less (Jio Financial 0.68× over 34 expiries; Angel One 0.72×). Traders use this to set slightly wider or tighter expectations for the day, not to pick direction: none of these stocks has a strong record of closing higher (most are between 40% and 55%).
Case studies from real expiries
Index closes from the page’s daily data (NSE closes).
1. 24 Feb 2022: the biggest NIFTY expiry-day move since 2011
NIFTY fell 4.78% on that monthly expiry; BANK NIFTY fell 5.79%. It was the day Russia’s invasion of Ukraine began, and markets fell around the world. Lesson: the move came from the news; it would have happened on any day.
2. 26 Mar 2020: COVID-crash volatility
NIFTY rose 3.89% and BANK NIFTY 6.13% on that expiry, in a month when very large daily moves in both directions were common. Again, expiry day simply reflected the market of that time.
3. 30 Mar 2026: a volatile week ends with a volatile expiry
The monthly expiry fell on a Monday. Look at the days before it:
| Day | NIFTY close | Change | BANK NIFTY change |
|---|---|---|---|
| Mon 23 Mar | 22,513 | −2.60% | −3.72% |
| Tue 24 Mar | 22,912 | +1.78% | +2.27% |
| Wed 25 Mar | 23,306 | +1.72% | +2.10% |
| Fri 27 Mar | 22,820 | −2.09% | −2.67% |
| Mon 30 Mar (expiry) | 22,331 | −2.14% | −3.82% |
The expiry-day fall was no bigger than the other swings that week. BANK NIFTY closed 7.4% below the previous evening’s max pain (see the max pain tutorial). Lesson: expect expiry days to look like the market around them.
4. 2026 so far: a run of red expiries
Of the ten monthly expiries from January to October 2026, NIFTY closed lower on eight (only 27 Jan, +0.51%, and 25 Aug, +0.48%, were up). Over all 190 expiries since 2011, 49% closed higher. Lesson: ten days is a tiny sample. A short run like this is easy to mistake for a rule.
5. 27 Oct 2026: the quiet expiry
NIFTY changed just −0.02% on the October monthly expiry, closing at 22,750 after staying between the previous day’s S1 and R1 pivot levels all day (see the pivot point tutorial). Most expiries look like this one, not like cases 1 to 3.
Common mistakes
- Believing expiry day is always wild. NIFTY’s average expiry move is ±0.77%, close to a normal day.
- Ignoring the tail. The average is small, but −4.78% happened. Size positions for the bad day.
- Trading a direction bias. 49% up for NIFTY: no bias.
- Trusting short runs like 2026’s eight red expiries out of ten.
- Trusting a stock ratio built on few expiries or on one odd data point.
- Forgetting holiday shifts. Expiry moved to a Monday on 30 Mar 2026 and 23 Nov 2026.
Expiry-day checklist
- I know the exact expiry date (holidays checked).
- I know the typical expiry-day move for my index or stock, and the record length behind it.
- I compared it with what the at-the-money straddle is pricing.
- I checked the news and results calendar for that day.
- I planned for a move several times the average.
- Stop loss and position size are set; for options, losing the whole premium is acceptable.
Glossary
| Expiry day | The last trading day of an F&O contract, when it is settled. |
| Monthly expiry | The expiry of the monthly contracts: last Tuesday of the month from September 2025 (last Thursday before). |
| Weekly expiry | The expiry of weekly index options. |
| Close-to-close change | Today’s close vs yesterday’s close, in %. |
| Move size (±) | The change ignoring its sign. |
| Ratio (×) | Average expiry-day move ÷ average other-day move. |
| Rollover | Moving a position from the expiring contract to the next one. |
| Straddle | A call and a put at the same strike; its price reflects the move the market expects. |
| Settlement | The final cash or delivery adjustment of contracts at expiry. |
Questions
Is the market more volatile on expiry day?
Only slightly, on average. Since 2011 NIFTY moved ±0.77% on monthly expiry days against ±0.72% on other days; BANK NIFTY moved ±0.93% against ±0.98%. Large expiry-day moves have come with major news.
Does NIFTY usually fall on expiry day?
No. NIFTY closed higher on 49% of 190 monthly expiries since 2011, against 53% of other days. 2026 had eight lower expiries out of ten, but that is a small sample.
When is the monthly F&O expiry in India?
The last Tuesday of the month for NSE contracts from September 2025 (last Thursday before that). If it is a holiday, expiry moves to the previous trading day, as on Monday 30 Mar 2026.
Which stocks move the most on expiry day?
The page ranks every F&O stock with at least two years of expiries by the ratio of its expiry-day move to its normal move. Most are close to 1×; on 6 Nov 2026, 142 of 208 stocks were between 0.9× and 1.1×.
What was the biggest NIFTY expiry-day move?
Since 2011, −4.78% on 24 Feb 2022, the day Russia’s invasion of Ukraine began. The next largest was +3.89% on 26 Mar 2020 during the COVID crash.
Are weekly expiry days different?
Not much for NIFTY: ±0.60% on weekly expiry days against ±0.62% on other days since July 2024. BANK NIFTY moved less on its expiry days (±0.56% vs ±0.71%).