
☰ All tutorials
Start here
Tool tutorialsHow to trade with ChartMineStocks
Stock monitorMy watchlistStock scores & checklistMarket & sectors
Nifty 50Bank NiftySensexFin NiftyDaily market reportMarket breadthSector rotationSector heatmapStock screenerRelative strength (RS)MCX commodity pricesFear & Greed IndexWhat happens after…Scanners
Top gainers & losersStocks to watch tomorrowNR7 stocks scannerInside bar stocks52-week high stocksGap up & gap down stocksRSI oversold stocksGolden cross stocksSuperTrend buy stocksScan builderEMA 9/21 crossoverMACD crossoverADX strong trendBollinger breakout / squeezeVolume spike stocksOpen = high / open = lowCandlestick pattern scannerNarrow CPR scannerF&O data
F&O ban listOI build-upOption chainPCR & max painExpiry calendarF&O lot sizesOI build-up heatmapPCR trendMax pain trendFutures basisStock screens
Quarterly growersProfit growth stocksLow P/E stocksMutual fund buyingNear 52-week low, growingDebt-free companiesHigh ROE & ROCEMagic Formula stocksLow price-to-bookSmart money
FII / DII dataShareholding changesBig-money footprintShort selling dataF&O positions by participantBulk & block dealsPromoter buyingDelivery percentageCalendars
Results calendarQuarterly results trackerBoard meetingsCorporate actionsIPO calendarIPO performanceResearch & planning
Strategy testerCompare stocksDividend yield stocksASM / GSM listExpiry-day movesSeasonality & stock historyNSE holidays 2026Position size calculatorOption payoff calculatorPivot point calculatorMore
Stock scanners hubStock screensHow to use the OI build-up screener
A plain-language guide to open interest and futures build-up: futures for beginners, the four build-up types, premium, carry and rollover, an honest test on 120,000 stock-futures days, a tour of the screener and real case studies.
What OI build-up is, in plain words
A stock future is a contract to buy or sell a fixed number of shares (one lot) at a set price on a future date, the expiry. Every future has a buyer (who is long and gains if the price rises) and a seller (who is short and gains if it falls). You pay only a margin, so futures are a popular way to take leveraged positions.
At the end of each day, NSE reports how many futures contracts are still open. This is the open interest (OI). OI rises when new buyers and new sellers open fresh positions; it falls when existing positions are closed.
Price change on its own tells you who won the day. Put it next to the OI change and you get a clue about who acted: were new positions opened, or old ones closed? That combination is called the build-up.
One line to remember: rising OI means new money came in; falling OI means positions were closed. The price direction tells you which side was pushing. It describes today; it does not promise tomorrow.
The OI build-up page sorts every NSE stock future, plus the index futures, into the four build-up types after each close, and adds how many days each has lasted, the futures premium, yearly carry, rollover and volume against normal.
The four types of build-up
| Type | Price | OI | What it usually means |
|---|---|---|---|
| Long build-up | Up | Up | New buyers opened positions and were willing to pay up. Read as bullish positioning. |
| Short build-up | Down | Up | New sellers opened positions and pushed the price down. Read as bearish positioning. |
| Short covering | Up | Down | Existing short sellers bought back to close. The rise came from exits, not fresh buying. Often sharp, sometimes short-lived. |
| Long unwinding | Down | Down | Existing buyers sold to close. The fall came from exits, not fresh selling. |
How ChartMine calculates it
- Price change: today’s close of the near-month future versus its previous close.
- OI change: today’s change in open interest summed across all expiries, as a % of yesterday’s total. Summing matters near expiry: when traders roll from this month to next month, one contract’s OI falls and the other’s rises. Looking at the near month alone, that would look like long unwinding or short covering when nothing really changed.
- If price or OI is exactly unchanged, no label is given.
Real examples from 6 Nov 2026
- Coromandel International: future −4.59%, OI +70.72%, volume 5.4× normal: short build-up.
- Divi’s Labs: future +1.65%, OI +7.35%: long build-up, the 7th session in a row.
- NIFTY futures: +1.81%, OI −2.95%: short covering, also the 7th session in a row (case study 1).
- Kalyan Jewellers: future +5.16%, OI −11.6%: short covering.
The extra numbers: premium, carry, rollover and volume
Besides the build-up, the table has four columns that help judge how strong or unusual a position is.
| Column | How it is calculated | How to read it |
|---|---|---|
| Premium | (Future price ÷ spot price − 1), in % | Futures normally trade a little above the share price because buying the future instead of the share saves you interest until expiry. A discount (negative premium) can come before a dividend or with heavy short selling. On 6 Nov, BANK NIFTY futures were at a −0.18% discount. |
| Carry / year | Premium scaled to a year using the days left to expiry | Lets you compare premiums with different days to expiry. Shown only when 3 or more days remain. |
| Rollover | The share of total futures OI that is already in later months | Rises towards expiry as traders carry positions forward. High rollover means positions are being kept, not closed. On 6 Nov Anand Rathi Wealth showed 46%, the highest. |
| Volume vs 20d | Today’s futures volume ÷ the average of the previous 20 sessions | Above 2× means an unusually busy day. Astral (6.0×) and Coromandel (5.4×) topped the list on 6 Nov. |
The Days column counts how many sessions in a row the stock has shown the same build-up. To see those streaks as a picture, use the OI build-up heatmap.
Why traders watch build-up: advantages and limits
✅ Adds the “who” to the “what”
A 3% rise on fresh longs is a different story from a 3% rise on shorts running for cover. Build-up separates them.
✅ Every future in one table
All 220-odd stock futures and the index futures, sortable by OI change, streak, premium or volume.
✅ Roll-proof
OI is summed across expiries, so expiry-week rolling does not create false signals.
✅ Context columns
Volume against normal and streak length help you spot the days that actually stand out.
The limits: what our data says
We checked every stock-futures day from July 2024 to November 2026 (580 sessions, about 120,000 stock-days) and measured what the share price did next.
| Build-up today | Share higher next day | Average next-day move |
|---|---|---|
| All four types together | 49.4% | +0.01% |
| Long build-up | 49.7% | +0.06% |
| Short build-up | 49.1% | −0.04% |
| Short covering | 49.4% | +0.05% |
| Long unwinding | 49.7% | −0.01% |
| Strong long build-up (price up 2%+, OI up 5%+; 1,807 cases) | 52.6% | +0.21% |
| Strong short build-up (price down 2%+, OI up 5%+; 2,447 cases) | 46.4% | −0.29% |
- The label alone told you almost nothing about tomorrow: every type was a coin toss.
- Strong days leaned slightly in the direction of the build-up, especially strong short build-up. The tilt is small: even then the next day went the “other” way close to half the time.
- Five days later the picture was the same: long build-up stocks were higher 48.3% of the time, against 49.0% for all stocks.
So how should you use it? As a way to understand why a stock moved and to shortlist the unusual ones (big OI change plus high volume). The decision to trade still needs price levels, a stop loss and a position size.
A tour of the OI build-up screen
Open OI build-up. At the top are four counters, then the filter bar and the table.
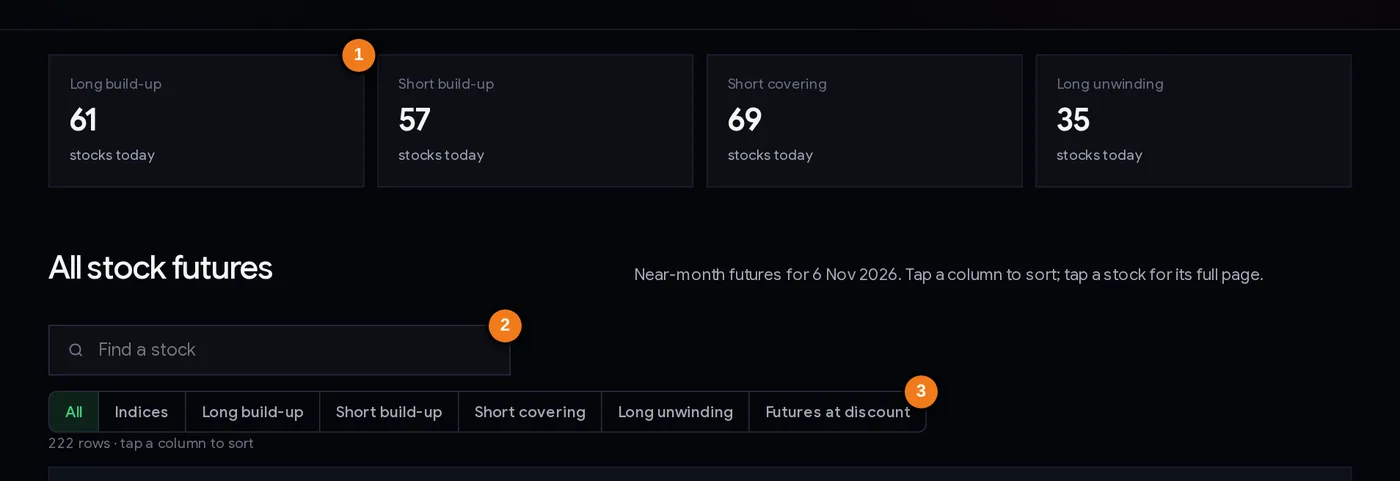
- 1Count of futures in each build-up type today
- 2Find a stock
- 3Filter by build-up type, indices, or futures at a discount
The counters show how many futures fell into each build-up type in the latest session. They are a quick market mood check: on 6 Nov 2026 there were 61 long build-ups, 57 short build-ups, 69 short coverings and 35 long unwindings, a day when shorts were closing as much as longs were opening. The search box finds any stock; the buttons filter the table to one build-up type, the indices, or futures trading at a discount.
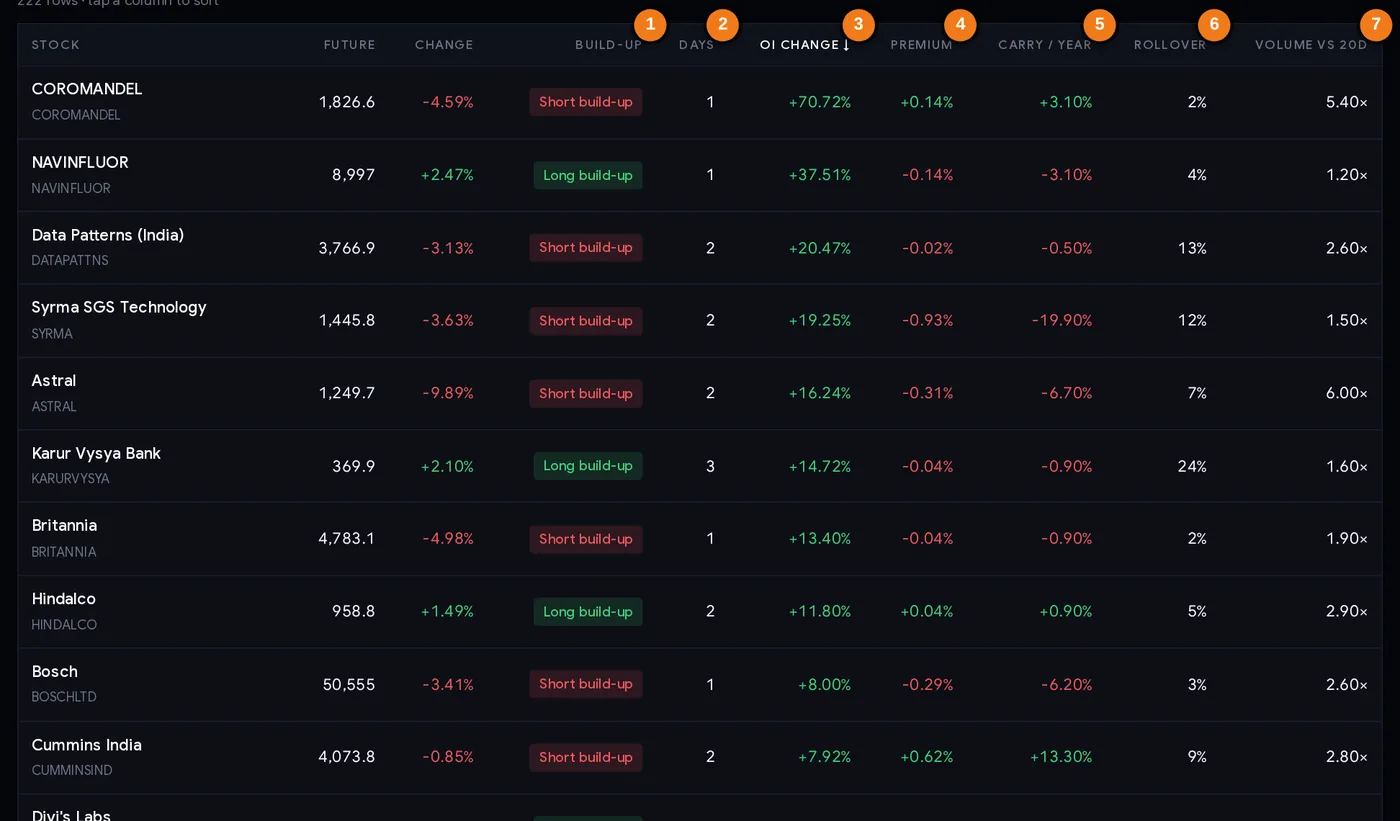
- 1Build-up type
- 2Days in a row with the same build-up
- 3OI change, all expiries
- 4Futures premium to spot
- 5Premium annualised (carry per year)
- 6Rollover: share of OI in later months
- 7Volume against the 20-day average
Every column explained
| Column | What it tells you |
|---|---|
| Stock | Company name and symbol. Click to open the stock’s page. |
| Future / Change | Near-month futures close and its % change on the day. |
| Build-up | Long build-up, short build-up, short covering or long unwinding. |
| Days | Sessions in a row with the same build-up. |
| OI change | % change in futures OI, all expiries summed. The default sort, largest first. |
| Premium / Carry per year | Future versus spot, and that gap annualised. |
| Rollover | Share of OI already in later months. |
| Volume vs 20d | Today’s futures volume against its 20-session average. |
Click any column header to sort by it; click again to reverse. “Show all” at the bottom lists every row.
Step by step: a 10-minute evening scan
- Open the page after the evening update and note the date in the table heading.
- Read the counters. Many short coverings in a rising market means the rally is partly shorts exiting; many short build-ups in a falling market means fresh selling.
- Check the indices first. Click Indices: what did NIFTY and BANK NIFTY futures do? Stock signals that agree with the index trend are easier to act on.
- Sort by OI change and look at the top 10 and the bottom 10. Ignore tiny moves; focus on OI changes of 5% or more with price moves of 2% or more.
- Sort by Volume vs 20d. The names at the top had an unusually busy day. Big OI change plus high volume is the combination worth a closer look.
- Check the streak (Days). A first-day signal is new; a long streak is an established trend, which can also be a crowded one (see the heatmap tutorial).
- Remove event risk. Look at the results calendar and the F&O ban list; a stock near the ban behaves differently.
- Open the chart for your shortlist and mark levels before deciding anything.
Three playbooks
Playbook A: follow strong build-up with the trend
Shortlist strong long build-ups (price up 2%+, OI up 5%+, volume above 1.5×) in a rising index, or strong short build-ups in a falling one. Next day, act only if the price confirms: for longs, a move above the build-up day’s high; for shorts, below its low. Stop beyond the other end of that day’s range. Our data shows only a small tilt for strong signals, so the confirmation and the stop are doing the real work.
Playbook B: be careful with short-covering rallies
A rise on falling OI is fuelled by shorts closing. It can be fast, but once the shorts are out, the buying can dry up. Traders who want to buy into such a move often wait for the build-up to turn into long build-up (fresh buyers arriving) before adding, and keep tighter stops while it is still short covering.
Playbook C: unusual activity as a research list
Very large OI jumps (30%+) are rare and deserve a look: was there news, results, an index change, or did the stock just join F&O? A stock that was added to F&O recently starts from a tiny OI base, so its % changes look huge for a few days (case study 3). Treat these as questions, not answers.
Position size first. Futures are leveraged: one lot can be worth several lakh rupees (see lot sizes). Decide your maximum loss per trade and use the position size calculator.
Case studies from 2026
Four real episodes from ChartMine’s futures history. Prices in ₹; index values in points.
1. NIFTY, 29 Oct to 6 Nov 2026: a rally built on short covering
From 29 Oct to 6 Nov, NIFTY futures showed short covering seven sessions in a row. The near-month future rose from 22,778.0 (28 Oct) to 25,032.4 (6 Nov), about +9.9%, while total futures OI fell from 1.74 crore to 1.39 crore units, about −20%. In plain words: much of the rise came from traders closing short positions, not from new longs. The rally was real and large; the build-up tells you what powered it. Whether it continues depends on fresh buyers arriving, which is exactly what the build-up column will show.
2. Adani Power, April 2026: long build-up that kept going
Adani Power showed long build-up for nine sessions in a row from 8 to 21 Apr 2026. The share rose from ₹163.36 (7 Apr) to ₹202.98 (21 Apr), +24.3%, and futures OI roughly doubled (+101.8%). Over the next five sessions it added another 10.0% (₹223.36 on 28 Apr). Lesson: sometimes strong positioning and price really do move together for weeks. But this was the exception: in our streak study, five-plus-day long build-up streaks were followed by a lower price five days later more often than not.
3. Syrma SGS, 29 Oct 2026: a huge OI jump on a tiny base
On 29 Oct the table showed Syrma SGS with long build-up: futures +6.65% and OI +87.6%. That looks dramatic, but Syrma had joined the F&O segment only the day before (its first futures data is 28 Oct), so OI was growing from almost nothing. The share closed at ₹1,669.0 that day and then slid to ₹1,459.3 by 6 Nov (−12.6%), when the label had turned to short build-up for two days. Lesson: check whether a big OI % comes from a small base.
4. KAYNES, 28 Oct 2026: short build-up that reversed
On 28 Oct KAYNES showed short build-up: futures OI +46.5%, share −6.3% (₹3,350.40 to ₹3,140.00). Five sessions later, on 4 Nov, the share was at ₹3,330.00, about 6% higher. The fresh shorts had also pushed the stock back into the F&O ban (see the ban list tutorial). Lesson: a strong bearish label can be wrong; a stop above the build-up day’s high would have limited the damage for anyone who sold on it.
Common mistakes
- Treating “long build-up” as “buy”. In our data the label alone was a coin toss for the next day.
- Ignoring the size of the move. Price +0.1% with OI +0.2% is technically long build-up, and means nothing.
- Reading near-month OI alone around expiry. Rolling makes it look like unwinding. ChartMine sums all expiries for you.
- Chasing short-covering rallies as if they were fresh buying.
- Missing the small-base effect in stocks that just entered F&O.
- Forgetting events. Results, dividends (which can push futures to a discount) and index changes move OI for reasons unrelated to conviction.
- No stop loss on leveraged futures. Case study 4 moved 6% against a short in five sessions.
Checklist before acting on a build-up signal
- The data is from the latest session.
- Price moved at least about 2% and OI changed at least about 5% (a “strong” signal).
- Volume was above normal (Volume vs 20d above about 1.5×).
- The signal agrees with the index trend.
- I know the streak length, and whether the stock just joined F&O.
- No results, dividend or ban issue this week, or I have accounted for it.
- I will wait for price confirmation next day.
- Stop loss and position size are decided before entry.
Glossary
| Futures | Contracts to buy or sell a lot of shares at a set price on the expiry date. |
| Long / short | Long gains if the price rises; short gains if it falls. |
| Open interest (OI) | Contracts still open at the end of the day. |
| Long build-up | Price up, OI up: fresh buying. |
| Short build-up | Price down, OI up: fresh selling. |
| Short covering | Price up, OI down: shorts closing. |
| Long unwinding | Price down, OI down: longs closing. |
| Near month | The futures contract with the nearest expiry. |
| Premium / discount | Futures price above / below the share price. |
| Rollover | Moving a position from the expiring month to a later one. |
Questions
Which stocks have long build-up today?
The OI build-up page lists every stock future by build-up type after each close; click Long build-up to filter. On 6 Nov 2026 there were 61 long build-ups and 57 short build-ups among the futures listed.
What is long build-up and short build-up?
Long build-up is price up with open interest up: new buyers opening positions. Short build-up is price down with open interest up: new sellers opening positions.
Is long build-up bullish?
It shows bullish positioning, but it is not a reliable forecast on its own. In ChartMine’s data from July 2024 to November 2026, stocks with long build-up were higher the next day 49.7% of the time, about the same as any stock.
What is short covering in the stock market?
A price rise with falling open interest: traders who had sold short are buying back to close. The rise comes from exits rather than new buying.
What is the difference between short covering and long build-up?
Both have a rising price. In long build-up open interest rises (new longs); in short covering it falls (shorts closing).
Why does ChartMine add up OI across all expiries?
So that rolling a position from the expiring month to the next does not look like positions being closed in one month and opened in the other.
What does rollover % mean?
The share of a stock’s futures open interest already in later months. It rises towards expiry as traders carry positions forward.