
☰ All tutorials
Start here
Tool tutorialsHow to trade with ChartMineStocks
Stock monitorMy watchlistStock scores & checklistMarket & sectors
Nifty 50Bank NiftySensexFin NiftyDaily market reportMarket breadthSector rotationSector heatmapStock screenerRelative strength (RS)MCX commodity pricesFear & Greed IndexWhat happens after…Scanners
Top gainers & losersStocks to watch tomorrowNR7 stocks scannerInside bar stocks52-week high stocksGap up & gap down stocksRSI oversold stocksGolden cross stocksSuperTrend buy stocksScan builderEMA 9/21 crossoverMACD crossoverADX strong trendBollinger breakout / squeezeVolume spike stocksOpen = high / open = lowCandlestick pattern scannerNarrow CPR scannerF&O data
F&O ban listOI build-upOption chainPCR & max painExpiry calendarF&O lot sizesOI build-up heatmapPCR trendMax pain trendFutures basisStock screens
Quarterly growersProfit growth stocksLow P/E stocksMutual fund buyingNear 52-week low, growingDebt-free companiesHigh ROE & ROCEMagic Formula stocksLow price-to-bookSmart money
FII / DII dataShareholding changesBig-money footprintShort selling dataF&O positions by participantBulk & block dealsPromoter buyingDelivery percentageCalendars
Results calendarQuarterly results trackerBoard meetingsCorporate actionsIPO calendarIPO performanceResearch & planning
Strategy testerCompare stocksDividend yield stocksASM / GSM listExpiry-day movesSeasonality & stock historyNSE holidays 2026Position size calculatorOption payoff calculatorPivot point calculatorMore
Stock scanners hubStock screensHow to use the Sensex page
A plain-language tutorial on ChartMine’s Sensex page: what BSE’s 30-stock index is, how it differs from NIFTY 50, what each number means, how to read the chart, returns and history since 2005, its weekly BSE expiry, and real case studies.
What the Sensex is, in plain words
The Sensex is one number that shows how 30 of India’s biggest listed companies are doing together. It is run by BSE, the Bombay Stock Exchange in Mumbai, and its full name is the BSE Sensex (you will also see the older name S&P BSE Sensex). The word comes from “sensitive index”. When most of these 30 big shares rise, the Sensex rises; when they fall, it falls.
The Sensex is the index most Indian newspapers and TV channels quote first. Headlines like “Sensex crashes 1,000 points” or “Sensex crosses 80,000” refer to it. Its base is 100 points in 1978-79, so a Sensex of 81,592.45 (the close on 13 November 2026) means this basket is worth roughly 816 times its base value, in price terms, without dividends.
ChartMine’s Sensex page collects what a learner needs on one screen:
- the latest end-of-day close and the day’s change;
- the all-time high (highest level ever traded) and the record close;
- the 52-week range;
- a chart from 1 month to the full history since January 2005;
- returns from 1 week to 10 years;
- a year-by-year table since 2005 and a free CSV download of daily data;
- market context cards: FII/DII flows, market breadth, seasonality and sectors.
One line to remember: the Sensex page shows where India’s 30 largest companies have been, measured with end-of-day data. It does not tell you where they will go next.
The page is not live. It is rebuilt after each trading session from BSE’s end-of-day data. The grey label under the title tells you which session the numbers belong to; on Saturday 14 November 2026 it said “data for the trading session of Fri 13 Nov 2026”.
Key ideas: close, all-time high, record close, 52-week range and returns
Each number on the page has an exact meaning. Knowing the difference saves a lot of confusion when you read news or social media.
| Term | Meaning in plain words | Sensex on 13 Nov 2026 |
|---|---|---|
| Close | The official level at the end of the trading day. Charts and returns use the close. | 81,592.45 (−0.39%) |
| Day’s range | The lowest and highest level traded during that session. | 81,288.75 to 81,879.51 |
| All-time high (intraday) | The highest level ever touched during any session, even for a moment. | 86,159.02 on 1 Dec 2025 |
| Record close | The highest level the Sensex has ever closed at. | 85,836.12 on 26 Sep 2024 |
| Distance from the high | How far the last close is below the all-time high, and how many sessions have passed since. | −5.30%, 236 sessions |
| 52-week range | The highest and lowest level of the last one year. | High 86,159.02 (1 Dec 2025), low 71,292.88 (1 Oct 2026) |
| Price return | % change in the index level between two dates, without dividends. | 1 year: −3.4%; 10 years: +204.2% |
| CAGR (a year) | The steady yearly growth rate that would give the same total return. | 10 years: 11.8% a year |
A Sensex oddity: a new high, but no new record close
For most indices the record close comes close to the all-time high in time. Not for the Sensex right now. Its record close, 85,836.12, is from 26 September 2024. More than a year later, on 1 December 2025, it traded up to 86,159.02 during the day, a new all-time high, but closed at 85,641.90, below the old record. On 2 January 2026 it closed at 85,762.01, just 74 points short. So the Sensex has a 2025 intraday high and a 2024 record close. Both numbers are correct; they answer different questions.
Points vs per cent
Because the Sensex is a large number, point moves sound dramatic. A 1,000-point fall at 81,592 is only about 1.2%. Always convert points to per cent before you judge a day. The page shows both.
Price return vs total return
The Sensex is a price index: dividends paid by the 30 companies are not added back. An investor in a Sensex index fund receives those dividends, so would have earned a little more than the returns on the page, before costs and taxes.
Sensex vs NIFTY 50: what is the same and what is different
Beginners often ask which index is “the market”. Both are. They measure almost the same thing in slightly different ways.
| Sensex | NIFTY 50 | |
|---|---|---|
| Exchange | BSE | NSE |
| Number of companies | 30 | 50 |
| Base | 100 in 1978-79 | 1,000 on 3 Nov 1995 |
| Level on 13 Nov 2026 | 81,592.45 | 25,144.30 |
| Weekly options expiry | Thursday (on BSE) | Tuesday (on NSE) |
| Data on ChartMine | Daily closes since 3 Jan 2005 | Daily closes since 3 Jan 2000 |
They move together, almost always
Both indices hold India’s largest companies, so they move in step. In the 250 sessions to 13 November 2026, the Sensex and NIFTY 50 closed in the same direction on 96.4% of days, and the correlation of their daily returns was 0.989 (1.0 would mean identical). Over long periods the results are close too:
| Period to 13 Nov 2026 | Sensex | NIFTY 50 |
|---|---|---|
| 2026 so far | −4.3% | −3.8% |
| 1 year | −3.4% | −2.8% |
| 3 years | +25.7% | +29.3% |
| 5 years | +34.4% | +38.9% |
| 10 years | +204.2% | +203.1% |
Over 10 years they finished almost level. Over 3 and 5 years NIFTY 50 did a few points better, because its extra 20 companies did better than the Sensex’s 30 in that stretch. With only 30 stocks, each Sensex heavyweight carries more weight, so one big company’s results can move the Sensex a little more than NIFTY.
Practical rule: use whichever index matches what you trade. If you trade NSE F&O, follow NIFTY 50 and its page. If you trade Sensex options on BSE, or you simply follow the news, use the Sensex page. For long-term questions either one gives nearly the same answer.
Why the Sensex matters: advantages and limits
The headline index
Most news reports, TV tickers and older market history are written in Sensex points. Knowing its levels helps you read the news correctly.
Long, simple history
ChartMine’s data runs from 3 January 2005: 5,424 daily rows on 13 Nov 2026. That covers 2008, 2020 and every boom in between.
BSE derivatives
Sensex options are BSE’s main F&O product, with a weekly Thursday expiry, a different day from NIFTY’s Tuesday.
Benchmark
Many large-cap funds and older portfolios compare themselves with the Sensex. It is a fair yardstick for a large-cap portfolio.
Limits you should know
- Only 30 companies. It ignores midcaps and small caps. On 13 Nov 2026 the Sensex fell only 0.39%, yet 952 of 1,448 most traded NSE stocks declined. Use market breadth for the wider picture.
- No option chain here. ChartMine’s PCR, max pain and option chain pages use NSE files. Sensex options trade on BSE, so the Sensex page has no PCR or max pain card.
- Intraday detail only for the last year. Daily candles start on 4 Jun 2025. Before that the chart shows weekly closes, and the yearly table uses closing levels.
- End of day. It is not a live ticker and cannot be used to time intraday trades.
- History is not a forecast. The Sensex lost 52.4% in 2008 and gained 81.0% in 2009. A 10-year average of 11.8% a year hides years like these.
A tour of the Sensex page
Open the Sensex page. The top strip answers the four questions people search for most.

- 1Last close and the day’s change
- 2All-time high (intraday) and its date
- 3Distance from the all-time high and sessions since
- 452-week high and low with dates
| Box | What it shows | How to read it |
|---|---|---|
| Close on <date> | Latest end-of-day close and % change from the previous close | Green is an up day, red a down day. Check the date first. |
| All-time high | Highest intraday level ever, with its date | For the Sensex this is 1 Dec 2025, not the 2024 record close. |
| From all-time high | % gap from the all-time high and sessions since | 236 sessions on 13 Nov 2026: the index has gone sideways to lower for about a year. |
| 52-week range | One-year high and low with dates | Shows where the last close sits inside the year’s range. |
The chart
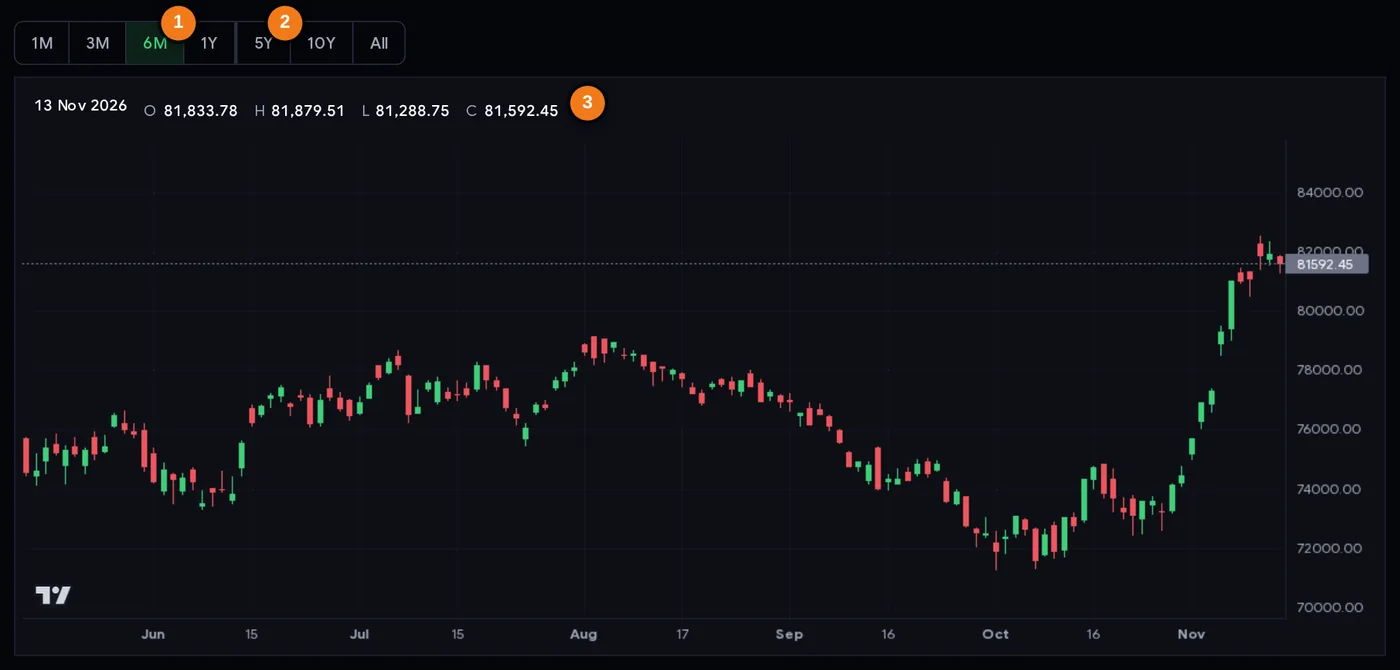
- 11M to 1Y: daily candlesticks (opens on 6M)
- 25Y, 10Y and All: weekly closing line
- 3Legend: open, high, low and close of the day under your cursor
The chart opens on 6M. The buttons 1M, 3M, 6M and 1Y show daily candlesticks (green when the close is above the open). 5Y, 10Y and All switch to a line of weekly closes going back to January 2005. Move the mouse or your finger over the chart and the legend shows that day’s open, high, low and close (O, H, L, C), or the week’s close on long views. The mouse wheel does not zoom, so the page scrolls normally.
All-time high block
Below the chart, four boxes give the intraday high (86,159.02, 1 Dec 2025), the record close (85,836.12, 26 Sep 2024), the gap from the record close (−4.94% on 13 Nov 2026) and the points needed to reach the all-time high (4,566.57).
Returns

- 1Short periods show the % change and the starting level
- 21-year price return
- 3Longer periods also show the compounded rate a year
Seven boxes show price returns over 1 week, 1 month, 3 months, 1 year, 3, 5 and 10 years. Short periods show the starting level; 3 years and more also show the compounded yearly rate. The line below says that since 3 January 2005 (6,679.20) the Sensex is up 1,122%, about 12.1% a year, without dividends.
Historical data table and CSV
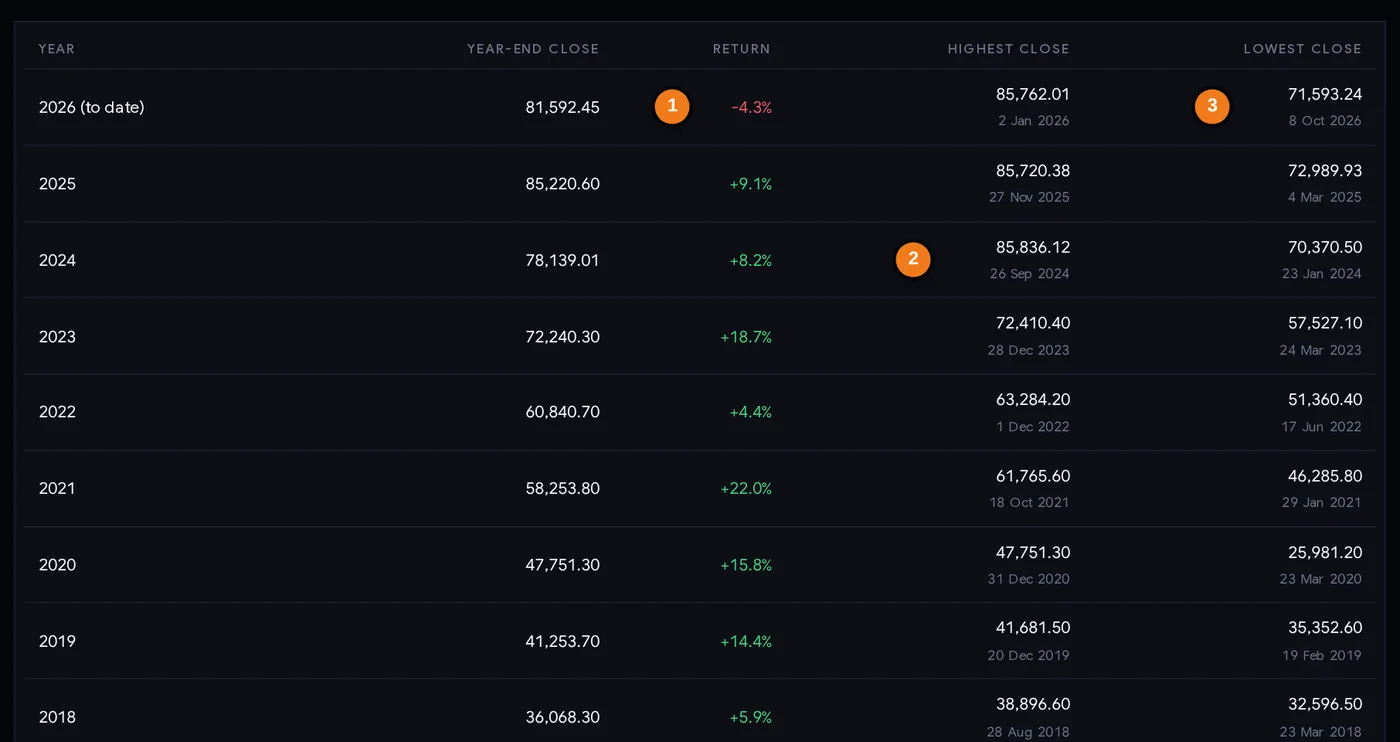
- 1The year’s price return (2026 is to date)
- 2Highest close of the year with its date; the highlighted row has the record close
- 3Lowest close of the year with its date
One row per calendar year since 2005: year-end close, the year’s return, and the highest and lowest close with dates. The year with the record close (2024) is highlighted. The button below downloads a CSV with the daily open and close for every session since 3 January 2005, which you can open in Excel or Google Sheets.
Market context and Go deeper
Four cards follow: FII / DII cash flows (on 13 Nov 2026: FII +₹5,737 crore, DII −₹2,254 crore), market breadth, Sensex seasonality and the sector heatmap. The Go deeper links open event studies of the Sensex on Budget day, election results, Muhurat trading and RBI policy days, plus the expiry calendar.
Sensex F&O basics: weekly expiry on BSE
Sensex futures and options trade on BSE, not NSE. This matters because most Indian traders first learn NIFTY and Bank Nifty, which follow NSE’s calendar.
| Item | Sensex (BSE) | Source on ChartMine |
|---|---|---|
| Weekly expiry | Every Thursday. The next one after 13 Nov 2026 is Thu 19 Nov 2026. | Expiry calendar |
| Monthly expiry | The last Thursday of the month; Thu 26 Nov 2026 for November. | Expiry calendar |
| Holiday shifts | If Thursday is a holiday, expiry moves to the day before. In 2026: Wed 14 Jan, Wed 25 Mar and Wed 27 May. | Market holidays 2026 |
| PCR, max pain, option chain | Not covered: ChartMine’s option tools read NSE files only. | Use your broker or BSE’s website |
Does the Sensex move more on expiry day? We checked
Many traders believe expiry days are wilder. Using ChartMine’s data, we compared the 46 Sensex expiry days in 2026 (to 13 Nov) with the other 169 sessions, close to close:
| 2026, to 13 Nov | Expiry days | Other days |
|---|---|---|
| Sessions | 46 | 169 |
| Average size of the daily move (up or down) | 0.72% | 0.75% |
| Median size of the daily move | 0.52% | 0.58% |
| Days that closed higher | 21 (46%) | 84 (50%) |
The honest result: in 2026, Sensex expiry days were not bigger than normal days on a closing basis. The largest expiry-day move was −3.26% on Thursday 19 March 2026, a day when NIFTY also fell 3.26%, so it was a market-wide fall, not an expiry effect. Intraday swings can still be sharp on expiry, and option prices change very fast in the last hours, but the close-to-close numbers do not show a special pattern. The expiry-day moves tool has more on NSE indices.
Weekly options lose value quickly as expiry nears, and most buyers of far out-of-the-money options lose their premium. Check the lot size and the money at risk in your broker’s contract note before trading, use a stop loss, and size the trade with the position size calculator.
Step-by-step: reading the Sensex page in five minutes
- Check the date. Read the label under the title. After a holiday, the close may be older than you think (BSE and NSE were shut on Tue 10 Nov 2026 for Diwali Balipratipada).
- Read the close in per cent, not points. On 13 Nov 2026 the Sensex fell 318.56 points, which is only −0.39%. In the 250 sessions to 13 Nov 2026, 24.0% of days moved more than 1% either way, so a 1% day is notable but not rare.
- Place today in the year. Look at “From all-time high” and the 52-week range. On 13 Nov 2026 the close was 14.4% above the 52-week low and 5.3% below the high.
- Look at the chart on 1Y and then 10Y. Is the one-year trend up, down or flat? Is it a small wobble inside a long uptrend?
- Compare short and long returns. On 13 Nov 2026: +11.7% in one month, −3.4% in one year. That is a sharp recovery inside a weak year, not a strong year.
- Check the context cards. Were FIIs buying or selling? Did most stocks rise or fall (breadth)? A Sensex up day with weak breadth means the big companies did the lifting.
- If you trade Sensex options, open the expiry calendar. Note the next Thursday expiry and any holiday shift.
- Write one line in a journal. For example: “Sensex 5.3% below its high, +11.7% in a month, FIIs net buyers five sessions running.”
None of these readings is a signal to buy or sell. They are context. Decide your risk before any trade and use a stop loss.
How traders and investors use the page: three playbooks
1. Long-term investor: learn what “normal” looks like
Use the year-by-year table. From 2006 to 2025 the Sensex ended 17 of 20 full years higher. The bad years were very bad: −52.4% in 2008, −24.6% in 2011, −5.0% in 2015. Over the 10 years to 13 Nov 2026 it compounded at about 11.8% a year; over 5 years, 6.1% a year. Investors use this spread of outcomes to decide how much equity they can hold calmly, and many invest in instalments (SIP) rather than trying to pick the perfect day.
2. News reader: translate headlines into context
When a headline says “Sensex jumps 2,000 points”, open the page, convert to per cent and place it in the 52-week range. On 5 Nov 2026 the Sensex rose 2,008.61 points (+2.60%) to 79,310.01. That was a big day, but the index was still below its 1 Dec 2025 high. Context stops you from chasing a move just because the headline sounds huge.
3. Sensex options trader: plan around Thursday
Weekly Sensex options expire on Thursday, two days after NIFTY’s Tuesday expiry. Traders who trade both note the two days separately in their plan. Because the Sensex and NIFTY move together on almost every day (96.4% of sessions in the last year), holding positions in both is often not diversification: it can double the same bet. Check how much one lot can lose on a 1-2% move before you trade, and keep that within the amount you decided to risk.
Case studies from real data
All numbers come from ChartMine’s Sensex data (BSE end-of-day closes since 2005). They describe what happened, not what will happen.
Case 1: 2026, a stalled year with two deep dips
The Sensex ended 2025 at 85,220.60. Month-end closes in 2026 tell the story:
| Month-end | Sensex close |
|---|---|
| January 2026 | 82,269.78 |
| February | 81,287.19 |
| March | 71,947.55 |
| June | 76,478.67 |
| September | 72,480.29 |
| October | 74,459.53 |
| 13 November | 81,592.45 |
March alone took away 11.5%. After a mid-year recovery the index slid again and made its lowest close of the year, 71,593.24, on 8 October 2026. Then, from 30 October to 13 November, it rose 9.6% in ten sessions (counting the Diwali Muhurat session on Sunday 8 November), with the biggest days on 5 November (+2.60%) and 6 November (+2.17%). FIIs bought a net ₹47,093 crore in the cash market in the last five sessions to 13 Nov. Lesson: a one-year return of −3.4% hides two separate 10%+ swings.
Case 2: milestones take uneven time
From ChartMine’s daily closes, the first close above each round level:
| Level | First close above | Time from the previous 10,000 |
|---|---|---|
| 20,000 | 11 Dec 2007 | under 2 years (10,000 on 7 Feb 2006) |
| 30,000 | 26 Apr 2017 | over 9 years |
| 40,000 | 3 Jun 2019 | about 2 years |
| 50,000 | 3 Feb 2021 | under 2 years |
| 60,000 | 24 Sep 2021 | under 8 months |
| 70,000 | 14 Dec 2023 | over 2 years |
| 80,000 | 4 Jul 2024 | under 7 months |
The jump from 20,000 to 30,000 took over nine years, because the 2008 crash came in between. Lesson: round numbers make headlines, but the path between them is never smooth.
Case 3: the big falls since 2005
Falls of more than 20% from a record close, on daily closes:
| Record close | Bottom | Fall | New record close |
|---|---|---|---|
| 10 May 2006 | 14 Jun 2006 | −29.2% | 13 Oct 2006 |
| 8 Jan 2008 | 9 Mar 2009 | −60.9% | 4 Nov 2010 |
| 5 Nov 2010 | 20 Dec 2011 | −27.8% | 30 Oct 2013 |
| 29 Jan 2015 | 11 Feb 2016 | −22.7% | 3 Apr 2017 |
| 14 Jan 2020 | 23 Mar 2020 | −38.1% | 9 Nov 2020 |
The single worst day in the data was 23 March 2020 (−13.15%); the best was 18 May 2009 (+17.34%), the first session after the 2009 general election results. On 4 June 2024, the 2024 results day, the Sensex fell 5.74%. Lesson: 30-60% falls are part of owning even the largest companies, and recovery can take months or years. Leveraged positions cannot wait that long.
Common mistakes
- Judging a day in points. 1,000 points at 81,000 is about 1.2%. Always look at the per cent.
- Mixing up the all-time high and the record close. For the Sensex they are more than a year apart (1 Dec 2025 vs 26 Sep 2024).
- Treating the page as live. It shows the last finished session.
- Looking for PCR or max pain for the Sensex on ChartMine. Those tools use NSE data; Sensex options are on BSE.
- Using the Sensex for a small-cap portfolio. It holds 30 giants. Your portfolio can do very differently; check breadth.
- Thinking Sensex + NIFTY positions spread risk. They moved the same way on 96.4% of days in the last year.
- Expecting expiry days to be wild. In 2026 they were not bigger than other days on a closing basis.
- Ignoring dividends in long comparisons. The page shows price returns; funds include dividends and costs.
Checklist before you use Sensex data in a decision
- I checked the session date under the title.
- I converted the day’s move from points to per cent.
- I know whether I am looking at the close, the intraday high or the record close.
- I placed the close inside the 52-week range and against the all-time high.
- I looked at the chart on at least two ranges (1Y and 10Y).
- I compared the 1-month return with the 1-year and 5-year returns.
- I checked breadth and FII/DII flows for context.
- If I trade Sensex options, I know the Thursday expiry date and how much one lot can lose.
- I decided my stop loss and position size before the trade.
Glossary
| Term | Meaning |
|---|---|
| Sensex | BSE’s benchmark index of 30 large companies; base 100 in 1978-79. |
| BSE | Bombay Stock Exchange, Mumbai; runs the Sensex and lists Sensex F&O. |
| NIFTY 50 | NSE’s benchmark index of 50 large companies. |
| Constituent | A company included in the index. |
| Close | The official level at the end of the session. |
| OHLC | Open, high, low and close of a period. |
| All-time high | Highest level ever traded during a session. |
| Record close | Highest closing level ever. |
| 52-week range | Highest and lowest level of the last year. |
| Drawdown | The % fall from a previous peak. |
| CAGR | Compounded annual growth rate. |
| Price return | Return from the index level only, without dividends. |
| Correlation | How closely two series move together; 1 means in perfect step. |
| Expiry | The day a futures or options contract ends; Sensex weekly options expire on Thursday. |
| FII / DII | Foreign / domestic institutional investors. |
| Breadth | How many stocks rose versus fell. |
Questions
How do I read the Sensex chart on ChartMine?
The 1M, 3M, 6M and 1Y buttons show daily candlesticks (green when the close is above the open). 5Y, 10Y and All show a line of weekly closes since January 2005. Hover over the chart to see the open, high, low and close of any day.
What is the difference between the Sensex all-time high and record close?
The all-time high is the highest level traded during a session: 86,159.02 on 1 December 2025. The record close is the highest closing level: 85,836.12 on 26 September 2024. The Sensex touched a new high in 2025 but did not close above its 2024 record.
What is the difference between Sensex and Nifty?
The Sensex tracks 30 large companies on BSE; NIFTY 50 tracks 50 large companies on NSE. They move together: in the 250 sessions to 13 November 2026 they closed in the same direction on 96.4% of days. Over 10 years both rose about 204%.
On which day do Sensex options expire?
Sensex weekly options expire on Thursday on BSE, and the last Thursday of the month is the monthly expiry. If Thursday is a holiday, expiry moves to the previous trading day. ChartMine’s expiry calendar lists every 2026 date.
How much has the Sensex returned in 10 years?
From 26,818.80 on 11 November 2016 to 81,592.45 on 13 November 2026, the Sensex rose 204.2%, about 11.8% a year compounded, in price terms without dividends. Past returns do not tell you future returns.
Can I download Sensex historical data for free?
Yes. The Download button under the historical data table gives a CSV with the daily open and close of every session since 3 January 2005, updated after each trading day.
Why is there no Sensex option chain or PCR on ChartMine?
ChartMine’s option chain, PCR and max pain tools use NSE’s F&O files. Sensex options trade on BSE, so they are not covered. The Sensex page shows the index history, FII/DII flows and breadth instead.
Is the Sensex page a buy or sell signal?
No. It is an education and research page showing end-of-day history. Use it for context, plan your risk with a stop loss, and remember ChartMine is not a SEBI-registered adviser.