
☰ All tutorials
Start here
Tool tutorialsHow to trade with ChartMineStocks
Stock monitorMy watchlistStock scores & checklistMarket & sectors
Nifty 50Bank NiftySensexFin NiftyDaily market reportMarket breadthSector rotationSector heatmapStock screenerRelative strength (RS)MCX commodity pricesFear & Greed IndexWhat happens after…Scanners
Top gainers & losersStocks to watch tomorrowNR7 stocks scannerInside bar stocks52-week high stocksGap up & gap down stocksRSI oversold stocksGolden cross stocksSuperTrend buy stocksScan builderEMA 9/21 crossoverMACD crossoverADX strong trendBollinger breakout / squeezeVolume spike stocksOpen = high / open = lowCandlestick pattern scannerNarrow CPR scannerF&O data
F&O ban listOI build-upOption chainPCR & max painExpiry calendarF&O lot sizesOI build-up heatmapPCR trendMax pain trendFutures basisStock screens
Quarterly growersProfit growth stocksLow P/E stocksMutual fund buyingNear 52-week low, growingDebt-free companiesHigh ROE & ROCEMagic Formula stocksLow price-to-bookSmart money
FII / DII dataShareholding changesBig-money footprintShort selling dataF&O positions by participantBulk & block dealsPromoter buyingDelivery percentageCalendars
Results calendarQuarterly results trackerBoard meetingsCorporate actionsIPO calendarIPO performanceResearch & planning
Strategy testerCompare stocksDividend yield stocksASM / GSM listExpiry-day movesSeasonality & stock historyNSE holidays 2026Position size calculatorOption payoff calculatorPivot point calculatorMore
Stock scanners hubStock screensHow to use the Relative strength ranking
A complete, plain-language guide to relative strength for Indian traders: the RS rating and RS line, how ChartMine calculates them, how to read every column, what our test of 54,000 stock-days says about momentum, three playbooks and four real case studies.
What relative strength is, in plain words
“Has this stock done well?” sounds simple, but the answer depends on what you compare it with. A stock up 10% in a year looks good, until you learn that the average stock is up 30%. Relative strength (RS) means comparing a stock’s performance with other stocks or with the market, instead of looking at it alone.
The Relative strength ranking page does this for every actively traded NSE stock every evening and gives you three ways to see it:
- RS rating (1 to 99): a rank of the stock’s 12-month price performance against all the other stocks. RS 90 means it did better than 90% of them.
- RS line: the stock’s price divided by NIFTY 50, drawn as a line. When it rises, the stock is beating the index.
- Change in 20 sessions: how much the RS rating moved in about a month. A big jump means the stock is climbing the ranks fast.
Behind the idea is a well-documented market habit called momentum: stocks that have been strong over the past 6–12 months have, on average, tended to stay a bit stronger than others for a while. “On average” and “for a while” are doing a lot of work in that sentence, as our own test below shows.
One line to remember: RS tells you which stocks have been strong. It is a starting list for research, not a list of stocks to buy.
RS rating, RS line and momentum, explained
How the RS rating is calculated
Take the last 12 months of closing prices (about 252 sessions), split into four quarters of 63 sessions. The score is:
| Part | Weight |
|---|---|
| Return over the latest quarter (last 63 sessions) | × 2 |
| Return over the quarter before that | × 1 |
| Return over the third quarter back | × 1 |
| Return over the oldest quarter | × 1 |
(Returns are measured in logarithms, which simply makes gains and losses add up fairly.) Then every stock is ranked against the others and given a percentile from 1 to 99. Counting the latest quarter twice means recent strength matters more than strength from a year ago. On 6 Nov 2026, 1,313 of the 1,421 tracked stocks had enough history for a rating.
What the numbers roughly mean
| RS rating | Plain meaning |
|---|---|
| 90–99 | Top 10% of the market over the past year. Market leaders. |
| 70–89 | Clearly stronger than most stocks. |
| 30–69 | Middle of the pack. |
| 1–29 | Bottom 30%. Weak over the past year. |
The RS line is different from the RS rating
The RS line is price ÷ NIFTY 50. It answers “is this stock beating the index right now?” The page flags “New high” when today’s RS line is above every value of the past year. This can happen even when the stock’s own price is not at a high (if NIFTY fell more), and even when its RS rating is only moderate. On 6 Nov 2026 ICICI Bank had its RS line at a new high but an RS rating of 77: it had just started to beat NIFTY strongly (+12.4% in a week, +16.7% in a year against NIFTY’s −2.85%), while many smaller stocks had bigger 12-month gains.
RS is about the past year, not today’s chart
A high RS rating can sit on a stock that has already fallen a long way from its peak. On 6 Nov 2026 Mtar Technologies had an RS rating of 99, yet it was 37.5% below its 52-week high and fell 5.0% that day. Its 12-month gain (+246%) was still huge, so its rank stayed at the top. Always look at the price chart and the distance from the 52-week high as well.
Why traders use RS: advantages and limits
✅ Finds the leaders fast
Ranks 1,313 stocks in one list. The strongest names are on the first screen.
✅ Removes the market from the picture
A stock up 5% while the market is down 5% is far stronger than one up 5% in a rising market. RS shows this.
✅ Spots stocks turning up
The 20-session change and RS-line new highs highlight stocks that are climbing the ranks now.
✅ Works with sectors
The “Leaders in each sector” cards show the strongest names in every group, so you can combine RS with sector rotation.
The limits (please read this part)
We rebuilt the RS rating every fifth trading day from 24 Oct 2025 to 8 Oct 2026 (about 54,000 stock-days) and checked each stock’s return over the next 20 and 60 sessions.
| RS rating | Next 20 sessions: average | median | higher | Next 60 sessions: average | median | higher |
|---|---|---|---|---|---|---|
| 90+ | +1.58% | +0.27% | 51% | +6.27% | +2.58% | 55% |
| 70–89 | +0.69% | −0.68% | 47% | +3.42% | +0.38% | 51% |
| 30–69 | −0.05% | −1.46% | 43% | +1.66% | −1.31% | 47% |
| 1–29 | −0.46% | −2.32% | 40% | +0.31% | −2.97% | 43% |
| All stocks | +0.15% | −1.41% | 44% | +2.09% | −1.13% | 47% |
What this means in plain words:
- Momentum showed up in our data. The higher the RS bucket, the better the following returns, at every step. Over 60 sessions RS 90+ stocks averaged +6.3% against +2.1% for all stocks.
- But it is a tilt, not a sure thing. Even RS 90+ stocks were higher only 55% of the time after 60 sessions. Almost half went down.
- The average is flattered by big winners. The median RS 90+ stock gained only 2.6% in 60 sessions; a few large gains pull the average up.
- Survivorship bias. The test uses stocks that are actively traded today. Stocks that collapsed and dropped out of the list are missing, which makes past results look better than they were.
- One year of data, before costs, in a market where the average stock fell. Other periods can look very different.
So how should you use it? As a filter that tilts your research towards strong stocks, combined with the chart, the sector, the news and a strict stop loss. Strong stocks also fall hard when trends turn (see case 2).
A tour of the Relative strength page
Open Relative strength ranking. The page has four headline boxes, the RS ranking table with filter buttons, and the sector leader cards.

- 1Stocks rated RS 90 or more
- 2Stocks with the RS line at a new 52-week high
- 3Rising fast: RS up 15+ points in 20 sessions
- 4Sector with the highest average RS
On 6 Nov 2026: 138 stocks rated 90 or more (of 1,313), 3 with the RS line at a new high (Lumax Auto Technologies, Alembic Pharmaceuticals, ICICI Bank), 160 rising fast (RS up 15+ points in 20 sessions), and Media as the sector with the highest average RS.
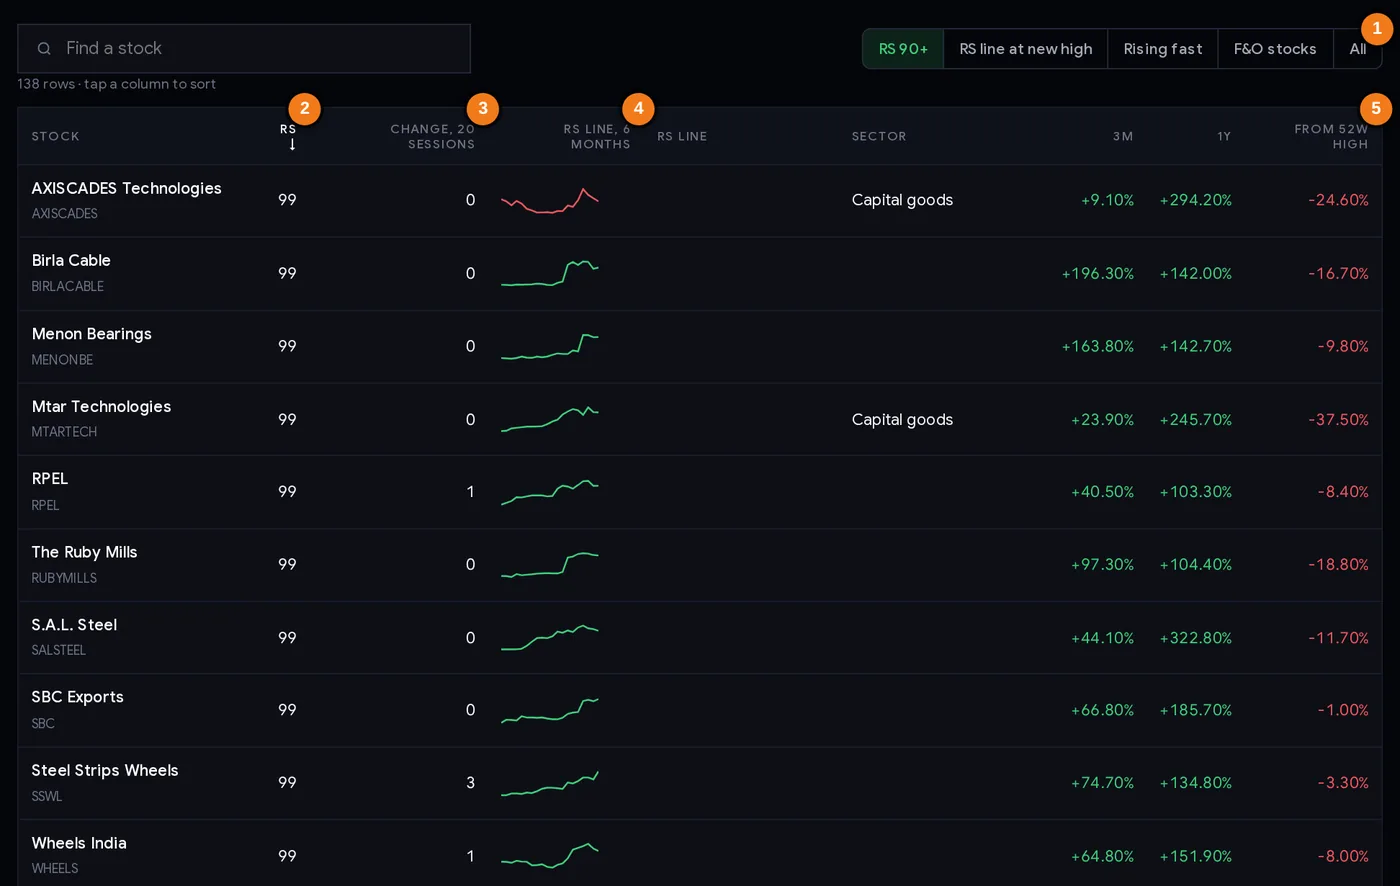
- 1Filter buttons: RS 90+, RS line at new high, rising fast, F&O, all
- 2RS rating
- 3Change in the RS rating over 20 sessions
- 4RS line over six months (price ÷ NIFTY 50)
- 5Distance from the 52-week high
Filter buttons
- RS 90+ (default): only the top-rated stocks.
- RS line at new high: stocks beating NIFTY more than at any time in the past year.
- Rising fast: RS rating up 15 points or more in 20 sessions.
- F&O stocks: only stocks with futures and options.
- All: every rated stock. Click any column header to sort.
Every column explained
| Column | What it tells you |
|---|---|
| Stock | Click to open the stock’s page. |
| RS | The RS rating, 1 to 99. |
| Change, 20 sessions | RS rating now minus its rating 20 sessions ago. +20 means it climbed 20 places in percentile terms. |
| RS line, 6 months | A small chart of price ÷ NIFTY 50 over six months. Rising = beating the index. |
| RS line | Shows “New high” when the RS line is at a 52-week high. |
| Sector | NSE industry group. Blank when the stock is not in NSE’s NIFTY Total Market classification. |
| 3M, 1Y | Price change over 3 months and 1 year. |
| From 52W high | How far below its 52-week high the stock is. −2% is near the high; −35% is far from it. |
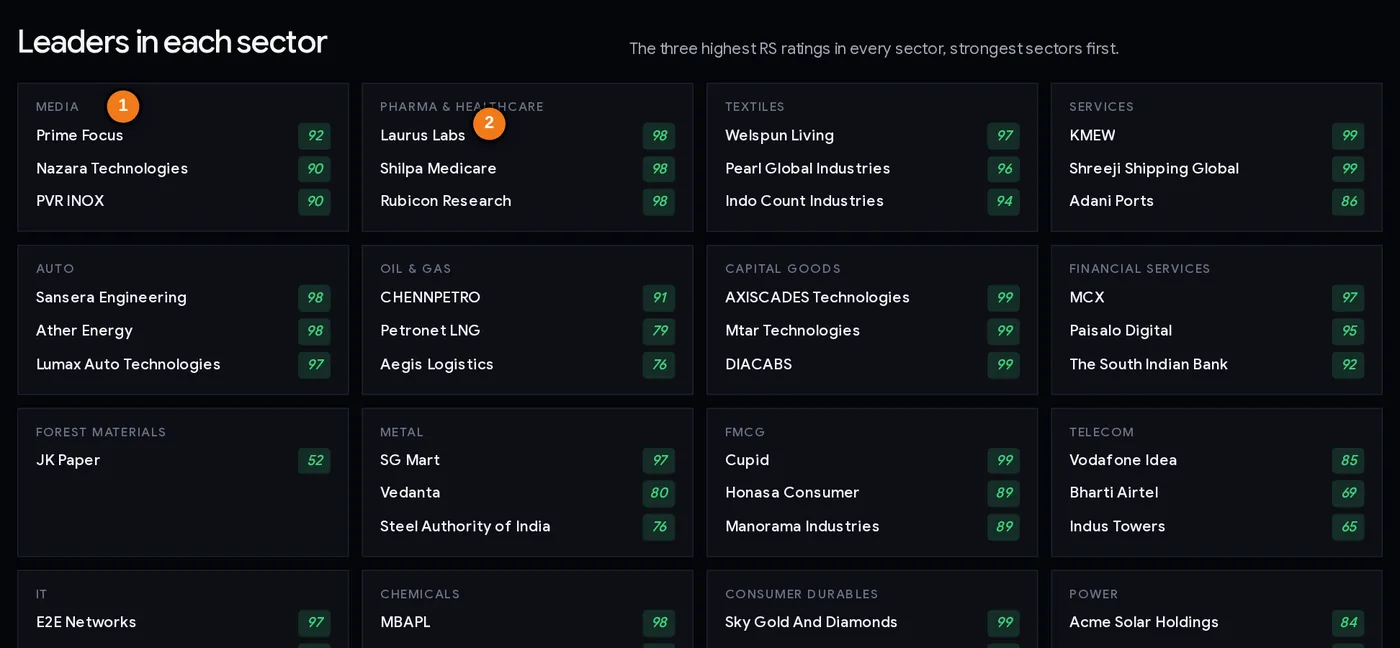
- 1Sector (strongest sectors first)
- 2A stock and its RS rating (here Laurus Labs, 98)
The Leaders in each sector cards show the three highest RS ratings in every sector, strongest sectors first. On 6 Nov 2026, Laurus Labs, Shilpa Medicare and Rubicon Research (all RS 98) led Pharma & healthcare.
Step by step: building a weekly RS shortlist
- Open the page after the evening update (the site refreshes at about 8 PM and again around 10:15 PM IST). The date is in the introduction.
- Start with “RS 90+”. Sort by From 52W high so the stocks closest to their highs come first. Leaders near their highs are in healthy uptrends; leaders 30% below their highs may be fading.
- Check the RS line sparkline. Prefer stocks whose line is still rising over the last few months, not one that peaked long ago.
- Switch to “Rising fast” to see stocks climbing the ranks. These are earlier in their move but less proven.
- Check the sector. A leader in a leading sector has more support. Cross-check with sector rotation.
- Open each stock page. Look at the chart, results, delivery and upcoming events. Remove stocks with results in the next few days unless you trade results.
- Shortlist 5–10 names and add them to your watchlist. Write down a possible entry and the price where the idea is wrong.
- Repeat weekly. Note which names drop out of RS 90+; that is information too.
Three ways traders and investors use RS
Playbook A: leaders near highs (swing trading)
From the RS 90+ list, take stocks within about 10% of their 52-week high whose RS line is rising. Wait for a calm pullback or a tight sideways period on the daily chart, then plan an entry when price breaks out of that range. Put the stop loss below the range low. Exit if the stock closes back inside the range or the RS line breaks down. The RS list only supplies the candidates; the chart supplies the timing and the risk.
Playbook B: RS line first (spotting new leaders)
Watch the “RS line at new high” filter. A stock whose RS line reaches a new high before its price does is quietly beating the market, often during a market pullback. Some traders put these on a watchlist and wait for the price itself to break out. ICICI Bank on 6 Nov 2026 is an example of an RS-line new high in a large, liquid stock.
Playbook C: portfolio check-up (investors)
Once a month, look up the RS rating of every stock you own. A long-term holding drifting from 80 to 30 is not automatically a sell, but it is a prompt to re-check the reason you own it: have results, guidance or the sector changed? RS does not know about valuation or dividends, so investors combine it with fundamentals.
Strong stocks are often volatile. Size positions by your stop distance, not by conviction. Use the position size calculator.
Case studies from real data
All ratings below were rebuilt with the page’s own formula from NSE closing prices (adjusted for splits and bonuses).
1. The RS 90+ list of 7 Aug 2026, three months later
On 7 Aug 2026, 121 stocks had RS 90 or more. By 6 Nov 2026 (three months later) the market had been rough for the average stock: across all rated stocks the average return was −5.55% (median −7.0%), and only 29% were higher, even though NIFTY 50 rose from 24,571 to 25,030. The RS 90+ group did much better than that, but it still did not make money on average: −0.37% average, −3.3% median, 39% higher. Lesson: high RS helped you lose less in a weak market; it did not stop most stocks from falling.
2. Winners and losers inside the same list
From that same 7 Aug list (the most traded RS 95+ names), the next three months were wildly different:
| Stock | RS on 7 Aug | Close 7 Aug (₹) | Close 6 Nov (₹) | Change | RS on 6 Nov |
|---|---|---|---|---|---|
| Cupid | 99 | 262.13 | 338.90 | +29.3% | 99 |
| Laurus Labs | 99 | 1,844.30 | 2,340.00 | +26.9% | 98 |
| Ather Energy | 99 | 1,481.50 | 1,821.70 | +23.0% | 98 |
| Aegis Logistics | 99 | 1,371.00 | 1,141.10 | −16.8% | 76 |
| Netweb Technologies | 97 | 4,939.20 | 3,771.40 | −23.6% | 37 |
| R R Kabel | 98 | 2,759.50 | 1,920.90 | −30.4% | 58 |
Lesson: the same rating led to +29% and −30%. A stop loss below a sensible chart level would have limited the losers; and the RS ratings of the losers had dropped a long way by 6 Nov (R R Kabel from 98 to 58, Netweb from 97 to 37). Watching for a falling rating is part of using the tool.
3. Mtar Technologies, 6 Nov 2026: RS 99 and 37% below its high
Mtar had an RS rating of 99 on 6 Nov 2026 thanks to a 12-month gain of about +246%, yet it was 37.5% below its 52-week high and appeared in that day’s gap-down list (−5.0% on the day). Lesson: the rating looks back a full year. Sort by “From 52W high” to separate leaders still near their highs from former leaders in a deep pullback.
4. ICICI Bank, 6 Nov 2026: RS line new high with RS 77
ICICI Bank closed at ₹1,571.20, at its 52-week high, up 4.75% on the day, with its RS line at a new high. Its RS rating was only 77, because many smaller stocks had bigger 12-month gains. Lesson: the RS line and the RS rating answer different questions: “is it beating NIFTY now?” versus “how does its year rank against everyone?” Large, steady stocks rarely reach 99 but can still lead the index. What happens next was not known when this guide was written.
Common mistakes
- Buying everything rated 90+. Case 1: on average the list still fell over three months in a weak market.
- Ignoring the distance from the 52-week high. Case 3: RS 99 and 37% below the high.
- No stop loss on “strong” stocks. Case 2: −30% from an RS 98 starting point.
- Confusing RS line and RS rating. Case 4: new RS-line high with a rating of 77.
- Treating RS as valuation. RS measures price performance only; it says nothing about whether a stock is cheap or expensive.
- Checking once and forgetting. Ratings change every day; a falling rating is an early warning.
- Forgetting liquidity. Some high-RS names trade only a few crore a day. Check turnover on the stock page before sizing.
RS checklist
- Data date is the latest trading day.
- RS rating 80+ (or rising fast), and RS line rising on the sparkline.
- Within about 10–15% of the 52-week high (unless you deliberately trade pullbacks).
- Sector neutral or strong on the rotation chart.
- No results or big event in the next few sessions (or you have a plan for it).
- Enough daily turnover for your position size.
- Entry, stop loss and position size written down.
- Exit rule decided, including what you do if the RS rating drops sharply.
Glossary
| Relative strength (RS) | Performance compared with other stocks or the index. |
| RS rating | A 1–99 percentile rank of 12-month performance, latest quarter counted twice. |
| RS line | Stock price ÷ NIFTY 50. Rising = beating the index. |
| RS-line new high | The RS line above every value of the past year. |
| Momentum | The tendency of recent winners to keep doing a little better for a while, on average. |
| Percentile | The share of the group a value beats. 90th percentile = better than 90%. |
| Median | The middle value; half the cases are above, half below. |
| Survivorship bias | Studying only stocks that still exist, which makes the past look better. |
| 52-week high | The highest price of the past year. |
Questions
What is RS rating in stocks?
A 1 to 99 score that ranks a stock’s price performance over the last 12 months against other actively traded NSE stocks, with the latest quarter counted twice. RS 90 means the stock did better than 90% of them.
What is the difference between the RS line and RS rating?
The RS line is the stock’s price divided by NIFTY 50 and shows whether it is beating the index now. The RS rating ranks the stock’s 12-month performance against all other stocks. A stock can have its RS line at a new high with a modest rating, like ICICI Bank (RS 77) on 6 Nov 2026.
Which NSE stocks have the highest relative strength?
The Relative strength page lists them every evening. On 6 Nov 2026, 138 of 1,313 rated stocks had an RS rating of 90 or more.
Do high RS stocks keep going up?
On average they did a little better in our test: from Oct 2025 to Oct 2026, RS 90+ stocks gained an average of 6.3% over the next 60 sessions against 2.1% for all stocks, but only 55% of them were higher. Many strong stocks still fell.
Is a high RS rating a buy signal?
No. It describes how strong a stock has been. Strong stocks often stay strong for a while, but they also fall hard when trends turn. Use it as a research filter with a stop loss.
How is the RS rating calculated?
Twice the log return of the latest 63 sessions plus the log returns of the three earlier 63-session quarters, then ranked as a percentile from 1 to 99 against all rated stocks.
When is the relative strength ranking updated?
Every trading day in the evening, after NSE’s end-of-day files are processed.