
☰ All tutorials
Start here
Tool tutorialsHow to trade with ChartMineStocks
Stock monitorMy watchlistStock scores & checklistMarket & sectors
Nifty 50Bank NiftySensexFin NiftyDaily market reportMarket breadthSector rotationSector heatmapStock screenerRelative strength (RS)MCX commodity pricesFear & Greed IndexWhat happens after…Scanners
Top gainers & losersStocks to watch tomorrowNR7 stocks scannerInside bar stocks52-week high stocksGap up & gap down stocksRSI oversold stocksGolden cross stocksSuperTrend buy stocksScan builderEMA 9/21 crossoverMACD crossoverADX strong trendBollinger breakout / squeezeVolume spike stocksOpen = high / open = lowCandlestick pattern scannerNarrow CPR scannerF&O data
F&O ban listOI build-upOption chainPCR & max painExpiry calendarF&O lot sizesOI build-up heatmapPCR trendMax pain trendFutures basisStock screens
Quarterly growersProfit growth stocksLow P/E stocksMutual fund buyingNear 52-week low, growingDebt-free companiesHigh ROE & ROCEMagic Formula stocksLow price-to-bookSmart money
FII / DII dataShareholding changesBig-money footprintShort selling dataF&O positions by participantBulk & block dealsPromoter buyingDelivery percentageCalendars
Results calendarQuarterly results trackerBoard meetingsCorporate actionsIPO calendarIPO performanceResearch & planning
Strategy testerCompare stocksDividend yield stocksASM / GSM listExpiry-day movesSeasonality & stock historyNSE holidays 2026Position size calculatorOption payoff calculatorPivot point calculatorMore
Stock scanners hubStock screensHow to use Seasonality & stock history
A plain-language guide to market seasonality: what the monthly heatmaps, weekday bars and event studies measure, how to read every part of the pages, our own test of whether past monthly patterns repeat, and case studies on November, Budget day, Reliance and Muhurat trading.
What seasonality is, in plain words
“November is a good month for the market.” “Budget day is usually negative.” “Markets rise around Diwali.” You will hear claims like these every year. Seasonality is the study of whether prices behave differently at certain times: particular months, weekdays, the turn of the month, or around regular events such as the Union Budget, RBI policy days and Muhurat trading.
ChartMine’s Seasonality & stock history section answers these questions with data instead of folklore. It covers:
- Indices: NIFTY 50 (since 2000), BANK NIFTY and SENSEX (since 2005) and FINNIFTY (since 2012), each with a monthly returns heatmap, weekday statistics, yearly highs and lows, and long-term returns.
- Event studies for NIFTY 50: Union Budget day, RBI policy day, Diwali Muhurat trading, Lok Sabha election results and monthly F&O expiry, with every event listed year by year.
- Every F&O stock (215 on 9 Nov 2026): share price history, monthly returns and yearly highs and lows.
The most important sentence in this tutorial: a seasonal average describes the past. It is not a forecast. In our own test below, the ranking of NIFTY 50’s months from 2000–2012 told you essentially nothing about the ranking in 2013–2025.
Used properly, seasonality is still useful: it shows how big moves around an event usually are, which months have historically been volatile, and how a stock has behaved over decades. It just should not be used as a reason by itself to buy or sell.
The patterns the pages measure
| Pattern | What is measured | Where you see it |
|---|---|---|
| Monthly seasonality | The % change from the last close of one month to the last close of the next, for every year. Averaged per calendar month, with the share of years it was up. | The heatmap and its Average and Up years rows. |
| Day of the week | The average daily change on Mondays, Tuesdays and so on, the share of up days, and the last five years on their own. | The weekday bars. |
| Turn of the month | The average daily change on the days around the month change, against all other days. | The “Turn of the month” box. |
| Event study | How the index moved on the day of a recurring event, its opening gap, the 10 days before, and 5 and 10 days after. | The event pages (Budget, RBI, Muhurat, elections, expiry). |
| Long-term returns | Total return and CAGR over 1, 3, 5, 10, 15 and 20 years, plus each year’s close, high and low. | The returns and year-by-year tables. |
Three numbers to read together
- Average: the mean change. One huge year can drag it a long way (for example NIFTY’s −26.4% in October 2008).
- Up years (or “closed higher”): how often it was positive. 50% is a coin toss; 60% is only a mild tilt.
- Number of years or events: 26 Novembers or 32 Budgets is not much. 5 election results is almost nothing.
Why small samples mislead
NIFTY 50’s November returns from 2000 to 2025 ranged from −9.3% (2011) to +11.9% (2005), with a typical spread (standard deviation) of about 5.7 points. With only 26 years, an average like +2.72% could easily be a point or more higher or lower just through luck. And with 12 months to choose from, one month will always come out “best” even if there were no real pattern at all.
Why look at seasonality: advantages and limits
✅ Facts instead of folklore
“Budget day always falls” is easy to check: NIFTY 50 closed higher on 41% of 32 Budget days. Mostly lower, but far from always.
✅ Expect the size of a move
Event pages show the typical size of the move (±1.79% on Budget day for NIFTY 50), which helps with stop distances and position size.
✅ Decades of context
A stock’s history page shows its worst years, best years and long-term CAGR: useful perspective when today’s move feels extreme.
✅ Same method for every stock
All 215 F&O stocks and four indices use the same calculations, so comparisons are fair.
The limits (this matters more than the advantages)
- Past patterns are not forecasts. Markets change: new participants, new rules, different economic conditions. A pattern from the 2000s may not exist now.
- Small samples. One observation per year means a 26-year history is only 26 data points per month.
- Data mining. With 12 months, 5 weekdays, many events and 215 stocks, some striking “patterns” will appear by pure chance.
- Known patterns fade. If everyone expects a December rally, buyers act earlier and the effect shifts or disappears.
- Prices only. The index and stock figures are price changes; dividends are not included.
- Averages hide the spread. An average of +2% can be made of years at +12% and years at −9%.
Our test: does a month’s past tell you its future?
We split NIFTY 50’s monthly returns into two halves: 2000–2012 and 2013–2025 (complete months only), and compared each month’s average and up-rate in the two periods.
| Month | 2000–2012 average | Up years | 2013–2025 average | Up years |
|---|---|---|---|---|
| Feb | +0.68% | 62% | −1.56% | 38% |
| Apr | +0.80% | 46% | +2.45% | 69% |
| Sep | +2.25% | 62% | +0.15% | 54% |
| Oct | −0.39% | 46% | +1.91% | 77% |
| Nov | +3.99% | 69% | +1.44% | 54% |
| Dec | +3.89% | 77% | +1.08% | 54% |
What it shows:
- The two strongest months of the first half (November and December) were ordinary in the second half. November rose in 7 of the 13 years from 2013 to 2025.
- Months flipped. October went from slightly negative to one of the best; February went from positive to the weakest.
- Overall, the ranking did not carry over. We measured how similar the order of the 12 months was in the two periods (a rank correlation). The answer was 0.01, where 1 would mean the same order and 0 means no relationship.
So how should you use monthly seasonality? As background, not as a signal. If a month has historically been volatile, be ready for movement. If it has been “good”, do not treat that as a reason to buy. Trade decisions need current price action, news and, above all, risk management.
A tour of the pages
Start at /seasonality/. It is a hub: pick an index, an event, or search for a stock.
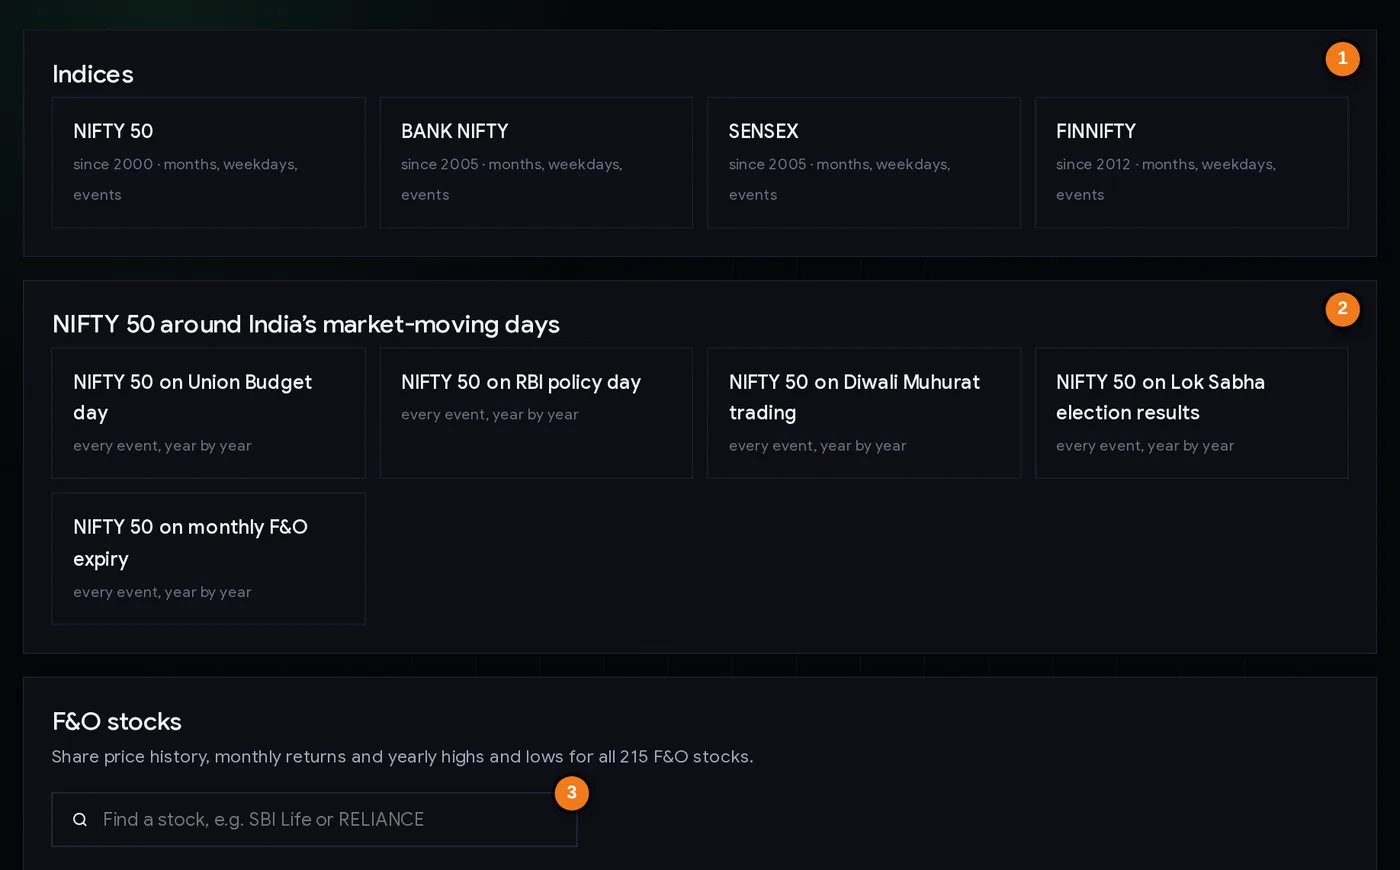
- 1Index pages: NIFTY 50, BANK NIFTY, SENSEX, FINNIFTY
- 2Event studies: Budget, RBI policy, Muhurat, election results, monthly expiry
- 3Find any of the 215 F&O stocks
Click NIFTY 50 to open its page. The top shows four summary boxes and links to the event studies.
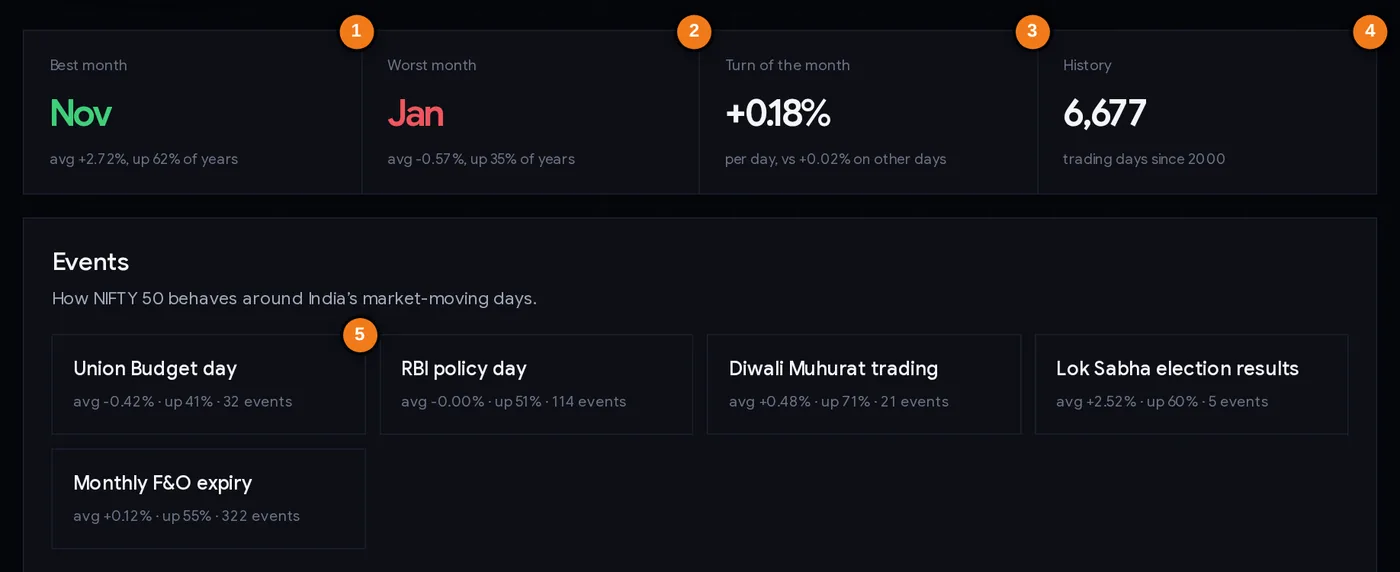
- 1Best month: average change and share of up years
- 2Worst month
- 3Turn of the month against other days
- 4How much data is behind the numbers
- 5Each event: average on the day, share closing higher, number of events
The summary boxes
| Box | What it tells you |
|---|---|
| Best month | The calendar month with the highest average change, and how often it was up. On 9 Nov 2026: November, +2.72%, up in 62% of years. |
| Worst month | The month with the lowest average. January, −0.57%, up in 35% of years. |
| Turn of the month | The average daily change around the month change (+0.18%) against other days (+0.02%). |
| History | How much data is behind the numbers: 6,677 trading days since 2000. |
Below the boxes, each event shows its average change on the day, how often it closed higher, and the number of events. Click one to see every event year by year with the opening gap, the 10 days before, and the 5 and 10 days after.
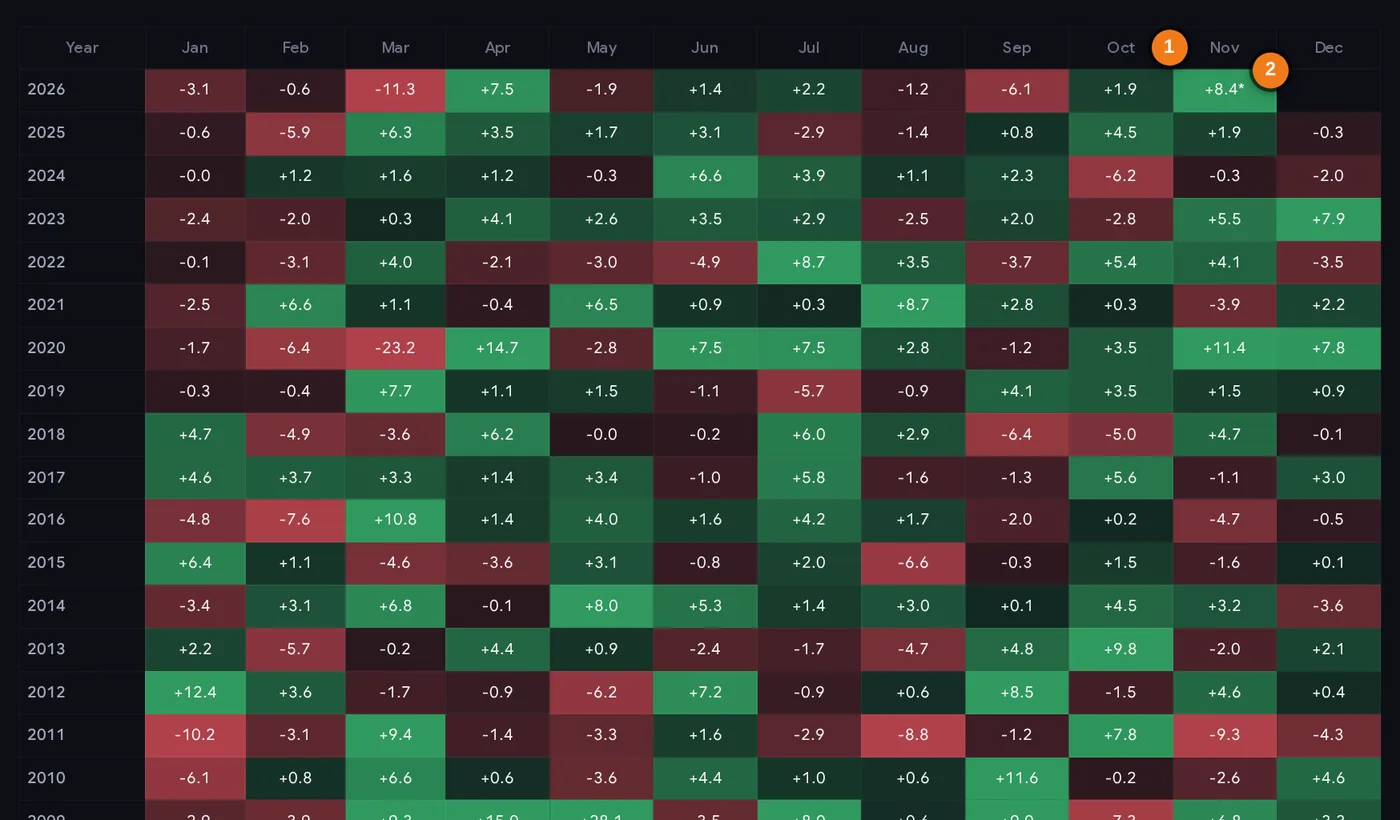
- 1A month’s column (November)
- 2The month in progress, marked * and left out of the averages
Reading the heatmap
- Each row is a year, each column a month. Green cells closed higher, red lower; darker means a bigger move.
- An asterisk (*) marks the month in progress. On 9 Nov 2026, November 2026 showed +8.4% after its first week, including the Muhurat session. A partial month is not included in the averages.
- Scan a column top to bottom before trusting its average: are the green cells spread through the years, or bunched in one decade?
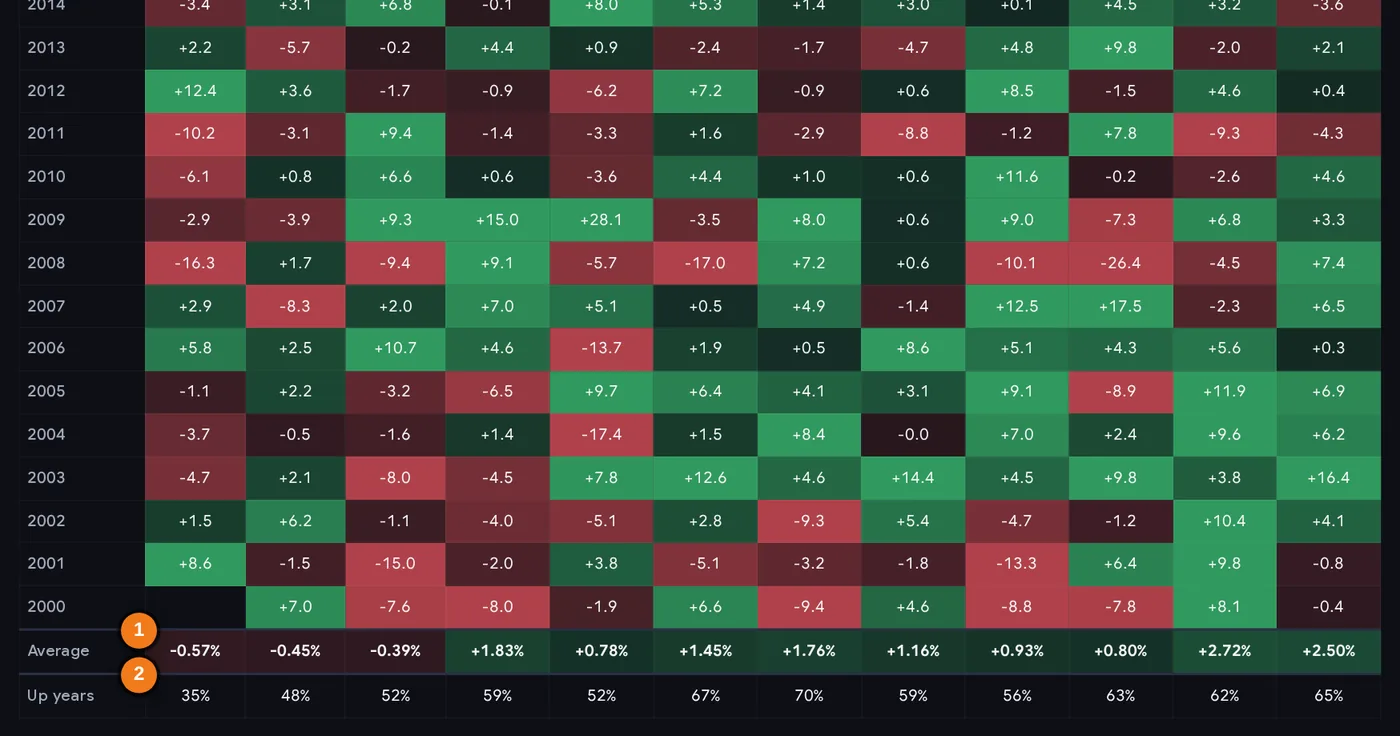
- 1Average change for each month (complete years only)
- 2Share of years each month closed higher
- The Average row at the bottom is the mean for each month; Up years is the share of years that month was positive.
- Compare the two rows: December’s +2.50% average with 65% up years and July’s +1.76% with 70% show that the month with the higher average is not always the one that rose most often.
Further down the page
- Returns over 1 to 20 years with total return and CAGR (the steady yearly rate that gives the same result).
- Year by year: each year’s closing level, return, highest and lowest close with dates.
- Day of the week: average change, share of up days, and the last five years on their own.
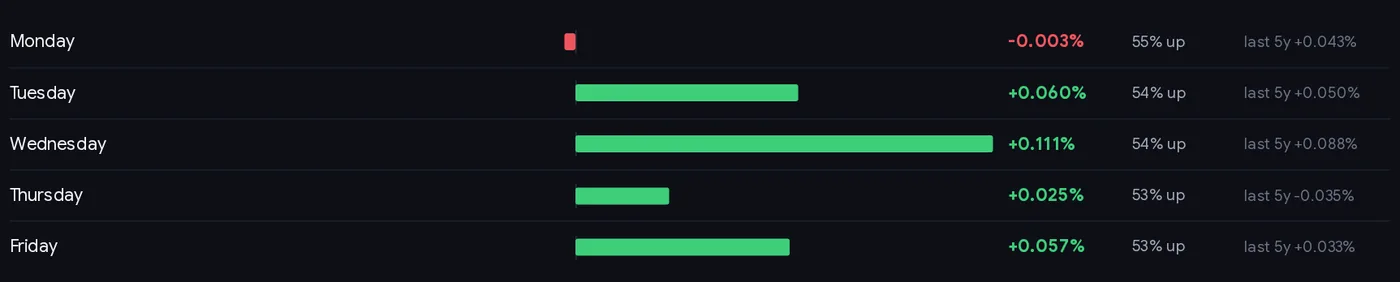
Even the weekday figures are tiny and unstable. Since 2000 Wednesday had the best average (+0.111%) and Monday the weakest (−0.003%), yet every weekday was up on only 53–55% of days, and Thursday’s average turned negative (−0.035%) over the last five years. Differences this small are swamped by costs and ordinary daily noise.
Each F&O stock has a similar page (for example Reliance share price history) with its own heatmap, returns, “if you had invested” table and Budget-day behaviour.
Step by step: using seasonality sensibly (10 minutes)
- Start with a question, for example “How does NIFTY 50 usually behave on Budget day?” or “Has this stock had a regular weak month?”
- Open the page for the index, event or stock.
- Read the average, the up-rate and the number of observations together. An up-rate between 40% and 60% is close to a coin toss.
- Look at the spread: scan the heatmap column or the event table. Is the average driven by one or two extreme years?
- Check recent years separately. Has the pattern held in the last 10 years, or only before?
- Use it for size, not direction. On event days, the typical size of the move is more reliable than the direction. Adjust stop distance and position size for it.
- Combine with current information: the trend, news, results and positioning (for example OI build-up and PCR).
- Write down what you expect and why, then compare it with what actually happened.
Three ways traders and investors use it
Playbook A: preparing for an event day
Before the Budget or an RBI policy day, open the event page. Note the typical size of the move and the range of past outcomes. Many traders reduce position size or widen stops (and reduce size to keep the rupee risk the same) on such days, rather than betting on a direction. If you trade options, a larger expected move matters for how premiums behave.
Playbook B: perspective for long-term investors
On a stock’s history page, look at the worst calendar years and the deepest falls from the high. If a stock you hold is down 17% from its peak, as Reliance was on 8 Nov 2026 (₹1,324 against a highest close of ₹1,600.90 in July 2024), its history shows whether such falls have been common and how long they lasted. That context can stop panic selling, though it does not mean a recovery is assured.
Playbook C: checking a claim you heard
When someone says “this month is always good” or “this stock always rises before results”, check it. Count the up years, look at the last ten years on their own, and look at the size of the losing years. Most such claims turn out to be a mild tilt at best.
Risk first, always. Whatever a seasonal table shows, decide your maximum loss per trade, use a stop loss, and size the position with the position size calculator.
Case studies (data to 8 Nov 2026)
1. NIFTY 50’s “best month”: November
Across 26 complete years, November averaged +2.72% and rose in 62% of years: the best month on the page. But almost all of that edge came from the first half of the history. From 2000 to 2012 November averaged +3.99% and rose in 9 of 13 years; from 2013 to 2025 it averaged +1.44% and rose in 7 of 13. The 2013–2025 Novembers were: −2.0, +3.2, −1.6, −4.7, −1.1, +4.7, +1.5, +11.4, −3.9, +4.1, +5.5, −0.3, +1.9 (%). Lesson: the label “best month” rested on old data and one very strong November in 2020.
2. Union Budget day: big moves, no reliable direction
Over 32 Budget days since 2000, NIFTY 50 averaged −0.42% on the day (median −0.13%) and closed higher only 41% of the time. The typical size of the move was ±1.79%. Recent years show the spread: +4.74% in 2021, −2.51% in 2020, −1.96% on 1 Feb 2026 (a Sunday session) and −0.11% on 1 Feb 2025 (a Saturday session). Lesson: the direction is only mildly tilted, but the move is often large. Plan for size, not direction.
3. A stock has its own calendar: Reliance
Reliance’s best month on average was April (+4.55%, up in 59% of years) and its weakest January (−0.08%). In November, NIFTY’s “best” month, Reliance closed higher in 14 of 26 years with an average of +0.63%. On Budget day it averaged −0.93% and closed higher only 34% of the time (32 Budgets). Lesson: index seasonality does not transfer to individual stocks, and a 59% up-rate is a slight tilt, not a pattern to bet on.
4. Muhurat trading and elections: tiny samples
NIFTY 50 averaged +0.48% on Diwali Muhurat sessions and closed higher in 71% of 21 events. On Lok Sabha election result days it averaged +2.52% and closed higher in 60%, but from only 5 events, one of which can swing the average by several points. Lesson: the fewer the events, the less the average means. Muhurat is a one-hour session with thin volumes; treat it as a ritual, not a signal.
Common mistakes
- Buying because “this month is usually good”. Our split test found the monthly ranking did not carry over.
- Reading the average without the up-rate and the count. +2% from 5 events is noise.
- Ignoring the spread. The same month has had +12% and −9% years.
- Mixing index and stock patterns. Each stock has its own history.
- Hunting for patterns across hundreds of pages and acting on the most striking one. Something will always look striking by chance.
- Treating the month in progress as part of the pattern. A strong first week says nothing about the seasonal average.
- Skipping risk management because history “favours” a trade.
Seasonality checklist
- I read the average, the up-rate and the number of years or events together.
- The up-rate is clearly away from 50%, not 55% or 60%.
- I scanned the individual years for extreme outliers.
- The pattern also shows up in the last 10 years, not only earlier.
- I am using it for context (size of move, volatility), not as a buy or sell signal.
- I checked current trend, news and results as well.
- Stop loss and position size are set before any trade.
Glossary
| Seasonality | The tendency, or apparent tendency, of prices to behave differently at certain times of the year, month or week. |
| Heatmap | A table of monthly returns coloured by size and direction. |
| Up years / up-rate | The share of years (or events) with a positive change. |
| Event study | Measuring price behaviour around a recurring event, such as the Budget. |
| Turn of the month | The trading days around the end of one month and the start of the next. |
| Muhurat trading | The short special session held on Diwali. |
| CAGR | Compound annual growth rate: the steady yearly rate that gives the same total return. |
| Standard deviation | A measure of how spread out results are around their average. |
| Rank correlation | How similar two orderings are, from −1 (opposite) through 0 (unrelated) to 1 (identical). |
| Data mining | Searching through many possible patterns until one looks significant by chance. |
Questions
Which is the best month for the Indian stock market?
On ChartMine’s NIFTY 50 page, November had the highest average monthly return since 2000 (+2.72%, up in 62% of years) as of November 2026. But most of that came before 2013; from 2013 to 2025 November rose in only 7 of 13 years. Past monthly patterns are not forecasts.
Does stock market seasonality work?
Seasonal averages describe the past and often fade. In our test, the order of NIFTY 50’s best and worst months in 2000–2012 had essentially no relationship with the order in 2013–2025 (rank correlation 0.01). Use seasonality as context, not as a trading signal.
How does NIFTY perform on Budget day?
Across 32 Union Budget days since 2000, NIFTY 50 averaged −0.42% on the day (median −0.13%) and closed higher 41% of the time. The typical move was about ±1.79%, so the size of the move matters more than its direction.
Is Muhurat trading usually positive?
NIFTY 50 closed higher in 71% of 21 Diwali Muhurat sessions, with an average of +0.48%. The session lasts about an hour with thin volumes, and 21 events is a small sample.
What is the turn-of-the-month effect?
The tendency for prices to do better in the few days around the end and start of a month. On NIFTY 50 since 2000, those days averaged +0.18% against +0.02% on other days. Like other patterns, it may not persist.
Where can I see a stock’s monthly returns history?
Each of the 215 F&O stocks has a seasonality page on ChartMine with a monthly returns heatmap, returns over 1 to 20 years, yearly highs and lows and Budget-day behaviour. Search for the stock on /seasonality/.
Are seasonal patterns reliable enough to trade?
On their own, no. Samples are small (one observation per year), many patterns appear by chance, and known patterns tend to fade. Combine any seasonal idea with current price action and strict risk management.