
☰ All tutorials
Start here
Tool tutorialsHow to trade with ChartMineStocks
Stock monitorMy watchlistStock scores & checklistMarket & sectors
Nifty 50Bank NiftySensexFin NiftyDaily market reportMarket breadthSector rotationSector heatmapStock screenerRelative strength (RS)MCX commodity pricesFear & Greed IndexWhat happens after…Scanners
Top gainers & losersStocks to watch tomorrowNR7 stocks scannerInside bar stocks52-week high stocksGap up & gap down stocksRSI oversold stocksGolden cross stocksSuperTrend buy stocksScan builderEMA 9/21 crossoverMACD crossoverADX strong trendBollinger breakout / squeezeVolume spike stocksOpen = high / open = lowCandlestick pattern scannerNarrow CPR scannerF&O data
F&O ban listOI build-upOption chainPCR & max painExpiry calendarF&O lot sizesOI build-up heatmapPCR trendMax pain trendFutures basisStock screens
Quarterly growersProfit growth stocksLow P/E stocksMutual fund buyingNear 52-week low, growingDebt-free companiesHigh ROE & ROCEMagic Formula stocksLow price-to-bookSmart money
FII / DII dataShareholding changesBig-money footprintShort selling dataF&O positions by participantBulk & block dealsPromoter buyingDelivery percentageCalendars
Results calendarQuarterly results trackerBoard meetingsCorporate actionsIPO calendarIPO performanceResearch & planning
Strategy testerCompare stocksDividend yield stocksASM / GSM listExpiry-day movesSeasonality & stock historyNSE holidays 2026Position size calculatorOption payoff calculatorPivot point calculatorMore
Stock scanners hubStock screensHow to use the Low P/E stocks list
A plain-language guide to the P/E ratio and low P/E investing: how P/E is calculated, sector differences, the types of cheap stocks, every column of the list, three playbooks, real case studies and an honest test of the list.
What a low P/E stock is, in plain words
Imagine two shops for sale. Each earns ₹10 lakh profit a year. The first is offered for ₹50 lakh, the second for ₹3 crore. The first costs 5 years of profit, the second 30 years. The first looks cheap, but before buying you would ask: why is it so cheap? Is the area declining? Will profits fall?
The P/E ratio (price-to-earnings) asks the same question about shares. It is the share price divided by the profit per share. A P/E of 10 means you pay ₹10 for every ₹1 the company earned over the last year.
The Low P/E stocks page lists NSE companies with a P/E under 15 whose latest-quarter sales and profit are both higher than a year ago. The growth condition is there to remove some of the “cheap for a reason” cases, companies whose profits are already shrinking. On 9 Nov 2026 (prices of 6 Nov) 148 stocks passed, sorted from the lowest P/E up.
One line to remember: a low P/E means the market is paying little for today’s profits. That can be an opportunity or a warning. The list helps you find candidates to research; ChartMine is not a SEBI-registered adviser.
P/E explained, with real numbers
| Term | Meaning |
|---|---|
| EPS | Earnings per share: net profit ÷ number of shares. |
| Trailing (TTM) EPS | EPS added up over the last four reported quarters. The page uses this. |
| P/E | Share price ÷ trailing EPS. Equivalent: market cap ÷ last four quarters’ profit. |
| Earnings yield | 1 ÷ P/E, as a %. P/E 10 = 10% earnings yield; P/E 25 = 4%. Useful to compare with a fixed deposit rate. |
| Forward P/E | Price ÷ expected future EPS. Needs forecasts; the page does not use it. |
Example: Chennai Petroleum on 6 Nov 2026
Market cap ₹21,470 Cr. Profit over its last four quarters (from its NSE filings): ₹1,400 Cr (Mar 2026) + ₹1,017 Cr (Jun 2026) + ₹2,236 Cr (Sep 2026) + ₹987 Cr (Dec 2025) ≈ ₹5,640 Cr. P/E ≈ 21,470 ÷ 5,640 ≈ 3.8 (the page shows 3.7 using EPS). It topped the list. But one year earlier, in the June 2025 quarter, the same company made a loss of ₹56.6 Cr. Refining profits swing with fuel margins; a very low P/E on a strong year can simply mean the market does not expect that profit to last.
P/E and growth go together
A company growing profits 30% a year deserves a higher P/E than one growing 5%, because its future profits will be much larger. Some investors divide the P/E by the growth rate to get the PEG ratio: P/E 15 with 15% growth gives a PEG of 1; P/E 15 with 5% growth gives 3. A lower PEG means you pay less for each unit of growth. Treat it as a rough guide only: one quarter’s growth rate is too jumpy to use directly, so use growth over several quarters or years.
The opposite also holds: a company whose profits are flat or shrinking can deserve a P/E of 8 or less. That is why the page insists on growth.
What is a “low” P/E? Compare within the sector
On 9 Nov 2026 the median P/E of all 1,250 NSE stocks with one was 26.6. By sector (medians we computed from the screener’s data):
| Sector | Median P/E | Sector | Median P/E |
|---|---|---|---|
| Oil & gas | 13.6 | FMCG | 33.5 |
| Financial services | 17.2 | Auto | 35.0 |
| Metal | 18.0 | Capital goods | 41.8 |
| IT | 24.6 | Pharma & healthcare | 45.6 |
So a P/E of 14 is close to normal for an oil company, and very low for a pharma company. This is why financial companies and oil & gas fill much of the list: of the 148 names on 9 Nov 2026, 38 were financial services and 7 were oil & gas (69 had no sector tag in our list).
Types of low P/E stocks
| Type | Why the P/E is low | What to check |
|---|---|---|
| Low-P/E sector | Banks, lenders, PSUs, metals and energy usually trade at lower multiples. | Compare with sector peers, not the market. |
| Cyclical at the peak | Profits are at a high point of a commodity or margin cycle; the market expects a fall. | Look at profits over several years, not four quarters. |
| Real bargain | Overlooked, small, or out of fashion, while profits are steady. | Steady sales and profit bars, clean balance sheet, a reason the market may notice. |
| Value trap | Profits are about to fall or the business has a hidden problem. | News, debt, governance, falling market share. |
| One-off profit | A one-time gain inflated the last four quarters. | The page removes the worst cases (see below); read the filing. |
How the page guards against bad P/Es
- P/E between 3 and 15. Below 3 is almost always a data error.
- Two ways must agree. P/E from EPS and P/E from market cap ÷ profit must be within a reasonable range of each other, which catches mis-scaled filings.
- No single spike. If one of the last four quarters earned more than three times the typical quarter, the stock is left out: that P/E rests on one exceptional quarter.
- Growth required. Latest-quarter sales and profit both up on a year ago.
- Market value at least ₹500 crore.
Why investors look at low P/E: advantages and limits
✅ Margin of safety
If you pay little for profits, there is less optimism in the price to be disappointed.
✅ Easy to understand
One number, comparable across companies in the same sector.
✅ Growth filter built in
Companies with shrinking sales or profit are removed.
✅ Finds unloved names
Small and out-of-fashion companies appear next to big PSUs.
The limits
- P/E uses past profits. If profits are about to fall, today’s low P/E is an illusion.
- Cyclicals look cheapest at the top. Their P/E is lowest exactly when profits peak.
- Debt is invisible in P/E. Two companies with the same P/E can carry very different debt. See debt-free stocks.
- Loss-makers are excluded, including turnarounds that may soon be profitable.
Did low P/E stocks do better? Our test
We rebuilt the list for two past dates, using only filings available then and the same rules, and measured each share’s change to 6 Nov 2026 (adjusted for splits and bonuses).
| Start date | Group | Stocks | Median change | Share that rose |
|---|---|---|---|---|
| 1 Jun 2026 | Low P/E list | 92 | −0.4% | 49% |
| All stocks with a P/E | 1,019 | −0.6% | 49% | |
| P/E above 60 | 174 | −2.3% | 45% | |
| 18 Aug 2026 | Low P/E list | 115 | −5.8% | 35% |
| All stocks with a P/E | 1,091 | −6.3% | 30% | |
| P/E above 60 | 199 | −5.3% | 31% |
In plain words: over these few months, the low P/E list did about the same as the market, within half a point at the median. It neither protected investors from the August–November fall nor lagged badly. Value investing is usually judged over years, not months, and our data covers too short a period to say more. A low P/E alone is not an edge you can count on.
A tour of the Low P/E page
Open Low P/E stocks. A heading with three facts, the table sorted by P/E, three reminder cards and links to the other screens.

- 1How many stocks pass today.
- 2Date of the prices used.
- 3Fundamentals come from each company’s latest filed quarter.
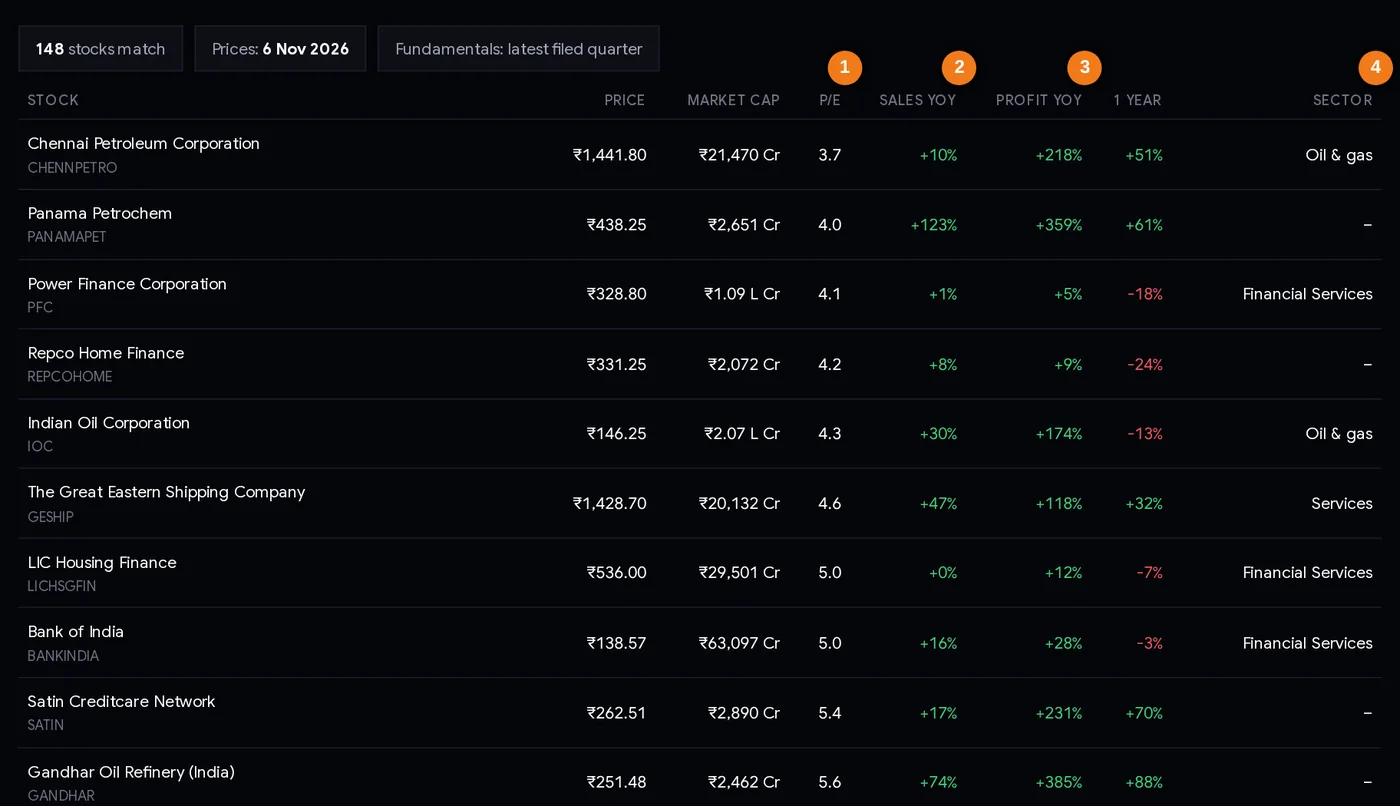
- 1P/E on the last four quarters (sort order).
- 2Sales growth on a year ago.
- 3Profit growth on a year ago.
- 4Sector: compare P/E with the right peers.
Every column explained
| Column | How to read it |
|---|---|
| Stock | Name and symbol; click for the stock page (sector P/E, eight quarters of bars). |
| Price / Market cap | Last close and company value (L Cr = lakh crore). |
| P/E | Price ÷ last four quarters’ EPS. The list is sorted lowest first. |
| Sales YoY / Profit YoY | Latest quarter against a year earlier. Both are positive for every name, by rule. |
| 1 year | Share price change over a year. Low P/E plus a falling price can mean the market sees a problem; low P/E plus a rising price means it is already re-rating. |
| Sector | So you can compare the P/E with the right peers. “–” means no sector tag in our list. |

Step by step: from cheap to understood (25 minutes)
- Group the list by sector in your head: financials, energy, metals, others. Judge each P/E against its own sector median.
- Look at the profit growth column. Very high growth with a very low P/E (e.g. +200% at P/E 4) often means a cyclical peak or a recovery year.
- Open the stock page and view eight quarters of profit. Steady, rising bars are what you want; one tall bar is a warning even if it passed the spike filter.
- Check debt and cash. Low P/E with heavy debt is a different risk. The stock page and debt-free stocks help.
- Ask “why is it cheap?” and write a one-line answer. If you cannot answer, you do not understand the stock yet.
- Check ownership. Promoter stake and recent changes on the stock page; pledged shares or falling promoter holding deserve caution.
- Decide your exit: a fall in profit next quarter, a break in the thesis, or a price level. Size the position for that risk.
Three playbooks
Playbook A: cheap versus its own sector
Use the stock screener: pick one sector, sort by P/E, and look at the companies well below the sector median that still grow. This compares like with like, which the low P/E list alone cannot do.
Playbook B: low P/E with steady growth
Cross-check the low P/E list with Quarterly growers. A company that is both cheap and has grown three quarters in a row is less likely to be a cyclical peak.
Playbook C: patience, not timing
Value can take a long time to be recognised. Investors using this style usually spread money across several names, review them each results season, and exit when the thesis breaks (profits fall, debt rises), not when the price wobbles.
Low P/E does not mean low risk. In our test one list member fell 29% in five months; another rose 79%. Diversify and size each position modestly.
Case studies from the list’s history
Both were on the list rebuilt for 1 Jun 2026. Figures from NSE filings; prices from NSE’s daily files.
1. NLC India: cheap on a big quarter
The March 2026 quarter showed profit of ₹1,393 Cr against ₹482 Cr a year earlier, with sales up from ₹3,836 Cr to ₹5,042 Cr. The P/E was low and growth looked strong. The next quarter (June 2026) profit was ₹436 Cr against ₹798 Cr a year earlier, a fall of about 45%. The share went from ₹336.35 on 1 Jun to ₹237.61 on 6 Nov 2026 (−29%). On 9 Nov 2026 it was back on the list after a strong September quarter (profit ₹1,381 Cr), at P/E 8.3. Lesson: when profits swing between quarters, a low trailing P/E can change quickly. Look at the full eight-quarter picture.
2. Indo Rama Synthetics: small, cheap, re-rated
A company valued at about ₹1,118 Cr on 1 Jun 2026. Its March 2026 quarter profit was ₹64.1 Cr against ₹51.1 Cr a year earlier, on almost flat sales (₹1,202 Cr against ₹1,198 Cr). The P/E was about 7. Profit stayed near that level in the next two quarters (₹63.7 Cr and ₹74.1 Cr), and the share went from ₹42.83 to ₹76.57 by 6 Nov 2026 (+79%). Lesson: when a cheap company’s profit holds up, the market can re-rate it. Note that it was a small company with flat sales; the same features make it risky.
3. Power Finance Corporation: low P/E, slow growth (9 Nov 2026)
On the list at P/E 4.1, with income +1% and profit +5% for the September 2026 quarter, and a share price 18.5% lower than a year earlier. Lenders usually trade at lower P/Es (financial services median 17.2), and slow growth explains part of the rest. Lesson: a low P/E with low growth can stay low for a long time. Ask what would change it.
Common mistakes
- Comparing P/E across sectors. A bank at 8 and a pharma company at 30 can both be “normal”.
- Buying cyclicals at the lowest P/E. That is often the profit peak.
- Ignoring debt. P/E does not show borrowings.
- Treating low P/E as low risk. Prices of cheap stocks can fall as much as expensive ones.
- Expecting quick results. Value often needs years; our test shows months prove little.
- Not asking why. Every cheap stock has a reason. Find it.
Checklist before you act
- P/E compared with the stock’s own sector median.
- Eight quarters of profit look steady, not one peak.
- Not a cyclical at the top of its cycle (or you accept that risk knowingly).
- Debt level checked.
- Promoter holding and pledges checked.
- I can explain in one line why it is cheap and why that may change.
- Exit condition and position size decided.
Glossary
| P/E | Price ÷ earnings per share. |
| EPS | Earnings per share. |
| TTM | Trailing twelve months: last four quarters. |
| Earnings yield | 1 ÷ P/E, in %. |
| Value investing | Buying shares priced low against profits or assets. |
| Value trap | A cheap-looking stock whose profits then fall. |
| Cyclical | A business whose profits rise and fall with a cycle. |
| Re-rating | The market paying a higher or lower P/E for the same company. |
| Sector median | The middle P/E of all companies in a sector. |
Questions
What is a good P/E ratio for Indian stocks?
There is no single number. It depends on the sector and growth. On 9 Nov 2026 the median P/E of NSE stocks was 26.6, but sector medians ranged from about 13.6 (oil & gas) to 45.6 (pharma & healthcare). Compare a stock with its own sector.
Which stocks have a low P/E and growing profits?
ChartMine’s Low P/E page lists NSE stocks with a P/E under 15 whose latest-quarter sales and profit are both up on a year ago. On 9 Nov 2026, 148 stocks passed.
How is P/E calculated on ChartMine?
Latest price divided by the sum of the last four quarters’ EPS from the company’s results filed with NSE, cross-checked against market cap divided by the last four quarters’ profit.
Is a low P/E stock always undervalued?
No. A low P/E can mean the market expects profits to fall, or that profits are at a cyclical peak. In our test, the low P/E list did about the same as the market over the following months.
Why are banks and PSUs common in low P/E lists?
Lenders, energy and many government-owned companies usually trade at lower P/Es than consumer or pharma companies, so they pass an absolute limit like 15 more easily.
What is the difference between trailing and forward P/E?
Trailing P/E uses profits already reported (the last four quarters). Forward P/E uses forecast profits. ChartMine uses trailing P/E because it needs no forecasts.