
☰ All tutorials
Start here
Tool tutorialsHow to trade with ChartMineStocks
Stock monitorMy watchlistStock scores & checklistMarket & sectors
Nifty 50Bank NiftySensexFin NiftyDaily market reportMarket breadthSector rotationSector heatmapStock screenerRelative strength (RS)MCX commodity pricesFear & Greed IndexWhat happens after…Scanners
Top gainers & losersStocks to watch tomorrowNR7 stocks scannerInside bar stocks52-week high stocksGap up & gap down stocksRSI oversold stocksGolden cross stocksSuperTrend buy stocksScan builderEMA 9/21 crossoverMACD crossoverADX strong trendBollinger breakout / squeezeVolume spike stocksOpen = high / open = lowCandlestick pattern scannerNarrow CPR scannerF&O data
F&O ban listOI build-upOption chainPCR & max painExpiry calendarF&O lot sizesOI build-up heatmapPCR trendMax pain trendFutures basisStock screens
Quarterly growersProfit growth stocksLow P/E stocksMutual fund buyingNear 52-week low, growingDebt-free companiesHigh ROE & ROCEMagic Formula stocksLow price-to-bookSmart money
FII / DII dataShareholding changesBig-money footprintShort selling dataF&O positions by participantBulk & block dealsPromoter buyingDelivery percentageCalendars
Results calendarQuarterly results trackerBoard meetingsCorporate actionsIPO calendarIPO performanceResearch & planning
Strategy testerCompare stocksDividend yield stocksASM / GSM listExpiry-day movesSeasonality & stock historyNSE holidays 2026Position size calculatorOption payoff calculatorPivot point calculatorMore
Stock scanners hubStock screensHow to use the PCR & max pain page
A plain-language guide to the put-call ratio and max pain: calls, puts and open interest for beginners, the real NIFTY calculation, an honest test on 580 sessions of data, a tour of the page and three case studies from autumn 2026.
What PCR and max pain are, in plain words
Options are contracts on a stock or index. A call option gains when the price goes up; a put option gains when the price goes down. Every option has a buyer, who pays a small premium, and a seller (also called a writer), who collects that premium and takes on the risk. Each option has a strike (the price it refers to) and an expiry (the day it ends).
At the end of each day the exchange reports how many contracts are still open at every strike. This is the open interest (OI). Two popular numbers are built from it:
- Put-call ratio (PCR): total put OI ÷ total call OI. A PCR of 1.65 means 1.65 puts are open for every call.
- Max pain: the expiry price at which all the open options together would be worth the least. At that price option buyers, as a group, collect the least and option writers keep the most.
One line to remember: PCR and max pain describe how options are positioned today. Neither is a forecast. Our own test of 122 NIFTY expiries (below) found that max pain was a slightly worse guess for the expiry price than simply assuming “no change”.
The PCR & max pain page shows both numbers for NIFTY, BANK NIFTY, FIN NIFTY, MIDCAP NIFTY and every F&O stock after each close, with how far the price is from max pain and a 30-session NIFTY chart.
PCR explained: how it is calculated and read
The page shows two PCRs for each instrument:
| Version | What it counts | Why it matters |
|---|---|---|
| PCR (near) | Put OI ÷ call OI for the nearest expiry only | Short-term positioning: this is where most trading happens, especially in NIFTY’s weekly options. |
| PCR (all) | Put OI ÷ call OI across every open expiry | A steadier, broader picture that does not jump when a weekly series expires. |
Real example: NIFTY on 6 Nov 2026
For the 9 Nov expiry, NSE’s file showed 24.02 crore units of put OI and 14.53 crore units of call OI. 24.02 ÷ 14.53 = 1.65. Across all expiries the ratio was 1.47.
How traders read PCR (and why it is tricky)
The same number is read in two opposite ways, which is the first warning sign:
- The “writers” view: most index options are sold by large, well-funded traders. Many puts open means many traders are selling puts, i.e. willing to bet the price stays above those strikes. On this view a high PCR is supportive.
- The “contrarian” view: many puts means many people are hedging or betting on a fall; when “everyone” is fearful, the market has often already fallen. On this view a very high PCR is a sign of excess.
A rough convention on Indian indices is that a PCR between about 0.7 and 1.3 is unremarkable, below 0.7 is call-heavy and above 1.3 is put-heavy; the page’s PCR filter uses exactly those bands. Treat them as descriptions, not signals.
Max pain explained, with the real NIFTY numbers
To find max pain, take every strike as a possible expiry price. For each one, add up what every open call and put would be worth at expiry (its intrinsic value: how far it is in the money × its open interest). The strike where that total is smallest is max pain.
Here is that calculation for NIFTY’s 9 Nov 2026 options, from the end-of-day open interest on 6 Nov (NIFTY closed at 25,030.35):
| If NIFTY expired at… | Total value of all open 9 Nov options |
|---|---|
| 24,000 | ₹5,559 crore |
| 24,500 | ₹2,684 crore |
| 24,700 (max pain) | ₹2,440 crore (the lowest) |
| 25,000 | ₹3,061 crore |
| 25,030 (the 6 Nov close) | ₹3,213 crore |
| 25,500 | ₹6,436 crore |
| 26,000 | ₹11,684 crore |
So max pain was 24,700, and the page shows NIFTY +1.34% above it. Notice how flat the bottom is: between 24,500 and 25,000 the totals are within about ₹600 crore of each other, while far from the price they explode. That shape is why max pain usually sits close to the current price, and why it moves when the price moves.
The theory and the catch. The idea behind max pain is that large option writers would like the price to finish where they pay least, and may trade to keep it there near expiry. The catch: max pain is computed from today’s open interest, which itself follows the price. In practice it trails the market more than it leads it (case study 1).
Why traders watch PCR and max pain: advantages and limits
✅ A quick read of positioning
One number tells you whether puts or calls dominate, without scrolling through a whole option chain.
✅ A reference level near expiry
Max pain, and the strikes with the most OI, show where option money is concentrated. Price often spends time near heavy strikes.
✅ Every stock in one table
Sort 224 instruments by PCR or by distance from max pain in seconds.
✅ History
The 30-session chart and the PCR history and max pain history pages show whether today is unusual.
The limits: what our data says
We tested both numbers on ChartMine’s own end-of-day history: 580 sessions from July 2024 to November 2026.
| Test | Result |
|---|---|
| NIFTY, 122 expiries: did the expiry close move towards the previous day’s max pain? | 54 of 122 times (44%) |
| NIFTY: average gap between expiry close and max pain, versus gap between expiry close and the previous day’s close | 0.68% vs 0.60%: max pain was the worse guess |
| BANK NIFTY, 43 expiries, same tests | towards max pain 49%; gap 0.80% vs 0.57% |
| F&O stocks, 5,811 monthly expiries, one day before | towards max pain 44%; median gap 3.15% vs 0.94% |
| NIFTY all-expiry PCR above 1.2 (79 days): NIFTY higher 5 sessions later? | 54% of the time (median +0.09%) |
| NIFTY all-expiry PCR 0.8–1.0 (237 days) | 45% (median −0.25%) |
In plain words:
- No magnet effect in this period. Expiry prices did not drift towards max pain more often than away from it. Sometimes the price pins it exactly (case study 2); often it does not.
- High PCR was not a sell signal here. If anything, NIFTY did slightly better after high-PCR days, but the difference is small and the sample short. It is not an edge to trade on its own.
- PCR on stocks is thin. Many stock options have little open interest away from a few strikes, so stock PCRs can jump around on small trades.
So how should you use them? As context: a description of where option positions are concentrated and how crowded one side is. Combine them with price action and levels, and always manage risk with a stop loss and a sensible position size.
A tour of the PCR & max pain screen
Open PCR & max pain. At the top are four index cards and the NIFTY chart; below them, the filters and the table of every F&O instrument.
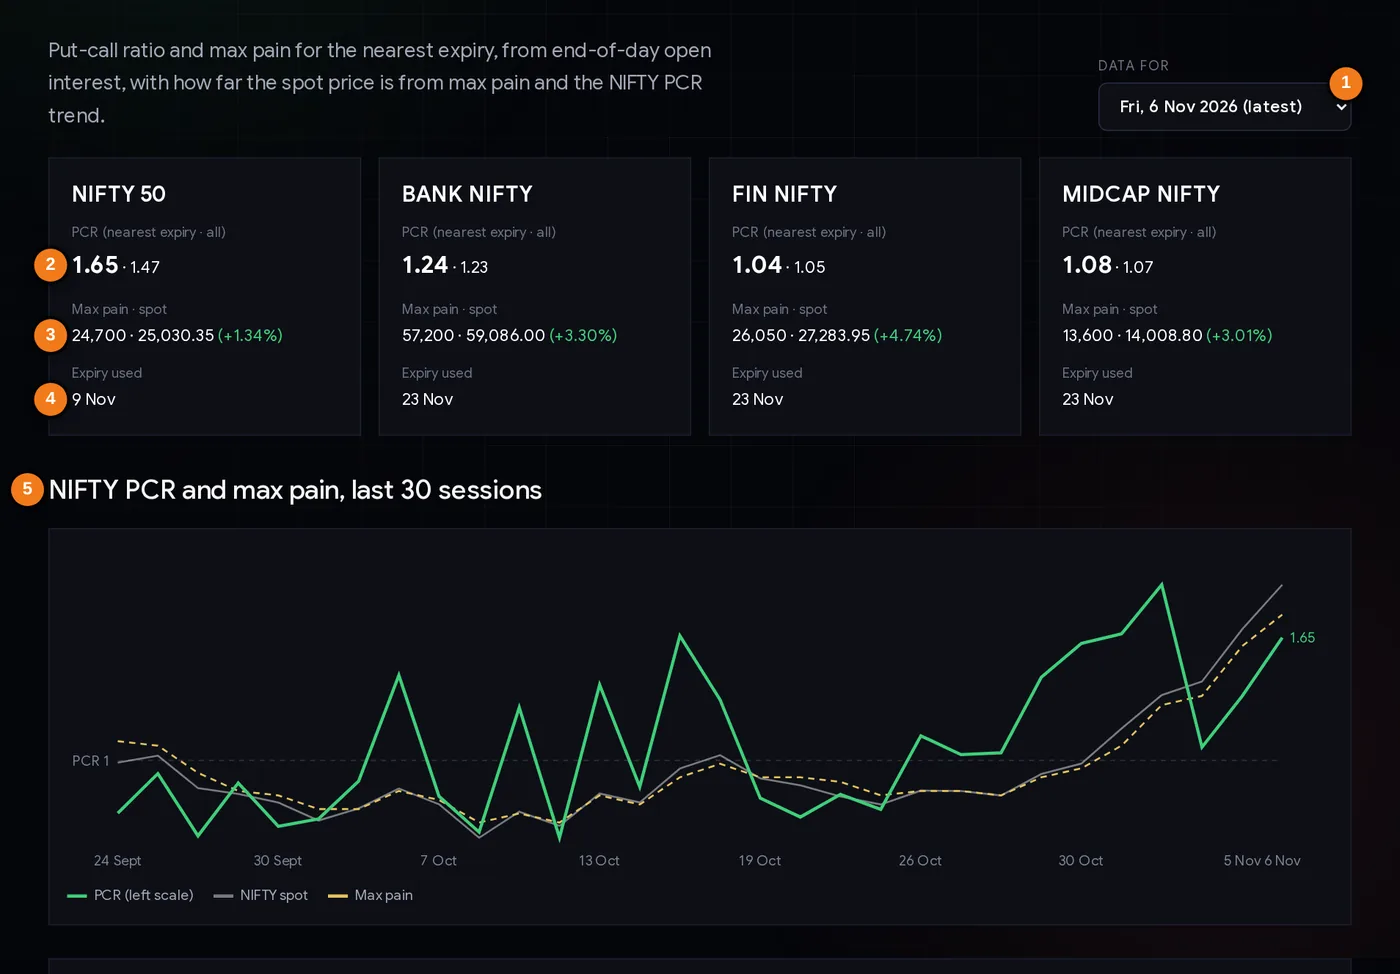
- 1Data for: pick any of the last 30 sessions.
- 2PCR: nearest expiry (large) and all expiries.
- 3Max pain, spot and the gap between them.
- 4Which expiry the numbers use.
- 5NIFTY PCR, spot and max pain over 30 sessions.
Each index card shows the PCR for the nearest expiry in large type and the all-expiry PCR after the dot; then max pain, spot and the gap between them (+1.34% means NIFTY closed 1.34% above max pain); and which expiry was used. NIFTY uses its weekly expiry (9 Nov here); BANK NIFTY, FIN NIFTY and MIDCAP NIFTY have only monthly options (23 Nov).
The chart plots NIFTY’s near-expiry PCR (green, left scale) with NIFTY’s spot (grey) and max pain (dashed yellow) over the last 30 sessions. Hover to read any day. Watch how the dashed max-pain line hugs the grey price line: that is max pain following price.
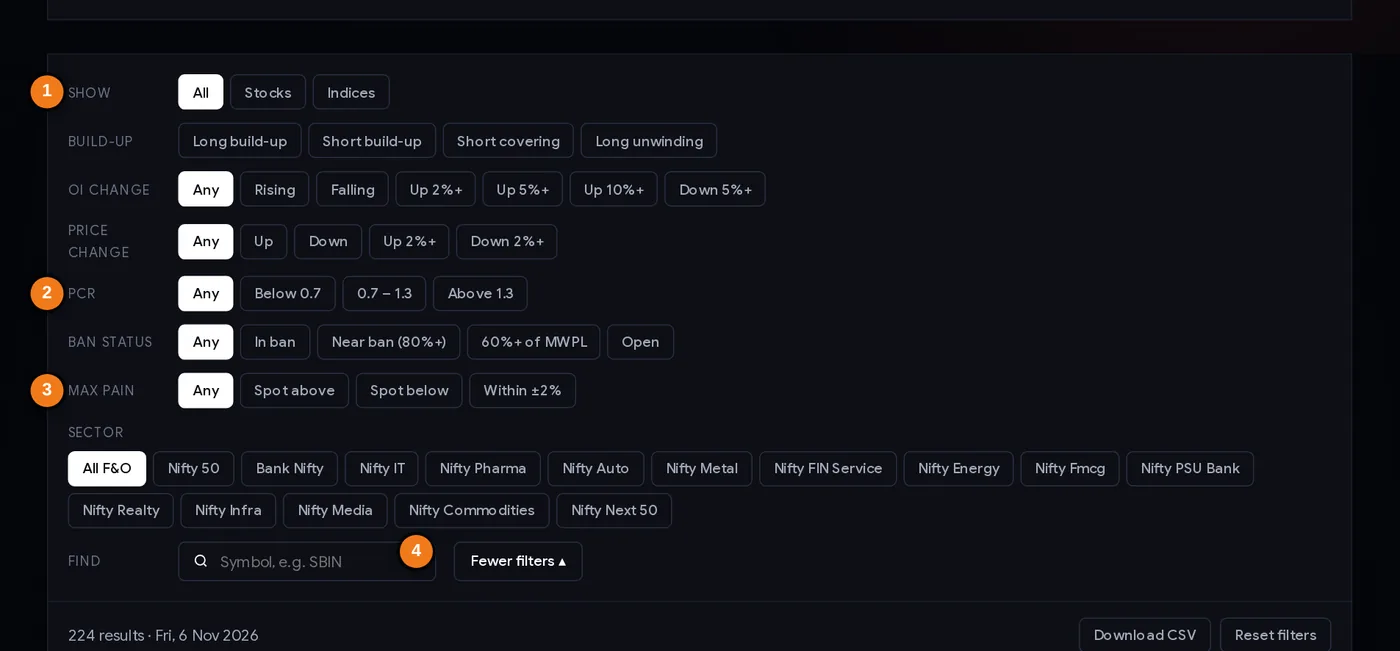
- 1Stocks or indices
- 2PCR band: below 0.7, 0.7 to 1.3, above 1.3
- 3Price versus max pain
- 4Find a symbol
The filters are shared with the other F&O pages. For PCR work the useful ones are Show (stocks or indices), PCR (below 0.7, 0.7 to 1.3, above 1.3), Max pain (spot above, spot below, or within ±2%) and Find.
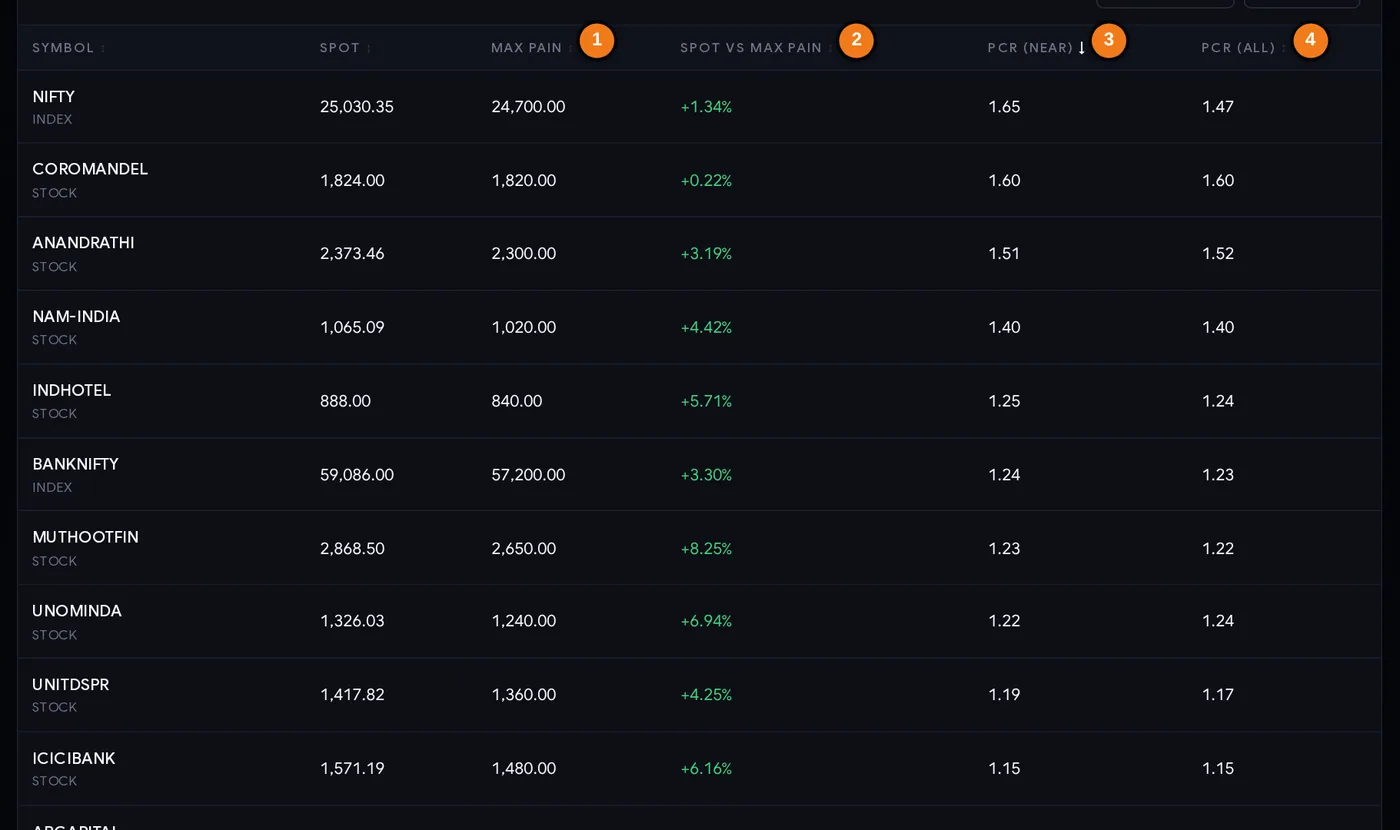
- 1Max pain (nearest expiry)
- 2Spot versus max pain, in %
- 3PCR, nearest expiry
- 4PCR, all expiries
Every column explained
| Column | What it tells you |
|---|---|
| Symbol | The stock or index. |
| Spot | The underlying’s closing price from NSE’s F&O file. |
| Max pain | The strike where all open options of the nearest expiry would be worth the least. |
| Spot vs max pain | (Spot ÷ max pain − 1) in %. Positive: the price is above max pain. |
| PCR (near) | Put OI ÷ call OI, nearest expiry. The default sort, highest first. |
| PCR (all) | Put OI ÷ call OI, all open expiries. |
Click any header to sort. Download CSV saves what you see. The Data for box goes back 30 sessions.
Step by step: a 10-minute evening routine
- After the evening update, open the page and check the “Data for” date.
- Read the NIFTY card. Note PCR (near and all), max pain and the gap. Check which expiry is used: on the day before a weekly expiry, the near PCR describes options with one session left.
- Look at the chart, not just today’s number. Is PCR rising or falling over the last week? Is max pain moving with the price?
- Compare the two PCRs. A near PCR far above the all-expiry PCR means the current week is unusually put-heavy; it can reverse quickly when that series expires.
- Open the option chain for the index or stock you trade (option chain) to see which strikes hold the most OI. PCR and max pain are summaries of that chain.
- For stocks, filter Max pain → Within ±2% or sort by PCR, then check that the stock’s options are actually liquid before reading anything into its numbers.
- Write down levels, not predictions: max pain, the highest call OI strike and the highest put OI strike, and what price would prove your idea wrong.
Three playbooks
Playbook A: PCR as a sentiment thermometer
Track the NIFTY all-expiry PCR on the chart. Readings that are extreme for the recent past (for example above 1.4 or below 0.7) tell you positioning is one-sided. Do not trade the number itself. Instead, wait for price to confirm: a put-heavy market that then breaks its recent low, or a call-heavy market that breaks its recent high, is telling you the crowded side is being tested.
Playbook B: max pain and OI strikes on expiry week
Option sellers often look at max pain and the highest-OI strikes in the last days before expiry, as a map of where the price may hover if nothing big happens. A typical approach is defined-risk: for example, a spread whose short strikes sit beyond the highest call and put OI. Check the payoff and worst case with the option payoff calculator first. Our data says the price moves away from max pain more often than towards it, so never assume a pin.
Playbook C: spot the stretched stocks
Sort the table by Spot vs max pain. Stocks far above or below max pain have moved a long way from where their options are concentrated, usually because of news or a strong trend. That is a reason to look closer at the chart and the OI build-up, not a reason to bet on a return.
Risk first. Option selling can lose far more than the premium collected. Decide your maximum loss before entering, use stops or defined-risk spreads, and size with the position size calculator.
Case studies from October and November 2026
Three real NIFTY episodes from the page’s own history. Index levels are closing values.
1. The rally that high PCR did not stop (27 Oct to 6 Nov 2026)
On 27 Oct NIFTY closed at 22,749.75 with a near-expiry PCR of 1.01. Over the next eight sessions it rose to 25,030.35 on 6 Nov, about +10%. Along the way the PCR climbed: 1.44 on 29 Oct, 1.62 on 30 Oct, 1.67 on 2 Nov and 1.65 on 6 Nov.
A trader using the contrarian rule (“PCR above 1.4 means too many puts, the market is overbought”) would have been fighting the trend from 29 Oct, when NIFTY was at 22,936.75, with more than 2,000 points still to come. Meanwhile max pain chased the price: 22,750 on 27 Oct, 23,600 on 3 Nov, 24,350 on 5 Nov and 24,700 on 6 Nov. Lesson: in a strong trend, rising PCR often reflects put writers following the price up, and max pain follows rather than leads.
2. A textbook pin: the 27 Oct 2026 monthly expiry
On 26 Oct NIFTY closed at 22,753.20; max pain for the next day’s expiry was 22,750. On expiry day, 27 Oct, NIFTY closed at 22,749.75, less than a point from max pain. Days like this are why max pain is popular. Lesson: pins happen, but they are memorable precisely because they are not the rule (44% “towards” in our 122-expiry test).
3. Moving away: the 3 Nov 2026 weekly expiry
On 2 Nov NIFTY closed at 23,440.80 with max pain at 23,250, and PCR at 1.67. On expiry day it closed at 23,810.85: up 370 points, ending further from max pain, not closer. Lesson: when the market is trending, the trend usually wins over expiry positioning. Keep a stop on any trade that depends on a pin.
Common mistakes
- Treating a PCR level as a buy or sell signal. The same number is read both ways, and our test found no reliable edge.
- Expecting the price to travel to max pain. In our data it moved away more often than towards it.
- Mixing up near and all-expiry PCR. The near number can swing wildly in the last days of a weekly series.
- Reading PCR on illiquid stock options. A few hundred contracts can swing a stock’s PCR. Check open interest in the option chain first.
- Forgetting that max pain moves. It is recalculated every day from new open interest, and tends to follow the price.
- Selling options without a defined loss. One trending day can wipe out many weeks of premium.
Checklist before using PCR or max pain
- The data date is the latest session, and I know which expiry the numbers use.
- I have looked at the trend of PCR on the chart, not just today’s value.
- I have compared near PCR and all-expiry PCR.
- I have checked the option chain: where are the highest call OI and put OI strikes?
- I know the price trend and key levels; positioning is context, not the trigger.
- For a stock, its options are liquid enough to mean something.
- My trade has a stop loss or a defined maximum loss.
- I have sized the position so that a wrong call costs a small, planned amount.
Glossary
| Call option | The right to buy at the strike price until expiry; gains when the price rises. |
| Put option | The right to sell at the strike price until expiry; gains when the price falls. |
| Strike | The price an option refers to. |
| Option writer | The seller of an option, who collects the premium and carries the risk. |
| Open interest (OI) | Contracts still open at the end of the day. |
| PCR | Put-call ratio: put OI ÷ call OI (nearest expiry, or all expiries). |
| Max pain | The expiry price at which all open options of an expiry would be worth the least. |
| Intrinsic value | What an option is worth if exercised now: for a call, price minus strike; for a put, strike minus price (never below zero). |
| Pin | An expiry close very close to a heavily traded strike or to max pain. |
| Spot | The current price of the underlying stock or index. |
Questions
What is NIFTY PCR today?
The PCR & max pain page shows NIFTY’s put-call ratio for the nearest expiry and for all expiries, from end-of-day open interest, every trading evening. On 6 Nov 2026 it was 1.65 for the 9 Nov expiry and 1.47 across all expiries.
How is the put-call ratio calculated?
Total put open interest divided by total call open interest. For NIFTY on 6 Nov 2026: 24.02 crore units of put OI ÷ 14.53 crore units of call OI = 1.65 for the nearest expiry.
What is a good PCR for NIFTY?
There is no good or bad value. Readings between about 0.7 and 1.3 are common; above 1.3 is put-heavy and below 0.7 call-heavy. In ChartMine’s data from July 2024 to November 2026, a high PCR was not a reliable sell signal.
What is max pain in options?
The expiry price at which all open options of that expiry would be worth the least, so option buyers as a group collect the least. It is calculated from open interest at every strike.
Does NIFTY expire at max pain?
Sometimes, as on 27 Oct 2026, but not usually. Across 122 NIFTY expiries from July 2024 to November 2026, the expiry close moved towards the previous day’s max pain only 44% of the time.
What is the difference between near PCR and all-expiry PCR?
Near PCR counts only the nearest expiry, which reflects short-term positioning and can swing sharply. All-expiry PCR counts every open expiry and is steadier.
Why does max pain change every day?
It is recalculated from each day’s open interest. As traders open and close options, usually following the price, the strike with the lowest total value moves too.