
☰ All tutorials
Start here
Tool tutorialsHow to trade with ChartMineStocks
Stock monitorMy watchlistStock scores & checklistMarket & sectors
Nifty 50Bank NiftySensexFin NiftyDaily market reportMarket breadthSector rotationSector heatmapStock screenerRelative strength (RS)MCX commodity pricesFear & Greed IndexWhat happens after…Scanners
Top gainers & losersStocks to watch tomorrowNR7 stocks scannerInside bar stocks52-week high stocksGap up & gap down stocksRSI oversold stocksGolden cross stocksSuperTrend buy stocksScan builderEMA 9/21 crossoverMACD crossoverADX strong trendBollinger breakout / squeezeVolume spike stocksOpen = high / open = lowCandlestick pattern scannerNarrow CPR scannerF&O data
F&O ban listOI build-upOption chainPCR & max painExpiry calendarF&O lot sizesOI build-up heatmapPCR trendMax pain trendFutures basisStock screens
Quarterly growersProfit growth stocksLow P/E stocksMutual fund buyingNear 52-week low, growingDebt-free companiesHigh ROE & ROCEMagic Formula stocksLow price-to-bookSmart money
FII / DII dataShareholding changesBig-money footprintShort selling dataF&O positions by participantBulk & block dealsPromoter buyingDelivery percentageCalendars
Results calendarQuarterly results trackerBoard meetingsCorporate actionsIPO calendarIPO performanceResearch & planning
Strategy testerCompare stocksDividend yield stocksASM / GSM listExpiry-day movesSeasonality & stock historyNSE holidays 2026Position size calculatorOption payoff calculatorPivot point calculatorMore
Stock scanners hubStock screensHow to use the Sector heatmap
A complete, plain-language guide to ChartMine’s live sector heatmap: how a sector’s colour is decided, how to read the tiles and cards, when to look at it, three playbooks, what 60 days of data say about hot sectors, and four real case studies.
What the sector heatmap is, in plain words
A heatmap is a picture where colour shows size. On the Sector heatmap, every NSE sector is a coloured tile: green if its stocks rose on average, red if they fell, and the deeper the colour, the bigger the move. In one glance you can see which parts of the market had a good day and which had a bad one.
Under the tiles, each sector has a card listing its top 10 stocks for the day: the most traded ones by default, or the biggest gainers or losers if you switch. Click a tile and the page jumps to that sector’s card.
Three things make it useful:
- Live during market hours. From 9:15 AM to 3:30 PM IST the tiles update every 5 minutes, so you can see where the money is going during the day.
- 60 days of history. Pick any of the last 60 trading days, or step back and forward with the arrows, to see how a past day looked.
- Fair sector numbers. Each sector’s move is the equal-weighted average of its actively traded stocks (734 stocks across 20 sectors on 6 Nov 2026), so one giant company cannot paint a whole sector green.
One line to remember: the heatmap shows what happened today, sector by sector. Our data shows that today’s best sector tells you almost nothing about tomorrow’s.
Key ideas: how a sector’s colour is decided
Equal-weighted versus index-weighted
NSE’s own sector indices (NIFTY Bank, NIFTY IT and so on) are weighted by company size. In NIFTY Bank a few large private banks carry most of the weight. ChartMine’s heatmap instead gives every stock the same vote. A sector tile is green only if its stocks on average rose.
| Index-weighted (NSE indices, NIFTY 50) | Equal-weighted (this heatmap) | |
|---|---|---|
| Who drives it | The largest companies | Every stock equally |
| Answers | “How did the big names do?” | “How did the typical stock in this sector do?” |
| Can disagree? | Yes. On 6 Nov 2026 NIFTY 50 rose 2.01%, led by ICICI Bank (+4.75%) and HDFC Bank (+3.72%), but only 5 of 20 sectors were green on the heatmap and the average stock fell 0.66%. | |
Where the sectors come from
NSE classifies every stock in the NIFTY Total Market index into an industry. The heatmap uses those industries (shortened, e.g. “Fast Moving Consumer Goods” becomes FMCG), keeps only sectors with at least 3 actively traded stocks, and includes stocks with a median turnover of ₹1 crore a day or more plus every F&O stock.
Reading the colour
- Green = average move above zero; red = below zero.
- Colour depth grows with size and is at full strength from about ±3.5%. A tile at +0.2% is pale; a tile at +4% is bright.
- Within each card, every stock gets its own small coloured box with its % change, and its turnover in ₹ crore.
Live versus closing
During market hours the latest tile set is marked Live with the time of the last update. Live moves come from intraday prices and are replaced in the evening by NSE’s official closing prices.
Why use it: advantages and limits
✅ Instant market mood
Twenty tiles tell you in two seconds whether the selling or buying was everywhere or only in a few places.
✅ Finds the day’s story
A single bright tile (Media +5.47% on 4 Nov 2026) shows where the action was; its card shows which stocks drove it.
✅ Live, then archived
Watch it during the day; look back over 60 days to compare.
✅ Honest averages
Equal weighting shows the typical stock, not just the giants.
The limits (please read this part)
Many traders assume that today’s strongest sector will stay strong tomorrow. We checked this on the heatmap’s own data: the 60 trading days from 12 Aug to 6 Nov 2026 (59 day-to-next-day pairs).
| Question | Result |
|---|---|
| Where did today’s best sector rank the next day (out of 20)? | 10.9 on average: the middle of the pack |
| How often did today’s best sector beat the median sector the next day? | 31 of 59 days (53%), close to a coin toss |
| How similar was the sector order from one day to the next? (rank correlation, 1 = identical, 0 = unrelated) | 0.02: practically unrelated |
What this means in plain words:
- Daily sector moves did not carry over in this period. Chasing yesterday’s hottest sector at today’s open had no edge.
- Small sectors swing the most. Utilities (4 stocks) was the best sector on five days in September and the worst on several others, including 15 Sep (−4.62%).
- One day is noise. For trends that last weeks, use the sector rotation chart, which works on weekly data.
- Sixty days is a short sample. The result could differ in other periods, but it matches the common finding that one-day moves are mostly random.
So how should you use it? To understand the day (broad or narrow, which sectors and which stocks), to find stocks worth a closer look, and to compare with past days. Not as a signal to buy the hottest tile.
A tour of the Sector heatmap page
Open the Sector heatmap. The page has a summary row, the day picker, the tiles, and one card per sector.
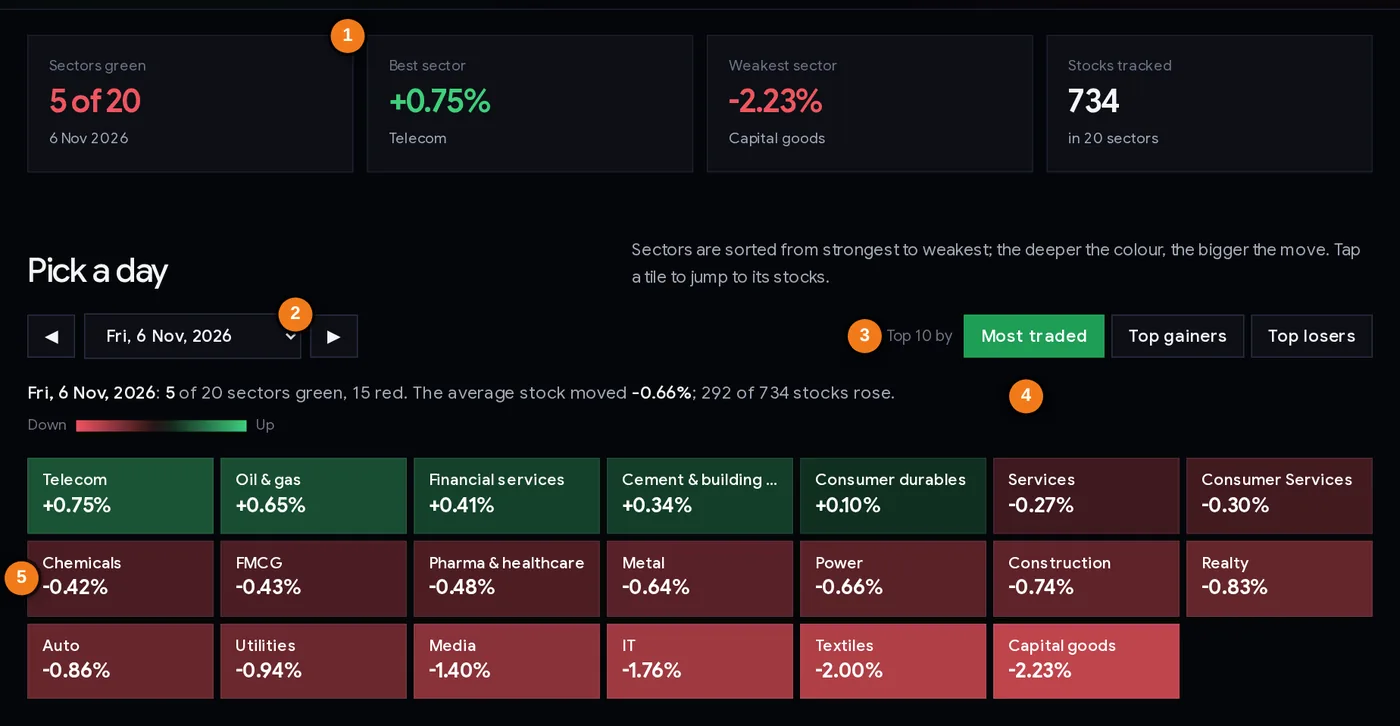
- 1Summary boxes: sectors green, best, weakest, stocks tracked
- 2Day picker (last 60 trading days, or Live today) with ◀ ▶ arrows
- 3Top 10 by: most traded, top gainers, top losers
- 4Summary line for the chosen day
- 5Sector tiles, strongest to weakest; click one to jump to its card
| Part | What it does |
|---|---|
| Summary boxes | How many sectors were green, the best and weakest sector with their moves, and how many stocks are tracked. |
| Day picker | Choose any of the last 60 trading days. During market hours the top choice is “Live today” with the time of the last update. The ◀ ▶ arrows step one day back or forward. |
| Top 10 by | Changes the list inside each sector card: Most traded (highest turnover, the default), Top gainers or Top losers. |
| Summary line | The date, sectors green and red, the average stock’s move, and how many stocks rose. |
| Tiles | Every sector, sorted from strongest to weakest. Click a tile to jump to its card. |
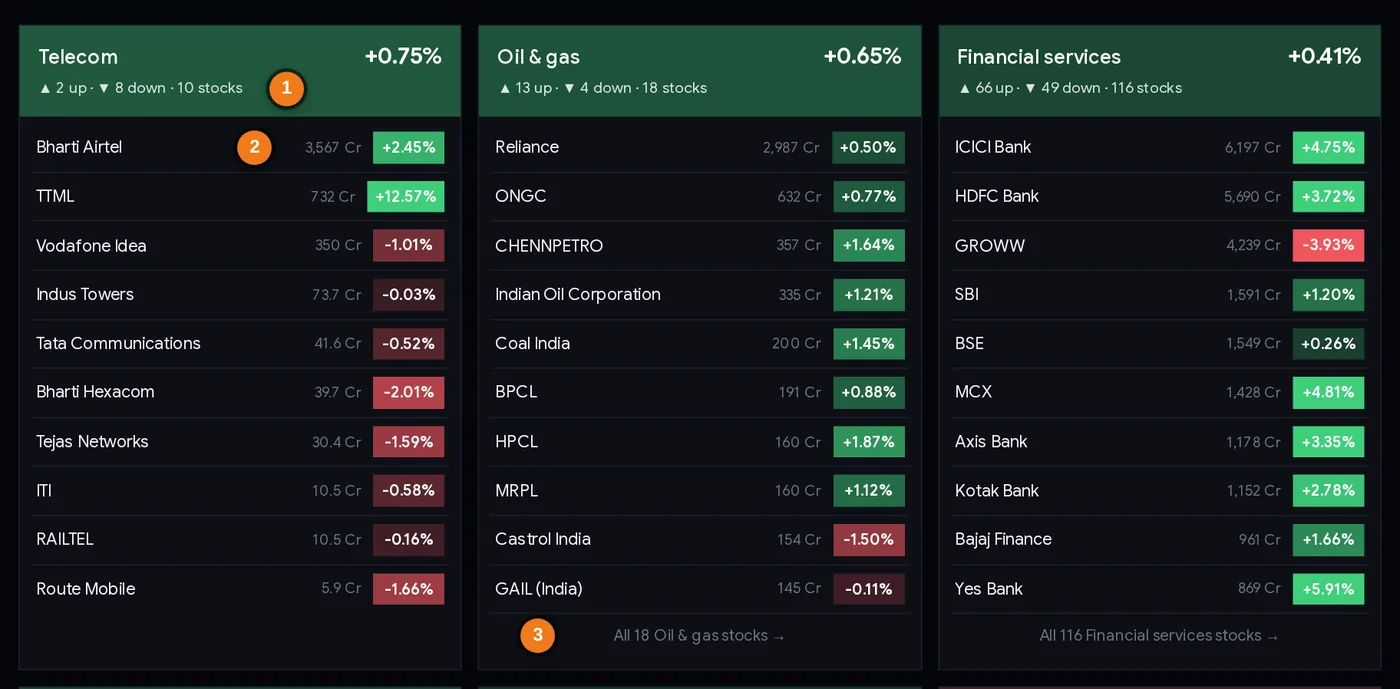
- 1Sector move and how many of its stocks rose and fell
- 2Turnover in ₹ crore and the stock’s % move
- 3Open the sector page with all its stocks
Reading a sector card
- Header: the sector’s average move, and how many of its stocks went up and down (for example “▲ 3 up · ▼ 9 down · 12 stocks”). This count tells you if a sector’s move was broad or carried by one or two names. On 6 Nov 2026 Telecom was the best sector (+0.75%), yet only 2 of its 10 stocks rose: TTML (+12.57%) and Bharti Airtel (+2.45%) lifted the average while the other eight fell.
- Rows: the top 10 stocks. Each shows the day’s turnover in ₹ crore and its % move in a coloured box.
- “All N stocks →” opens the sector page with every stock, RS rating and returns.
- Click any stock name for its own stock page.
Step by step: three times to look at it
During the day (2 minutes, a few times)
- Open the page; check that the top choice says Live and the update time is recent.
- Count green and red tiles. Mostly one colour = a broad move; mixed = rotation inside the market.
- Click the brightest tile and switch to Top gainers (or Top losers) to see which stocks lead it.
- Check whether a stock you own or watch is moving with its sector or against it. A stock rising while its sector falls is showing its own strength (or its own news).
After the close (5 minutes)
- Reload after the evening refresh (around 8 PM IST) to see official closing moves.
- Compare the summary line (“the average stock moved…”) with NIFTY’s change. A big gap means the index was driven by a few heavyweights.
- Note the best and worst sectors in your journal, and the up/down counts inside them.
At the weekend (10 minutes)
- Step back through the week with the ◀ arrow.
- Note any sector that was green on most days, not just one. Then check it on the rotation chart.
- Look for stocks that kept appearing among the top gainers of their sector; check them on their stock pages.
Three ways traders use it
Playbook A: trade with the sector, not against it (intraday)
Before entering an intraday long, check the stock’s sector tile on the live heatmap. If the sector is red and most of its stocks are falling, many traders skip the long or use a smaller size and a tighter stop. If the sector is green and broad (most stocks up), the trade has company. This does not predict anything; it simply avoids fighting the crowd on that day.
Playbook B: find the leader inside a strong sector
When a sector tile is bright green, switch to Top gainers. The stocks at the top with high turnover (not tiny names moving on thin volume) are the day’s leaders. Add the ones that interest you to your watchlist and study them in the evening, checking for news or results that explain the move.
Playbook C: spot narrow days
Compare the heatmap with NIFTY. When NIFTY is up strongly but most tiles are red (as on 6 Nov 2026), the rally is narrow. Traders often treat such days with more caution: smaller positions, quicker profit-taking. The market breadth page confirms this with advances and declines.
Always decide your stop loss first and size the trade with the position size calculator. Sector colours can flip within hours.
Case studies from the last 60 days
Real days from the heatmap’s own history (equal-weighted moves, closing prices).
1. Thursday 8 Oct 2026: a sea of red
0 of 20 sectors closed green. The average stock fell 2.55% and only 51 of 730 stocks rose. Even the “best” sector, IT, fell 1.38%; Capital goods was worst at −3.38%. The next day, 9 Oct, 17 of 20 sectors were green and IT was the best sector (+2.11%). Lesson: on days when everything is red, the cause is usually market-wide (global news, flows), and individual stock analysis matters less than position size.
2. Wednesday 4 Nov 2026: everything green, then the leader flips
All 20 of 20 sectors were green, the average stock rose 2.0% and 592 of 734 stocks rose. Media was the brightest tile at +5.47%. The next day, 5 Nov, Media was the worst sector at −1.06%, while Realty led (+3.53%). Lesson: a trader who bought the hottest sector the next morning would have been on the wrong side. This is our 60-day test in one example.
3. Friday 6 Nov 2026: NIFTY up 2%, heatmap mostly red
Only 5 of 20 sectors were green; the average stock fell 0.66% and 292 of 734 rose. Telecom was best (+0.75%) and Capital goods worst (−2.23%). Yet NIFTY 50 rose 2.01%, carried by large banks such as ICICI Bank (+4.75%) and HDFC Bank (+3.72%). Financial services, with 116 stocks, was up just 0.4% on the equal-weighted heatmap. Lesson: the heatmap shows the typical stock; the index shows the giants. Read both.
4. September 2026: the tiny sector that kept topping the list
Utilities, a sector of only 4 actively traded stocks, was the best sector on 4, 7, 9, 10 and 11 Sep. On 15 Sep, a broad sell-off day (1 of 20 sectors green, the average stock −2.44%), it was the worst at −4.62%. Lesson: in a small sector one stock can colour the whole tile. Check the stock count and the up/down split in the card before drawing conclusions.
Common mistakes
- Buying yesterday’s best sector. Case 2: Media went from best to worst in one day. Our test: no carry-over.
- Reading the heatmap as the index. Case 3: NIFTY +2.01% with 15 sectors red.
- Ignoring sector size. Case 4: a 4-stock sector topped the list five times in a month.
- Trusting a tile without opening the card. A green tile with “▲ 2 up · ▼ 8 down” is one stock’s story.
- Treating live numbers as final. Intraday tiles change every 5 minutes and are replaced by official closes in the evening.
- Chasing the top gainer. A stock already up 8% intraday has used up much of its move; any entry needs a clear stop.
Heatmap checklist
- Correct day picked (Live today, or the date you want).
- Green vs red count noted: broad or narrow day?
- Average stock’s move compared with NIFTY’s move.
- Brightest and darkest tiles opened; up/down counts checked.
- Stock count of the sector checked (small sectors swing more).
- Leaders (top gainers with real turnover) noted for evening study.
- No trade taken just because a sector was hot today.
- Any trade has a stop loss and a position size.
Glossary
| Heatmap | A chart where colour shows the size of a move. |
| Sector | A group of companies in the same industry, from NSE’s classification. |
| Equal-weighted | Every stock counts the same, whatever its size. |
| Index-weighted | Bigger companies count more (how NIFTY 50 works). |
| Turnover | The value of shares traded in the day, in ₹ crore. |
| Broad move | Most stocks and sectors moving the same way. |
| Narrow move | A move carried by a few stocks or sectors. |
| Rank correlation | A number from −1 to 1 showing how similar two orderings are; 0 means unrelated. |
Questions
Which sector is up today in the Indian stock market?
The ChartMine Sector heatmap shows every NSE sector’s move, live every 5 minutes during market hours (9:15 AM to 3:30 PM IST) and with official closing prices in the evening. Green tiles rose, red tiles fell.
How is a sector’s move calculated on the heatmap?
It is the equal-weighted average daily move of every actively traded NSE stock in that sector, using NSE’s industry classification for the NIFTY Total Market stocks, so a few giant companies cannot dominate it.
Why are most sectors red when NIFTY is up?
NIFTY 50 is weighted by company size, so a few large stocks can lift it while the typical stock falls. On 6 Nov 2026 NIFTY rose 2.01% but only 5 of 20 sectors were green on the heatmap.
Does the best sector today keep rising tomorrow?
Not in our data. Over 60 trading days (12 Aug to 6 Nov 2026), the day’s best sector ranked 10.9 out of 20 on average the next day and beat the median sector only 53% of the time.
Can I see the sector heatmap for a past date?
Yes. Pick any of the last 60 trading days from the day picker, or use the arrows to step back and forward.
What do the stocks under each sector show?
The top 10 stocks of that sector for the chosen day: the most traded by default, or the biggest gainers or losers. Each row shows turnover in ₹ crore and the % move.