
☰ All tutorials
Start here
Tool tutorialsHow to trade with ChartMineStocks
Stock monitorMy watchlistStock scores & checklistMarket & sectors
Nifty 50Bank NiftySensexFin NiftyDaily market reportMarket breadthSector rotationSector heatmapStock screenerRelative strength (RS)MCX commodity pricesFear & Greed IndexWhat happens after…Scanners
Top gainers & losersStocks to watch tomorrowNR7 stocks scannerInside bar stocks52-week high stocksGap up & gap down stocksRSI oversold stocksGolden cross stocksSuperTrend buy stocksScan builderEMA 9/21 crossoverMACD crossoverADX strong trendBollinger breakout / squeezeVolume spike stocksOpen = high / open = lowCandlestick pattern scannerNarrow CPR scannerF&O data
F&O ban listOI build-upOption chainPCR & max painExpiry calendarF&O lot sizesOI build-up heatmapPCR trendMax pain trendFutures basisStock screens
Quarterly growersProfit growth stocksLow P/E stocksMutual fund buyingNear 52-week low, growingDebt-free companiesHigh ROE & ROCEMagic Formula stocksLow price-to-bookSmart money
FII / DII dataShareholding changesBig-money footprintShort selling dataF&O positions by participantBulk & block dealsPromoter buyingDelivery percentageCalendars
Results calendarQuarterly results trackerBoard meetingsCorporate actionsIPO calendarIPO performanceResearch & planning
Strategy testerCompare stocksDividend yield stocksASM / GSM listExpiry-day movesSeasonality & stock historyNSE holidays 2026Position size calculatorOption payoff calculatorPivot point calculatorMore
Stock scanners hubStock screensHow to use the ADX strong trend stocks scanner
A plain-language tutorial on ADX: how trend strength and direction are measured, how to read the levels, a two-year test on 1,474 NSE stocks, a tour of the scanner’s four tabs and three playbooks with real case studies.
What ADX is, in plain words
Most indicators try to tell you which way a stock is going. ADX answers a different question: is the stock trending at all, and how strongly?
ADX stands for Average Directional Index. J. Welles Wilder, who also created RSI, published it in 1978. It comes as a set of three lines:
- ADX, from 0 to 100: the strength of the trend, whether up or down. A high ADX can mean a strong rise or a strong fall.
- +DI (plus directional indicator): how strong the up-moves have been.
- −DI (minus directional indicator): how strong the down-moves have been.
Put together: ADX tells you how strong the trend is, and the higher of the two DI lines tells you its direction. +DI above −DI with ADX above 25 is read as a strong uptrend; −DI above +DI with ADX above 25, a strong downtrend. ADX below 20 is read as a stock without a clear trend, drifting sideways.
One line to remember: ADX measures how strongly a stock is trending, not where it will go. A high ADX says “this trend is strong right now”, which is useful for choosing a strategy, not for predicting the next move.
The ADX strong trend stocks scanner checks every actively traded NSE stock after each close and lists those with ADX(14) of 25 or more, split by direction, plus stocks whose ADX is rising.
How ADX, +DI and −DI are calculated
ADX takes more steps than most indicators. You do not need to compute it, but each step tells you something about what the final number means. The scanner uses Wilder’s original 14-day method on daily high, low and close, adjusted for splits and bonuses.
- Directional movement. Each day compare today with yesterday. Up-move = today’s high − yesterday’s high. Down-move = yesterday’s low − today’s low. Only the larger of the two counts, and only if it is positive: a larger up-move becomes +DM, a larger down-move becomes −DM. The other is set to zero.
- True range (TR): the day’s full movement, including any gap from yesterday’s close.
- Smooth all three over 14 days with Wilder’s method (each new day counts for roughly 1/14).
- +DI = 100 × smoothed +DM ÷ smoothed TR. −DI = 100 × smoothed −DM ÷ smoothed TR. They show what share of the stock’s recent movement went up and what share went down.
- DX = 100 × (difference between +DI and −DI) ÷ (sum of +DI and −DI). A big gap between the two lines means one side is in control.
- ADX = DX smoothed again over 14 days.
Real example: State Bank of India, 13 Nov 2026
| Value on 13 Nov 2026 | SBIN | What it means |
|---|---|---|
| Close | ₹1,080 (−0.60%) | RSI 72.3, above its 200-DMA (₹1,039.03) |
| +DI | 37.1 | Up-moves dominated recent trading |
| −DI | 5.8 | Down-moves were tiny |
| Today’s DX | about 73 | 100 × (37.1 − 5.8) ÷ (37.1 + 5.8) |
| ADX | 41.4 | The smoothed average of DX: a very strong uptrend, still catching up with today’s DX |
Notice the double smoothing: the DX for the day was about 73, but ADX was 41.4 because it averages DX over many days. That is why ADX is slow. It rises well after a trend has started and falls well after it has ended.
The scanner’s exact rules
- Strong uptrend: ADX 25 or more and +DI above −DI.
- Very strong uptrend: the same with ADX 40 or more.
- Strong downtrend: ADX 25 or more and −DI above +DI.
- Trend strengthening: ADX at least 20 and higher than five sessions earlier, in either direction.
- Stocks need at least 45 sessions of history.
Reading ADX: zones and signals
| ADX level | Common reading | Stocks on 13 Nov 2026 |
|---|---|---|
| Below 20 | No clear trend; a range or a quiet drift | 399 |
| 20 to 25 | Grey zone: a trend may be forming or fading | 311 |
| 25 to 40 | A trending stock | 519 |
| 40 and above | A very strong trend, often well advanced | 75 (49 up, 26 down) |
Signals traders watch
| Signal | What it describes |
|---|---|
| ADX rising from below 20 to above 25 | A new trend getting stronger. The DI lines tell you which way. |
| ADX high and still rising | The trend is accelerating. |
| ADX turning down from a high level | The trend is slowing or pausing. It does not mean the trend has reversed. |
| +DI crossing above −DI | Up-moves taking over from down-moves. Wilder’s original entry signal, best when ADX is also above 20–25. |
| ADX low and flat | A sideways stock. Range methods (buying near support, selling near resistance) suit it better than trend methods. |
A common misunderstanding
A falling ADX in a rising stock does not mean the stock is falling. It means the rise has become less one-sided. For example, a stock can keep inching higher while ADX drops from 50 to 30, simply because the daily moves have become mixed. Always read ADX together with the DI lines and the price.
Why traders use ADX: advantages and limits
✅ Separates trending from sideways
Few indicators do this. It helps you pick the right method for each stock.
✅ Works in both directions
Strong downtrends score as high as strong uptrends, which helps with avoiding falling stocks.
✅ A good filter
Breakout and moving-average setups can be run only on stocks with ADX above 25.
✅ Smooth and stable
Double smoothing means ADX rarely jumps around from day to day.
The limits
- Very slow. The same double smoothing means ADX often confirms a trend after much of it is over.
- High readings often come late. A very high ADX usually appears after a long, one-sided move, when the stock is stretched. SBIN in Feb 2026 (below) is an example.
- No timing signal. ADX does not tell you where to enter or exit.
- Thresholds are rules of thumb. 20, 25 and 40 are conventions, not laws; different stocks trend differently.
- Gaps inflate it. Big gap days add large directional movement in one go.
An honest two-year test of ADX readings
ADX describes a state that lasts weeks, not a one-day event, so we tested it differently from crossovers. Every fifth trading day from 15 Jan 2025 to 9 Nov 2026 we took a snapshot of 1,474 NSE stocks (ChartMine’s current list, adjusted daily prices), sorted them into the scanner’s groups and measured what each stock did next compared with the average stock over the same days. NIFTY rose about 8% over the period, but a typical stock was higher 20 sessions later only 46.9% of the time.
| Group at the snapshot | Observations | Higher after 20 sessions | 20 sessions vs average stock | 60 sessions vs average stock |
|---|---|---|---|---|
| All stocks | 122,285 | 46.9% | −0.03% | −0.06% |
| ADX below 20 (no trend) | 47,977 | 46.4% | −0.15% | −0.51% |
| Strong uptrend (25+, +DI on top) | 26,882 | 45.9% | +0.05% | +0.64% |
| Strong uptrend, above 200-DMA | 14,405 | 46.4% | +0.64% | +2.58% |
| Very strong uptrend (40+) | 5,910 | 48.1% | +0.65% | +2.97% |
| Strong downtrend (25+, −DI on top) | 21,971 | 49.6% | +0.24% | +0.32% |
| Trend strengthening (20+, rising) | 40,561 | 47.5% | +0.14% | +0.28% |
The 200-DMA row starts in Aug 2025, when enough history existed. Snapshots of the same stock a week apart overlap, so treat the differences as indications, not precise measurements.
What the numbers say
- Strong uptrends tended to keep outperforming a little over three months, especially above the 200-DMA (+2.58% versus the average stock over 60 sessions) and at ADX 40+ (+2.97%). This is the clearest positive result in our three indicator tests.
- But it came from a minority of big winners. Fewer than half of the very strong uptrends were higher after 20 sessions (48.1%), and the median one still trailed the average stock. Most of these stocks did nothing special; a few ran a long way.
- Strong downtrends did not keep falling on average. They were slightly ahead of the average stock, and the next day 55.6% of them closed higher: falling stocks often bounce. Below the 200-DMA, though, they trailed by 1.03% over 60 sessions.
- No-trend stocks (ADX under 20) lagged slightly, by 0.51% over 60 sessions.
- A fresh cross of ADX above 25 in an uptrend (5,561 cases) was not a useful entry signal: 44.9% higher after 20 sessions.
- Trending stocks did not move much more. The typical 20-session move, up or down, was 6.84% with ADX at 25+ and 6.31% with ADX under 20.
What this means: ADX was more useful as a filter (prefer strong uptrends above the 200-DMA, be careful shorting strong downtrends) than as a trigger. The edge, where it existed, was small and depended on catching the few long runs while cutting the many flat ones. The test uses today’s stock list, so delisted stocks are missing, which flatters the results slightly.
A tour of the scanner screen
Open the ADX strong trend stocks scanner. This page has four tabs, and unlike ChartMine’s crossover scanners, every tab is sorted by ADX, strongest first.

- 1Scan for: pick a scan date; the latest is first.
- 2Strong uptrend: ADX 25+, +DI above −DI.
- 3Very strong uptrend: ADX 40+, +DI above −DI.
- 4Strong downtrend: ADX 25+, −DI above +DI.
- 5Trend strengthening: ADX 20+ and higher than five sessions ago, either direction.
On the scan of 13 Nov 2026: 404 stocks in a strong uptrend, 49 of them very strong (ADX 40+), 188 in a strong downtrend and 424 with a strengthening trend. More than twice as many strong uptrends as downtrends fits a market that had just rallied from its late-October low.
The “Very strong uptrend” tab
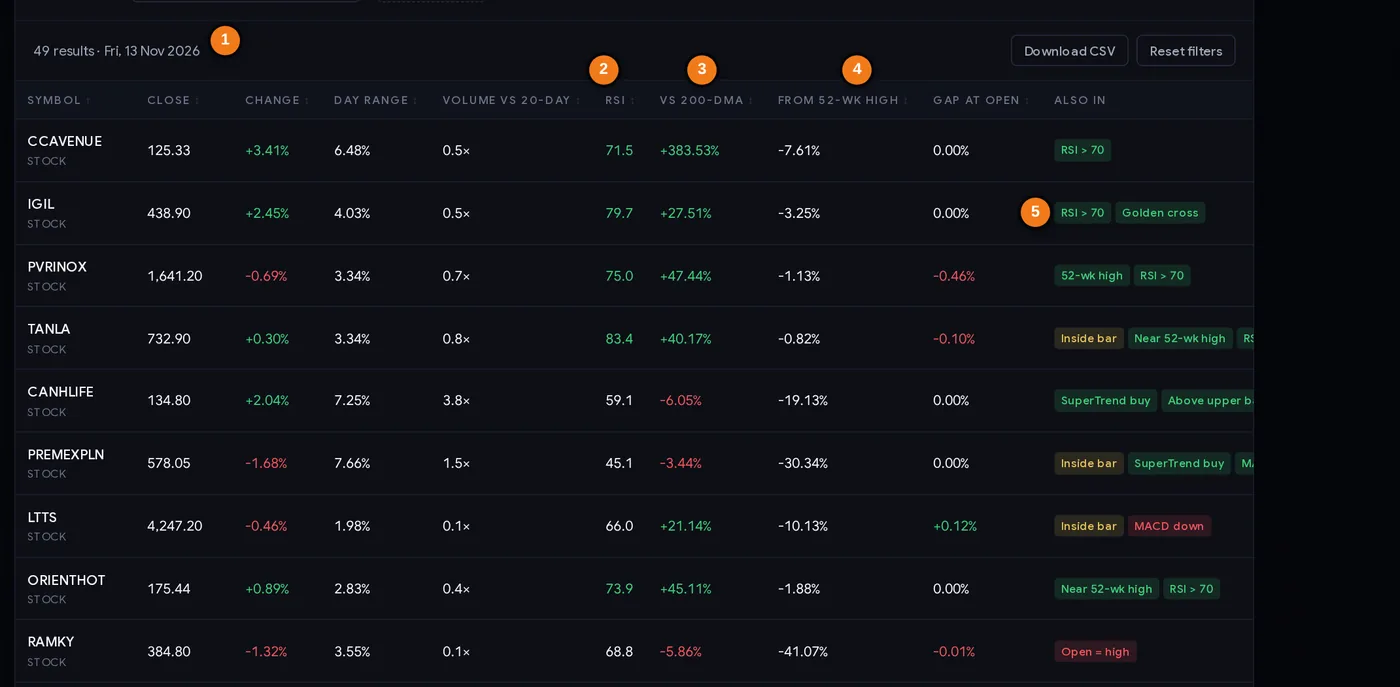
- 1Result count and scan date
- 2RSI (14): often above 70 in strong trends
- 3Distance from the 200-day average
- 4Distance from the 52-week high
- 5Other scans the stock matched that day
The table is sorted by ADX, but the ADX, +DI and −DI values themselves are not shown in the table or in the Download CSV file. Add ADX (14) with its DI lines to your chart to see them. The columns you do see:
| Column | How to use it with ADX |
|---|---|
| Close / Change | The close and the day’s % change. |
| Day range | (High − Low) ÷ Close. |
| Volume vs 20-day | Many strong trends move on ordinary volume; a spike late in a trend can mark a climax. |
| RSI | Very strong uptrends often show RSI above 70. That is normal in a strong trend, but it tells you the stock is stretched. |
| vs 200-DMA | How far the trend has carried the stock from its long-term average. 40–50% above it means a mature trend. |
| From 52-wk high | Strong uptrends usually sit close to their highs; strong downtrends far below. |
| Gap at open | The opening gap that day. |
| Also in | Other scans matched, such as 52-wk high, RSI > 70, inside bar, or MACD up or down. The page’s own ADX flags are left out here because the tabs already show them. |
If a number looks implausible, such as a stock several hundred per cent above its 200-DMA, open the chart before drawing conclusions: a corporate action or a long trading gap can distort the averages.
The “Strong downtrend” tab
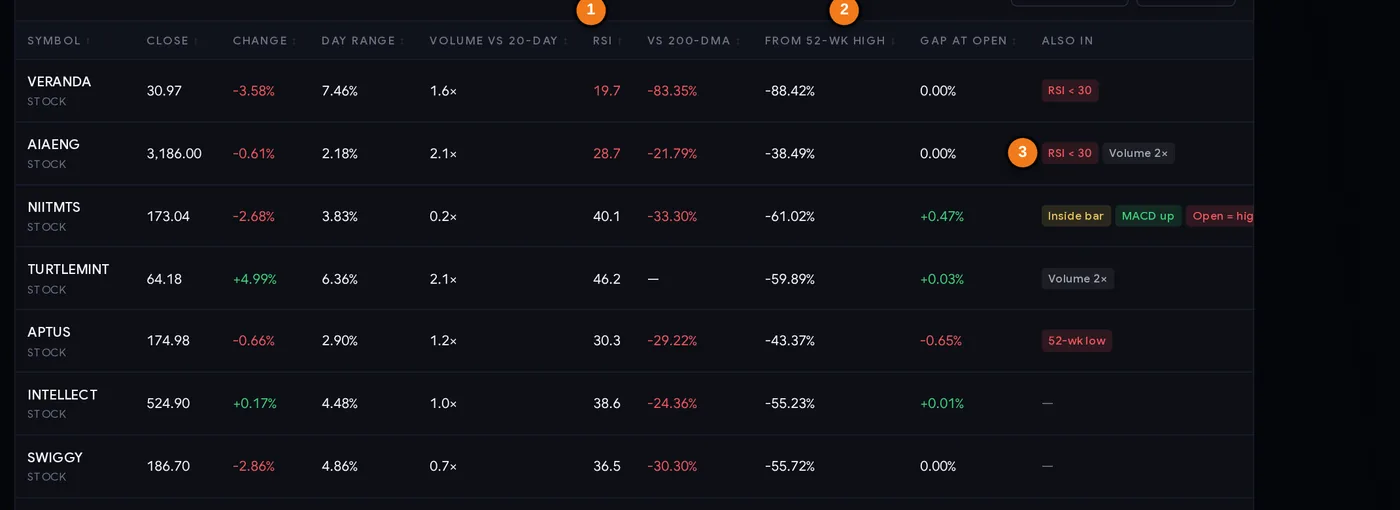
- 1RSI (14): many strong downtrends are near oversold
- 2Distance from the 52-week high
- 3Other scans matched, such as RSI < 30, Volume 2× or 52-wk low
The same columns, for stocks where −DI leads. Look at the RSI and 52-week columns: many of these stocks are already far below their highs and near oversold levels. Our test found that strong downtrends bounced more often than they continued in the following days, which is why this list is better used to avoid stocks than to short them.
Filters
The filters are shared with ChartMine’s other scanners: Show (stocks only here), Today, Trend (200-, 50- or 20-day average), Combine with (NR7, inside bar, 52-week high or low, gaps), and under More filters, RSI, volume, price band and sector (NSE index lists). Useful combinations for ADX: “Strong uptrend” + “Above 200-DMA”; “Trend strengthening” + “Closed up”; “Strong uptrend” + “Inside bar” for a strong stock taking a pause.
Step by step: using ADX to pick your method
ADX works best at the start of your process, to decide which kind of trade fits a stock, before you look for an entry.
- After about 8 PM IST, read the four counts. Many strong uptrends and few downtrends means a broad rally; the reverse, a broad decline.
- Open “Strong uptrend” and set Trend to “Above 200-DMA”. This was the group with the best follow-through in our test.
- Sort out the stretched names. RSI above 75 and a close 40%+ above the 200-DMA mean you are late; such stocks need a pullback before a sensible entry exists.
- Open the chart with ADX (14), +DI and −DI. Is ADX still rising, or turning down from a peak? Rising means the trend is accelerating; turning down means it is pausing.
- Apply your entry method only to these stocks: a breakout from a short consolidation, or a pullback to a moving average. ADX picks the field; your setup picks the moment.
- Check events: results and board meetings.
- Size from your stop with the position size calculator.
- Review the “Strong downtrend” list for your holdings. If you own something on it, check your reasons for holding.
Three playbooks
Playbook A: ADX as a trend filter
- Only consider stocks with ADX 25+, +DI above −DI and a close above the 200-DMA.
- Wait for a pause: an inside bar, a few quiet days, or a pullback toward the 20-day average.
- Enter when the price breaks out of the pause; stop below the pause’s low.
- Trail the stop under higher lows while ADX stays above 25. Our test suggests patience matters here: the gains came over 60 sessions, not 5.
Playbook B: catching a trend as it strengthens
- “Trend strengthening” tab, filtered to “Closed up”, and on the chart ADX climbing from below 20 with +DI crossing above −DI.
- Entry on a close above a recent range; stop below the range.
- This catches trends earlier than Playbook A but fails more often, because many young trends fade back below 20. Keep the size small.
Playbook C: very high ADX as a caution flag
When ADX is above 45–50, the trend is strong but usually mature. Holders often tighten the trailing stop rather than add more; new buyers wait for ADX to cool and the price to pull back. When ADX turns down from a high level, many traders book part of the profit. In a strong downtrend the same logic applies in reverse: a very high ADX after a long fall makes fresh shorts risky, because sharp bounces are common.
A note on downtrends: ordinary investors cannot carry a short position overnight in the cash market; that needs futures or options, which carry their own risks. For most readers, the downtrend list is a list to avoid or to review holdings against.
Case studies from 2026
ADX values from ChartMine’s scan data and our rebuild of it; prices in ₹ from NSE’s daily files, adjusted for splits and bonuses.
1. State Bank of India: the same reading, opposite outcomes
On 16 Jan 2026 SBIN’s ADX crossed above 40 with +DI at 37.7 and −DI at 9.0, at ₹1,042.30. Twenty sessions later the stock was 15.0% higher. On 16 Feb 2026 ADX crossed 40 again (40.2, +DI 44.0) at ₹1,208.10, after the rally. This time SBIN was 11.9% lower twenty sessions later and 21.5% lower after sixty. By 30 Mar ADX was back above 40, but with −DI on top (42.5 against 13.7) at ₹979.40: a strong downtrend. On 13 Nov 2026 SBIN was again a very strong uptrend (ADX 41.4) at ₹1,080. The same number described very different moments, which is why ADX cannot be used as a timing signal.
2. PVR INOX: a trend that paused, then resumed
PVR INOX’s ADX reached about 56 in late August 2026 (56.1 on 26 Aug, close ₹1,255.30). The price then slipped to ₹1,169.20 by 9 Sep, and ADX fell to 26.2 by 1 Oct: the trend had paused, though it had not turned into a downtrend. ADX started rising again in October, and on 13 Nov it stood at 57.7 with +DI 32.8 and −DI only 5.0, the stock at ₹1,641.20, a new 52-week high, RSI 75.0. A falling ADX in September meant “pause”, not “sell”.
3. AIA Engineering: a downtrend gathering strength
On 9 Sep 2026 AIA Engineering’s ADX was 15.4 at ₹4,172.10: no clear trend. By 13 Nov ADX had climbed to 53.6, with −DI at 32.3 and +DI at only 5.2, and the stock was at ₹3,186, 38.49% below its 52-week high, RSI 28.7, on 2.1× normal volume. The rising ADX told holders, week after week, that the decline was getting stronger, not weaker. It still does not mark the bottom.
4. Swiggy: when ADX turns down in a downtrend
Swiggy’s ADX rose from 11.3 on 24 Sep 2026 (₹267.40) to 50.1 on 8 Nov (₹192.30). By 13 Nov it had eased to 45.4 at ₹186.70, with −DI (28.8) still above +DI (15.4). The stock was still falling, but the fall had become less one-sided. A turning ADX in a downtrend means “slowing”, not “reversing”.
5. L&T Technology Services, 13 Nov 2026: a strong trend taking a breath
LTTS had ADX 50.1 with +DI 26.5 and −DI 9.8, closing at ₹4,247.20, but the day was an inside bar on only 0.12× normal volume and MACD had crossed bearish two sessions earlier. In October its ADX had been as low as 13.7. A very strong trend with momentum cooling is exactly the situation where Playbook C suggests caution about new entries.
Common mistakes
- Reading a high ADX as bullish. ADX measures strength in either direction; check +DI and −DI.
- Reading a falling ADX as bearish. It means the trend is slowing, not reversing (PVR INOX, Sep 2026).
- Buying because ADX is very high. Very high ADX often comes late in a move (SBIN, Feb 2026).
- Shorting strong downtrends blindly. In our test they bounced more often than not over the next day.
- Forgetting that “Trend strengthening” includes downtrends. Filter by “Closed up” or check the DI lines.
- Using ADX for timing. It picks the field; it does not tell you when to enter.
- Mixing settings. ADX(14) with Wilder smoothing is standard; other periods or smoothing give different values.
- Skipping the stop. Strong trends end suddenly too, often on news or results.
Pre-trade checklist
- Latest scan date; the four tab counts noted.
- Direction confirmed: +DI above −DI for an uptrend idea.
- ADX 25 or more; still rising, or turning down (pause)?
- Close above the 200-DMA; RSI and distance from the 200-DMA not extreme.
- A separate entry setup found on the chart (breakout or pullback).
- Stop below the setup’s low; position size from that stop.
- No results or board meeting before the planned exit.
- Exit plan: trailing stop under higher lows; caution when ADX turns down from a high.
Glossary
| ADX | Average Directional Index: trend strength from 0 to 100, regardless of direction. |
| +DI / −DI | Directional indicators: the share of recent movement that went up (+DI) or down (−DI). |
| +DM / −DM | Directional movement: the day’s up-move or down-move, whichever is larger. |
| DX | Directional index for one day: the gap between +DI and −DI as a share of their sum. |
| True range (TR) | The day’s full movement including any gap from the previous close. |
| Wilder smoothing | A running average where each new day counts for about 1/14. |
| Trend filter | A rule that decides which stocks you trade, before the entry rule decides when. |
| Range-bound | A stock moving sideways between support and resistance, usually with ADX under 20. |
| 200-DMA | The 200-day simple average of closes, a long-term trend line. |
Questions
What does ADX tell you about a stock?
ADX shows how strong a stock’s trend is, on a scale of 0 to 100, without saying which way. The +DI and −DI lines give the direction: +DI above −DI is an uptrend, −DI above +DI a downtrend.
What is a good ADX value?
Above 25 is commonly read as a trending stock and above 40 as a very strong trend; below 20 suggests no clear trend. These are conventions, not fixed rules.
Is a high ADX bullish or bearish?
Neither by itself. A high ADX can come with a strong rise or a strong fall. Check which DI line is on top, and remember that very high readings often appear late in a move.
What does a falling ADX mean?
The trend is losing strength or pausing. It does not mean the price has reversed; a stock can keep rising slowly while ADX falls.
Does ADX work for stock selection?
In ChartMine’s two-year test on 1,474 NSE stocks, strong uptrends above the 200-day average beat the average stock by about 2.6% over the next 60 sessions, but fewer than half were higher after 20 sessions. It worked better as a filter than as an entry signal.
What is the difference between ADX and RSI?
RSI measures how one-sided recent closes have been (momentum and overbought/oversold), while ADX measures how strong and persistent the trend is. Both were created by J. Welles Wilder.
Which ADX setting does the scanner use?
ADX (14) with Wilder smoothing on daily high, low and close prices from NSE, adjusted for splits and bonuses.