
☰ All tutorials
Start here
Tool tutorialsHow to trade with ChartMineStocks
Stock monitorMy watchlistStock scores & checklistMarket & sectors
Nifty 50Bank NiftySensexFin NiftyDaily market reportMarket breadthSector rotationSector heatmapStock screenerRelative strength (RS)MCX commodity pricesFear & Greed IndexWhat happens after…Scanners
Top gainers & losersStocks to watch tomorrowNR7 stocks scannerInside bar stocks52-week high stocksGap up & gap down stocksRSI oversold stocksGolden cross stocksSuperTrend buy stocksScan builderEMA 9/21 crossoverMACD crossoverADX strong trendBollinger breakout / squeezeVolume spike stocksOpen = high / open = lowCandlestick pattern scannerNarrow CPR scannerF&O data
F&O ban listOI build-upOption chainPCR & max painExpiry calendarF&O lot sizesOI build-up heatmapPCR trendMax pain trendFutures basisStock screens
Quarterly growersProfit growth stocksLow P/E stocksMutual fund buyingNear 52-week low, growingDebt-free companiesHigh ROE & ROCEMagic Formula stocksLow price-to-bookSmart money
FII / DII dataShareholding changesBig-money footprintShort selling dataF&O positions by participantBulk & block dealsPromoter buyingDelivery percentageCalendars
Results calendarQuarterly results trackerBoard meetingsCorporate actionsIPO calendarIPO performanceResearch & planning
Strategy testerCompare stocksDividend yield stocksASM / GSM listExpiry-day movesSeasonality & stock historyNSE holidays 2026Position size calculatorOption payoff calculatorPivot point calculatorMore
Stock scanners hubStock screensHow to use the Fin Nifty page
A plain-language tutorial on ChartMine’s Fin Nifty page: what the Nifty Financial Services index holds, how it differs from Bank Nifty, what each number means, its monthly F&O expiry and lot size, and real case studies from 2012 to 2026.
What Fin Nifty is, in plain words
Fin Nifty is the short name of the Nifty Financial Services index. It is one number that tracks India’s large listed money businesses: not just banks, but also lending companies (NBFCs), housing finance firms, insurers and even a stock exchange. When these companies rise together, Fin Nifty rises; when they fall, it falls.
It is run by NSE Indices and has a base of 1,000 points on 1 January 2004. On 13 November 2026 it closed at 27,855.50, so the basket is worth about 28 times its base value, in price terms, without dividends.
ChartMine’s Fin Nifty page shows on one screen:
- the latest end-of-day close and the day’s change;
- the all-time high and the record close, with the gap from each;
- the 52-week range;
- a chart from 1 month to the full history since February 2012;
- returns from 1 week to 10 years;
- a year-by-year table since 2012 and a free CSV download;
- a market today panel with Fin Nifty’s PCR, max pain, nearest expiry and option chain, plus FII/DII flows and breadth.
One line to remember: Fin Nifty is the report card of India’s whole financial sector. Bank Nifty is only the banks.
The page is not live. It is rebuilt after each session from NSE’s end-of-day files. The label under the title names the session; on 14 November 2026 it read “data for the trading session of Fri 13 Nov 2026”.
What is inside Fin Nifty, and what the numbers mean
NSE’s constituent list for Nifty Financial Services, downloaded on 14 November 2026, has 20 companies. Grouped by business:
| Group | Companies (NSE symbol) | Count |
|---|---|---|
| Banks | HDFCBANK, ICICIBANK, SBIN, AXISBANK, KOTAKBANK | 5 |
| NBFCs, housing and government lenders, card company, holding company | BAJFINANCE, BAJAJFINSV, CHOLAFIN, SHRIRAMFIN, MUTHOOTFIN, JIOFIN, LICHSGFIN, PFC, RECLTD, SBICARD | 10 |
| Insurance (life and general) and insurance holding | HDFCLIFE, SBILIFE, ICICIGI, MFSL | 4 |
| Exchange | BSE | 1 |
An NBFC (non-banking financial company) lends money but is not a bank: it cannot take ordinary savings deposits the way a bank does. Examples are consumer lenders, vehicle financiers and gold-loan companies. Bank Nifty has none of these; Fin Nifty has ten.
The numbers on the page
| Term | Meaning | Fin Nifty on 13 Nov 2026 |
|---|---|---|
| Close | Official level at the end of the session | 27,855.50 (−0.72%) |
| Day’s range | Lowest to highest level of the day | 27,683.25 to 27,940.40 |
| All-time high (intraday) | Highest level ever traded | 28,562.50 on 23 Feb 2026 |
| Record close | Highest closing level ever | 28,463.25 on 18 Feb 2026 |
| From all-time high | % below the high, and sessions since | −2.48%, 178 sessions |
| 52-week range | One-year intraday high and low | 28,562.50 (23 Feb 2026) to 23,373.95 (2 Apr 2026) |
| Returns | Price change between two dates, no dividends | 1 year +1.7%; 10 years +254.3% (13.5% a year) |
Note one detail of 13 Nov 2026: the index opened at 27,940.40, which was also the day’s high. It fell from the first minute and closed 0.72% lower. Reading the OHLC legend on the chart shows such details.
Fin Nifty vs Bank Nifty: how they differ
The two indices are cousins. The big private and public banks are in both, so they often move together. But the extra NBFCs, insurers and BSE make Fin Nifty behave differently at times.
| Fin Nifty | Bank Nifty | |
|---|---|---|
| What it holds | Banks, NBFCs, insurers, an exchange (20 stocks) | Banks only |
| Close on 13 Nov 2026 | 27,855.50 | 61,034.10 |
| 2026 so far | +0.9% | +2.4% |
| 1 year | +1.7% | +4.5% |
| 5 years | +46.8% | +57.6% |
| 10 years | +254.3% | +209.2% |
| F&O lot size (Nov 2026) | 60 | 30 |
| Options expiry | Monthly, last Tuesday | Monthly, last Tuesday |
Over 10 years Fin Nifty beat Bank Nifty by a wide margin, but over 5 years and in 2026 Bank Nifty did better. Which one “wins” depends entirely on the period, so never pick one from a single return box.
How closely do they move?
In the 250 sessions to 13 Nov 2026 the correlation of daily returns was 0.96 between Fin Nifty and Bank Nifty, and 0.92 between Fin Nifty and NIFTY 50. They closed in the same direction as Bank Nifty on 89.6% of days. So on roughly one day in ten, they went opposite ways.
Which is more volatile?
Over the same 250 sessions, Fin Nifty moved more than 1% on 30.8% of days, Bank Nifty on 26.0% and NIFTY 50 on 22.8%. Its average daily move was 0.84%, against 0.78% for Bank Nifty and 0.68% for NIFTY 50. In this recent stretch, Fin Nifty was the jumpiest of the three.
Why Fin Nifty matters: advantages and limits
Whole-sector view
Credit growth, interest rates, insurance demand and capital-market activity all show up in one number.
Fair benchmark
If you hold NBFCs or insurers, Bank Nifty is the wrong yardstick. Fin Nifty includes them.
Live F&O underlying
Fin Nifty futures and monthly options trade on NSE. The page shows their PCR, max pain and option chain.
Long history
Daily data since 27 Feb 2012: 3,645 rows on 13 Nov 2026, covering the 2013, 2016 and 2020 falls.
Limits you should know
- Still bank-heavy. Five banks are among the 20 companies and the largest banks carry big weights, so a bad day for banks usually drags Fin Nifty too.
- Only 20 stocks. One heavyweight’s quarterly results can move the index.
- Sensitive to policy news. RBI decisions, rules on lending and insurance, and election outcomes hit financials hard: on 4 Jun 2024 Fin Nifty fell 7.86% against 5.93% for NIFTY 50.
- Monthly options only. One expiry a month means long gaps between expiry dates, unlike NIFTY’s weekly cycle.
- End of day and backward-looking. No live prices, no forecasts.
A tour of the Fin Nifty page
Open the Fin Nifty page. The top strip has four boxes.

- 1Last close and the day’s change
- 2All-time high (intraday) and its date
- 3Distance from the all-time high and sessions since
- 452-week high and low with dates
| Box | What it shows | How to read it |
|---|---|---|
| Close on <date> | Latest end-of-day close and % change | Check the date first, especially after holidays. |
| All-time high | Highest intraday level ever, with its date | 23 Feb 2026 for Fin Nifty. |
| From all-time high | Gap from the high and sessions since | −2.48% on 13 Nov 2026: close to the top. |
| 52-week range | One-year high and low with dates | The low was 2 Apr 2026, after the March fall. |
Chart and all-time high block
The chart opens on 6M. 1M to 1Y show daily candlesticks from 26 Aug 2025; 5Y, 10Y and All show weekly closes since 27 Feb 2012. Hover to see each day’s open, high, low and close. Below the chart, four boxes repeat the intraday high, the record close (28,463.25 on 18 Feb 2026), the gap from the record close (−2.14%) and the points needed to reach the high (707.00).
Returns

- 1Short periods show the % change and the starting level
- 21-year price return
- 3Longer periods also show the compounded rate a year
Seven boxes: 1 week, 1 month, 3 months, 1 year, 3, 5 and 10 years. On 13 Nov 2026 they read +2.1%, +10.4%, +5.8%, +1.7%, +42.5%, +46.8% and +254.3%. Long periods also show the yearly rate. The line under them says Fin Nifty is up 579% since 27 Feb 2012 (4,100.60), about 13.9% a year, without dividends.
Historical data and CSV
One row per year since 2012 with year-end close, return, highest and lowest close. The record-close year (2026) is highlighted. The Download button gives the daily open and close of every session.
Market today
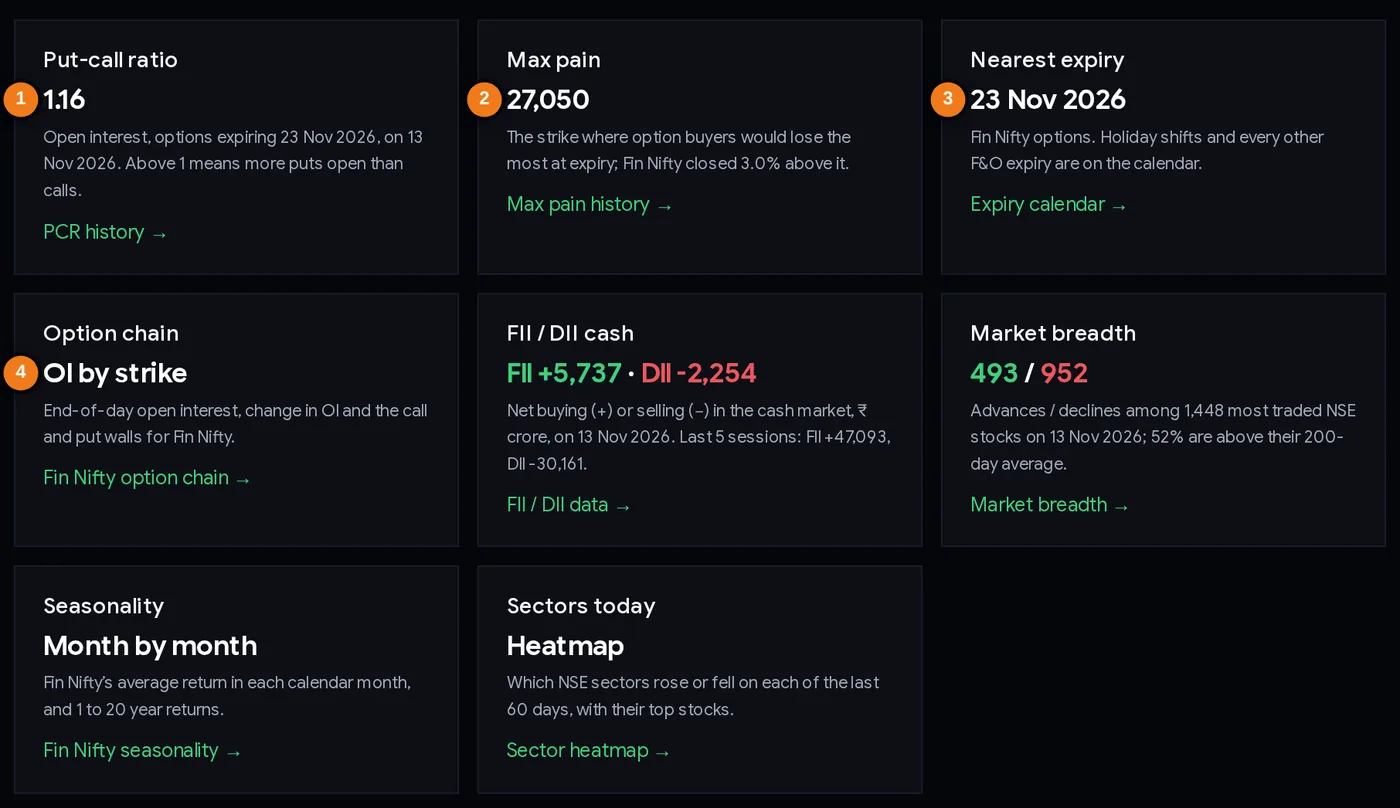
- 1Put-call ratio for the nearest monthly expiry
- 2Max pain and the distance of the close from it
- 3Nearest Fin Nifty expiry date
- 4Link to the Fin Nifty option chain
| Card | What it shows (13 Nov 2026) | Go deeper |
|---|---|---|
| Put-call ratio | 1.16 for options expiring 23 Nov 2026: more puts open than calls | PCR history |
| Max pain | 27,050; Fin Nifty closed 3.0% above it | Max pain history |
| Nearest expiry | 23 Nov 2026 | Expiry calendar |
| Option chain | Open interest by strike, call and put walls | Fin Nifty option chain |
| FII / DII cash | FII +₹5,737 crore, DII −₹2,254 crore | FII DII data |
| Market breadth | 493 advances, 952 declines | Market breadth |
Seasonality and sector heatmap cards follow, then Go deeper links to Fin Nifty on Budget day, RBI policy days and Muhurat trading, and to the futures premium and expiry-day moves tools.
Fin Nifty F&O today: monthly expiry, lot size, PCR
Fin Nifty futures and options are still listed on NSE. Here is their status from ChartMine’s own calendar and lot-size data, as of 13-14 Nov 2026:
| Item | Status | Why it matters |
|---|---|---|
| Expiry type | Monthly only. ChartMine’s 2026 calendar lists one Fin Nifty expiry per month and no weekly ones. | Older articles describe weekly Fin Nifty options. Check the calendar, not old blog posts. |
| Expiry day | Last Tuesday of the month. November 2026: Monday 23 Nov, moved from Tuesday 24 Nov (Guru Nanak Jayanti holiday). | The same day as Bank Nifty, Midcap NIFTY and stock F&O. NIFTY alone has weekly Tuesday expiries. |
| Lot size | 60 units for the Nov 2026, Dec 2026 and Jan 2027 contracts | At 27,855.50, one lot controls about ₹16.7 lakh of index value. See F&O lot size. |
| PCR | 1.16 (23 Nov expiry) | Many option writers sell puts, so a high PCR is not simply “bullish”. Read the PCR and max pain tutorial. |
| Max pain | 27,050, 3.0% below the close | Shows where open interest is concentrated, not where the index must close. |
What happened on Fin Nifty expiry days in 2026
We checked all ten monthly expiries from January to October 2026. Nine of them closed within ±0.9% of the previous day. The exception was Monday 30 March 2026 (moved from Tuesday 31 March for Mahavir Jayanti), when Fin Nifty fell 3.49% to 23,521.80, its lowest close of 2026. Bank Nifty fell 3.82% the same day, so it was a broad sell-off in financials during the March fall, not an expiry quirk. Ten expiries is too few to prove any pattern either way.
A 2% move on one lot of 60 at about 27,850 is roughly ₹33,400. Know this number before trading, use a stop loss, and size the trade with the position size calculator. Most option buyers lose money; options are leveraged products.
Step-by-step: reading Fin Nifty in five minutes
- Check the session date under the title.
- Read the close and change. With 30.8% of recent days moving over 1%, a 1% Fin Nifty day is ordinary; 2% is a big day.
- Compare with Bank Nifty and NIFTY 50. Open the Bank Nifty page. If Fin Nifty is up and Bank Nifty flat, the NBFCs or insurers did the work. On 12 Nov 2026 Fin Nifty rose 1.42% while NIFTY 50 rose only 0.18%.
- Place it in the range. On 13 Nov 2026 Fin Nifty was 2.5% below its 52-week high and 19.2% above its low: near the top of its year.
- Look at 1Y and 10Y on the chart to separate a short swing from the long trend.
- If you trade options, read Market today. Note days to expiry, PCR and max pain, then open the option chain for the call and put walls.
- Write one line in your journal: “Fin Nifty 2.5% below high, +10.4% in a month, PCR 1.16, monthly expiry Mon 23 Nov.”
How traders and investors use the page: three playbooks
1. Sector investor: choose the right yardstick
If your portfolio holds lenders and insurers, compare it with Fin Nifty, not NIFTY 50 or Bank Nifty. Use the yearly table: Fin Nifty ended 11 of 13 full years from 2013 to 2025 higher, with falls in 2013 (−7.3%) and 2015 (−5.4%). Its 10-year rate to 13 Nov 2026 was 13.5% a year; its 5-year rate, 8.0%. That spread shows how much the result depends on when you start.
2. Swing trader: spot leadership inside financials
When Fin Nifty and Bank Nifty diverge, it tells you which part of finance is leading. In 2019 Fin Nifty rose 25.6% while Bank Nifty rose 18.4%; in 2022 Bank Nifty rose 21.2% and Fin Nifty only 9.5%. Traders check the sector heatmap and sector rotation to see which stocks are behind such gaps, and stay careful with fresh positions when the index is falling steadily.
3. Monthly options trader: one expiry, more planning
With one expiry a month, Fin Nifty option positions are usually held longer than weekly NIFTY ones. Traders note the expiry (23 Nov 2026), the lot size (60) and the money at risk per lot, then look at where open interest sits on the option chain. PCR and max pain describe positioning; they do not predict the close.
Case studies from real data
All numbers are from ChartMine’s Fin Nifty data (NSE end-of-day closes since 27 Feb 2012). They describe the past, not the future.
Case 1: a record in February 2026, a 17% slide, then a return near the top
Fin Nifty made its record close of 28,463.25 on 18 Feb 2026 and its intraday high of 28,562.50 on 23 Feb. In March it fell hard: from 27,869.75 at the end of February to 23,521.80 on 30 March, a fall of 15.6% in a month (Bank Nifty −16.9%, NIFTY 50 −11.3% over the same dates). The lowest point was 23,373.95 intraday on 2 April. By 13 November 2026 it was back at 27,855.50, only 2.1% below the record close. Lesson: financials fall faster than the market in a sell-off, and can also recover faster. That cuts both ways for leveraged traders.
Case 2: the late-October 2026 rally
From 24,712.20 on 30 October to 27,855.50 on 13 November, Fin Nifty rose 12.7%, more than Bank Nifty (+11.6%) and NIFTY 50 (+9.1%). The biggest days were 5 November (+3.99%) and 6 November (+2.57%). FIIs were net buyers in the cash market, +₹47,093 crore in the five sessions to 13 Nov (from the FII/DII card). Lesson: when money flows back into Indian equities, financials often lead, but the same index fell 15.6% in March.
Case 3: how deep the falls went
Falls of more than 20% from a record close since 2012, on daily closes:
| Record close | Bottom | Fall | New record close |
|---|---|---|---|
| 17 May 2013 | 28 Aug 2013 | −31.7% | 9 May 2014 |
| 28 Jan 2015 | 25 Feb 2016 | −31.2% | 6 Sep 2016 |
| 2 Jan 2020 | 23 Mar 2020 | −43.5% | 16 Dec 2020 |
| 26 Oct 2021 | 16 Jun 2022 | −23.7% | 27 Jun 2023 |
The worst single day was 23 March 2020 (−15.94%). On 4 June 2024, election results day, Fin Nifty fell 7.86% in one session. Lesson: a fall of 20-45% has happened four times in 14 years. Position sizes and stop losses must assume it can happen again.
Common mistakes
- Treating Fin Nifty as Bank Nifty. It holds NBFCs, insurers and BSE too. Returns differed widely: 2022 was +9.5% vs +21.2%.
- Assuming weekly expiries. In 2026 Fin Nifty options expire monthly, on the last Tuesday (or the day before a holiday).
- Using the wrong lot size. Fin Nifty’s lot is 60, Bank Nifty’s 30, for the Nov 2026 contracts. Lot sizes change; check the lot size page.
- Reading PCR 1.16 as a buy signal. PCR shows positioning, not direction.
- Forgetting the higher volatility. Over 1% moves on 30.8% of recent days means stops get hit more often if set too tight.
- Treating the page as live. It is end of day.
- Picking an index from one return box. Fin Nifty led over 10 years; Bank Nifty led over 5.
Checklist before you trade or invest using Fin Nifty data
- I checked the session date.
- I know Fin Nifty includes banks, NBFCs, insurers and BSE, not only banks.
- I compared today’s move with Bank Nifty and NIFTY 50.
- I placed the close in the 52-week range and against the all-time high.
- I looked at the chart on 1Y and 10Y.
- If I trade F&O: I know the monthly expiry date, the lot size (60 for Nov 2026) and the loss on a 2% move.
- I read PCR and max pain as positioning, not prediction.
- I set my stop loss and position size before entering.
Glossary
| Term | Meaning |
|---|---|
| Fin Nifty | Nifty Financial Services index: 20 large financial companies on NSE; base 1,000 on 1 Jan 2004. |
| Bank Nifty | Nifty Bank index: large bank stocks only. |
| NBFC | Non-banking financial company: lends money but is not a bank. |
| Insurer | A company that sells life or general insurance. |
| Constituent | A company included in the index. |
| All-time high | Highest level ever traded during a session. |
| Record close | Highest closing level ever. |
| Correlation | How closely two series move together; 1 means in perfect step. |
| Volatility | How big the price swings are. |
| Monthly expiry | The last day a monthly futures or options contract trades. |
| Lot size | The number of units in one F&O contract. |
| PCR | Put-call ratio: open puts ÷ open calls. |
| Max pain | The strike at which option buyers as a group lose the most at expiry. |
| Open interest (OI) | The number of F&O contracts still open. |
| FII / DII | Foreign / domestic institutional investors. |
| Price return | Return from the index level only, without dividends. |
Questions
What is the difference between Fin Nifty and Bank Nifty?
Bank Nifty holds only banks. Fin Nifty (Nifty Financial Services) holds 20 financial companies: 5 banks plus NBFCs, housing and government lenders, insurers and BSE. Their daily returns had a correlation of 0.96 in the year to 13 November 2026, but yearly returns can differ a lot.
Is Fin Nifty expiry weekly or monthly?
Monthly. ChartMine’s 2026 expiry calendar lists one Fin Nifty expiry each month, on the last Tuesday, moved to the previous trading day for holidays. The November 2026 expiry is Monday 23 November.
What is the Fin Nifty lot size?
60 units for the November 2026, December 2026 and January 2027 contracts, per ChartMine’s F&O lot size page. NSE revises lot sizes from time to time, so check before you trade.
What is Fin Nifty’s all-time high?
28,562.50, traded on 23 February 2026. Its highest close is 28,463.25 on 18 February 2026. On 13 November 2026 it closed at 27,855.50, 2.48% below the all-time high.
Which companies are in Fin Nifty?
NSE’s list on 14 November 2026 has 20: HDFC Bank, ICICI Bank, SBI, Axis Bank, Kotak Bank, Bajaj Finance, Bajaj Finserv, Cholamandalam, Shriram Finance, Muthoot Finance, Jio Financial, LIC Housing Finance, PFC, REC, SBI Cards, HDFC Life, SBI Life, ICICI Lombard, Max Financial and BSE.
How much has Fin Nifty returned in 10 years?
From 7,861.80 on 11 November 2016 to 27,855.50 on 13 November 2026 it rose 254.3%, about 13.5% a year, in price terms without dividends. Past returns do not predict future returns.
Is the Fin Nifty page advice to trade?
No. It is an education and research page with end-of-day data. ChartMine is not a SEBI-registered adviser. Use it for context and always plan risk with a stop loss.