
☰ All tutorials
Start here
Tool tutorialsHow to trade with ChartMineStocks
Stock monitorMy watchlistStock scores & checklistMarket & sectors
Nifty 50Bank NiftySensexFin NiftyDaily market reportMarket breadthSector rotationSector heatmapStock screenerRelative strength (RS)MCX commodity pricesFear & Greed IndexWhat happens after…Scanners
Top gainers & losersStocks to watch tomorrowNR7 stocks scannerInside bar stocks52-week high stocksGap up & gap down stocksRSI oversold stocksGolden cross stocksSuperTrend buy stocksScan builderEMA 9/21 crossoverMACD crossoverADX strong trendBollinger breakout / squeezeVolume spike stocksOpen = high / open = lowCandlestick pattern scannerNarrow CPR scannerF&O data
F&O ban listOI build-upOption chainPCR & max painExpiry calendarF&O lot sizesOI build-up heatmapPCR trendMax pain trendFutures basisStock screens
Quarterly growersProfit growth stocksLow P/E stocksMutual fund buyingNear 52-week low, growingDebt-free companiesHigh ROE & ROCEMagic Formula stocksLow price-to-bookSmart money
FII / DII dataShareholding changesBig-money footprintShort selling dataF&O positions by participantBulk & block dealsPromoter buyingDelivery percentageCalendars
Results calendarQuarterly results trackerBoard meetingsCorporate actionsIPO calendarIPO performanceResearch & planning
Strategy testerCompare stocksDividend yield stocksASM / GSM listExpiry-day movesSeasonality & stock historyNSE holidays 2026Position size calculatorOption payoff calculatorPivot point calculatorMore
Stock scanners hubStock screensHow to use the top gainers and losers page
A plain-language guide to the day’s biggest NSE movers: how the gainers, losers, volume gainers and NIFTY 50 lists are built, how to read turnover, volume and delivery, what a year of data says about buying yesterday’s winners, and the traps (bonus issues, price bands, thin trading) that fool beginners.
What the top gainers and losers page is
Every evening, after NSE publishes its end-of-day file of prices (the bhavcopy), the top gainers and losers page ranks NSE stocks by how much they moved that day. It answers four simple questions:
- Top gainers: which stocks rose the most in %?
- Top losers: which fell the most?
- Volume gainers: which traded far more shares than usual, whatever the price did?
- NIFTY 50: how did each of the 50 index stocks do, best to worst?
It also shows how many stocks rose and fell (the advance/decline count) and how many made new 52-week highs or lows. On Fri 13 Nov 2026, for example, 543 NSE stocks with a ChartMine page rose and 990 fell, The Anup Engineering topped the gainers at +20.00%, and BF Utilities traded 210.2 times its usual volume.
These are end-of-day numbers, fixed at the close. They are not live prices, and they do not change during the next trading day.
One line to remember: a place on the list tells you that a stock moved a lot today. It does not tell you why, or what it will do tomorrow. In a year of data, yesterday’s top gainers were, on average, slightly more likely to fall than rise over the next week.
The words you will see
| Term | What it means |
|---|---|
| % change | The day’s closing price against NSE’s previous close for that stock. +20% means the share closed one-fifth higher than yesterday. |
| Turnover (₹ crore) | The money that changed hands: shares traded × price. It tells you how much real trading was behind the move. |
| Volume | The number of shares traded that day. |
| Volume vs 20-day average | The day’s volume ÷ the average volume of the previous 20 sessions. 1× is a normal day; 10× means ten times the usual number of shares. |
| Delivery % | The share of the day’s traded quantity that was actually delivered into demat accounts, rather than bought and sold within the same day (intraday). See the delivery % page. |
| Advances / declines | How many stocks closed higher and lower. A quick read of how broad the day’s move was; the market breadth page tracks it over time. |
| Price band (circuit) | The most a stock may move in a day: 2%, 5%, 10% or 20% for most stocks. A stock that closes exactly at its band is “at the upper (or lower) circuit”. |
| 52-week high / low | The highest and lowest price of the past year. |
| F&O stocks | Stocks that also trade in futures and options. They are usually larger and more liquid. |
Types of big moves
Not every big move means the same thing. Beginners mix these up:
| Kind of move | What it often looks like |
|---|---|
| News or results move | A large % change with high turnover and a big volume multiple, often on a results day or after an announcement. |
| Circuit move | The close equals the day’s high (or low) at exactly the band limit, e.g. +5.00% or +20.00%. |
| Thin-trading move | A big % change on very little money. The page filters most of these out with its ₹1 crore rule. |
| Corporate-action “move” | On the ex-date of a bonus issue or split, the price drops mechanically. Against an unadjusted previous close it looks like a huge “loss” that is not a loss at all. |
| Volume surge | Many more shares than usual, with any price change: up, down or flat. |
Why use it: advantages and limits
✅ The day in one minute
Breadth, the biggest moves and the biggest volume surges on one page.
✅ Filtered for real trading
Gainers, losers and volume gainers include only stocks that traded ₹1 crore or more, so tiny trades do not crowd the list.
✅ Context in every row
Volume multiple, delivery % and turnover sit next to the % change.
✅ A starting point
Every name links to the stock’s page with its chart, delivery, deals and announcements.
Limits
- End of day only. Rebuilt every trading evening after NSE publishes the bhavcopy, usually by 7 PM IST. For prices during market hours use your broker’s terminal.
- No reasons. The page does not say why a stock moved.
- Raw data elsewhere may differ. On a split or bonus ex-date ChartMine measures the change against the adjusted previous close, so the mechanical price drop does not show as a fall. Raw bhavcopy figures on other sites may not do this (see the case studies).
- Only stocks with a ChartMine page (1,536 on 13 Nov 2026). ETFs and some very small stocks are not included; every stock with a page is on the stock monitor.
- No predictive power on its own. Our test below found no edge in buying the top gainers or losers.
A tour of the page
Open top gainers and losers. The top line says which session the data is for, here Fri 13 Nov 2026, and four boxes sum up the day.

- 1Stocks that closed higher / lower
- 2Biggest % gainer (₹1 crore+ turnover)
- 3Biggest % loser (₹1 crore+ turnover)
- 4Biggest volume against the 20-day average
Advances and declines are counted across all 1,536 stocks with a page. The top gainer, top loser and biggest volume surge are chosen only from stocks that traded ₹1 crore or more (1,437 stocks that day).
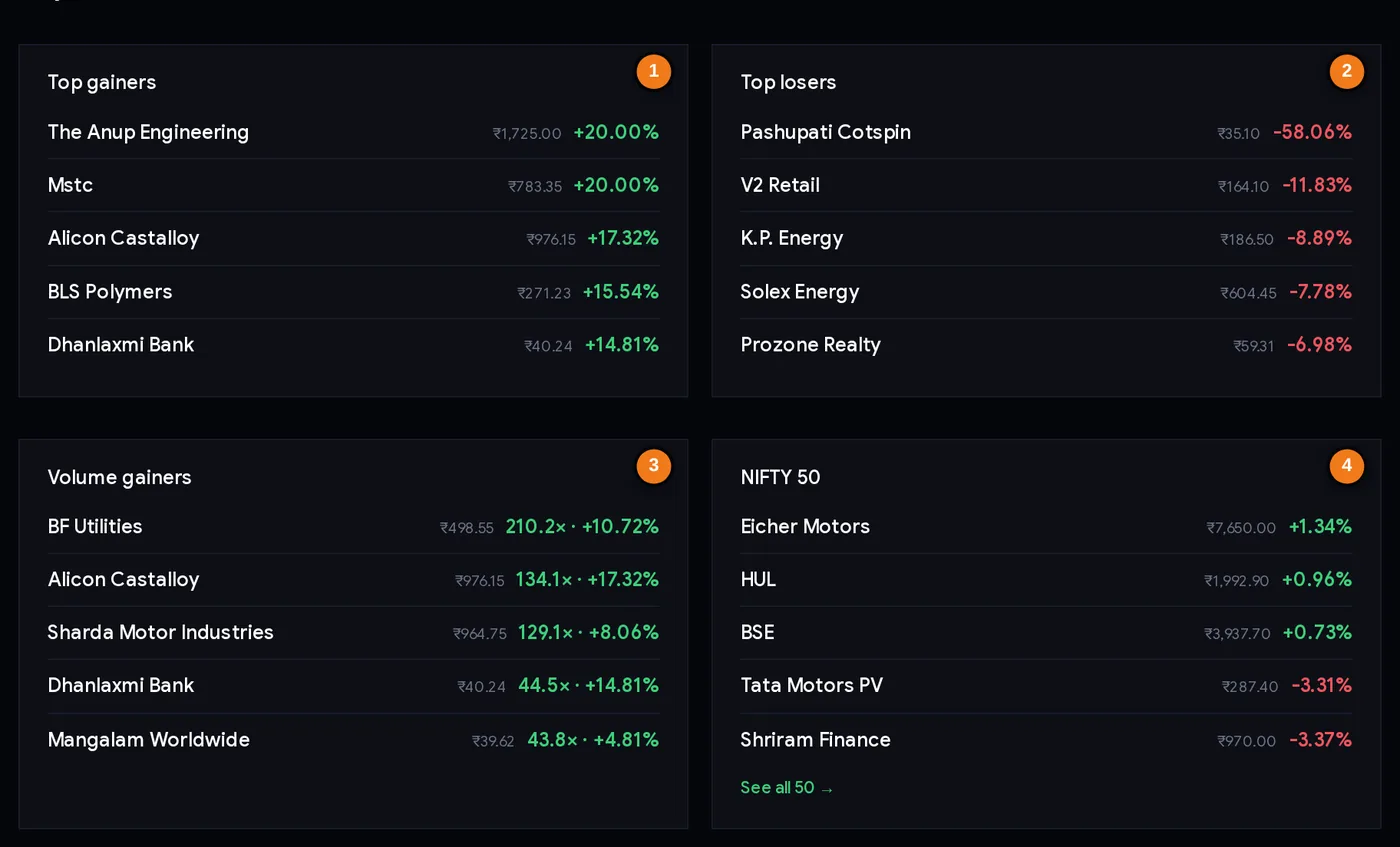
- 1Five biggest % gainers
- 2Five biggest % losers
- 3Five biggest volume surges, with the volume multiple and % change
- 4Three best and two worst NIFTY 50 stocks
The Top 5 cards give the quick view: the five biggest gainers and losers, the five biggest volume surges, and the NIFTY 50 card with the three best and two worst index stocks. “See all 50” jumps to the full NIFTY 50 list.
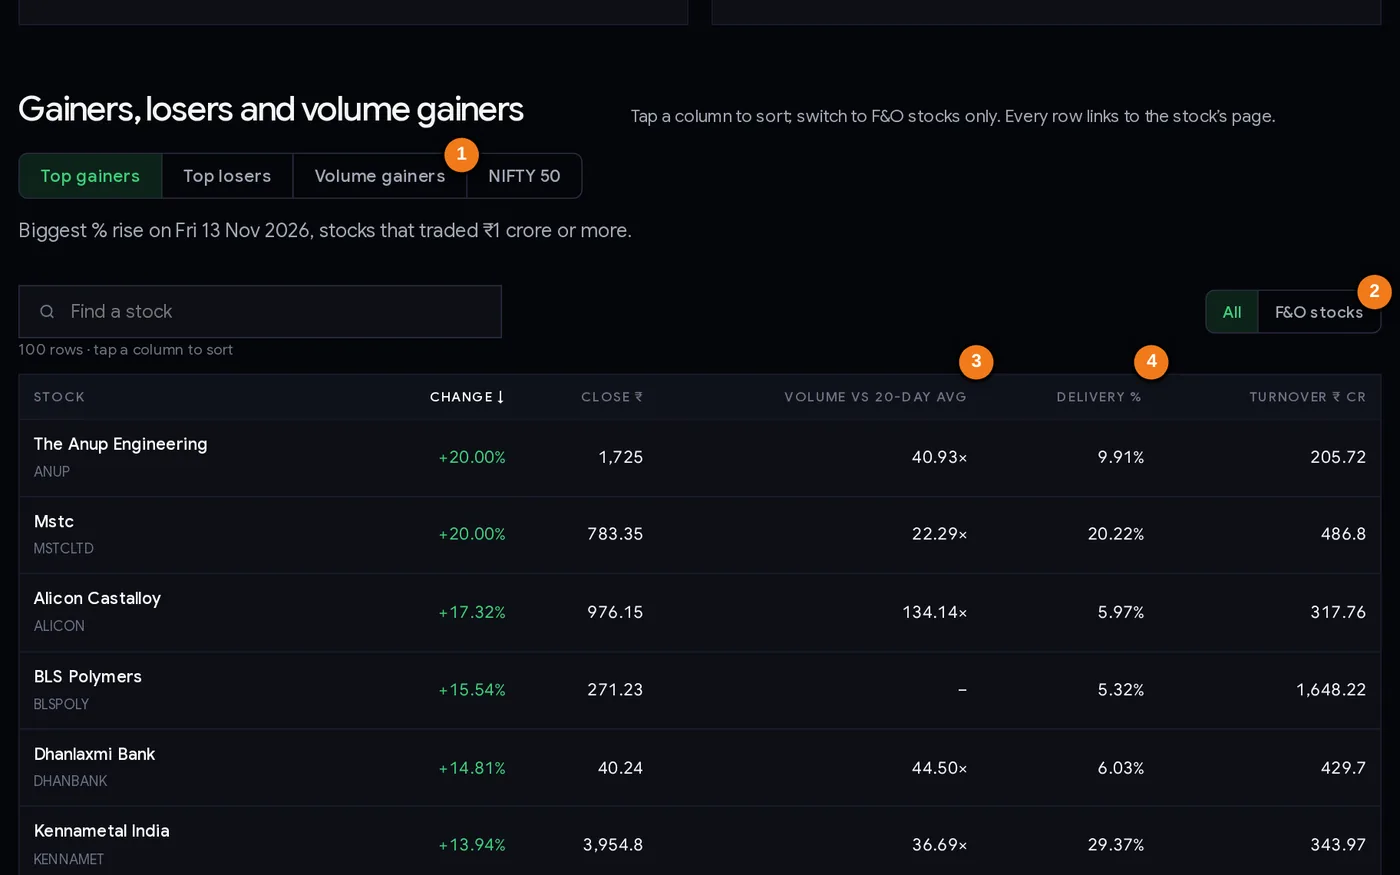
- 1Tabs: gainers, losers, volume gainers, NIFTY 50
- 2Show only F&O stocks
- 3Volume against the 20-day average
- 4Delivery %
| Control or column | What it does |
|---|---|
| Tabs | Top gainers, Top losers, Volume gainers, NIFTY 50. The NIFTY 50 tab has no turnover filter and lists all 50. |
| All / F&O stocks | Show every stock, or only stocks with futures and options. |
| Find a stock | Search the list by name or symbol. |
| Change | % change against the previous close, adjusted for a split or bonus on its ex-date. |
| Close ₹ | The day’s closing price. |
| Volume vs 20-day avg | Today’s shares traded ÷ the average of the previous 20 sessions. Weekend special sessions such as Muhurat trading are left out of the average, and a split or bonus restarts the history. A dash means fewer than 10 earlier sessions, as for BLS Polymers, which listed on 3 Nov 2026. |
| Delivery % | Share of traded quantity delivered, not squared off intraday. |
| Turnover ₹ Cr | Money traded that day in ₹ crore. |
Each list keeps the top 100 stocks; 25 are shown with a “Show all” button for the rest. Tap any column header to sort. Below the tables, Near the 52-week high or low counts the stocks (among 1,362 with a full year of prices) that made a new 52-week high (44 on 13 Nov 2026) or low (10), or closed within 2% of one, with links to the 52-week high scanner.
Step by step: a 10-minute evening routine
- Read the breadth first. 543 up and 990 down on 13 Nov 2026 was a weak day for most stocks, even though NIFTY 50’s top gainer Eicher Motors was up only 1.34%. Note whether the day was broad or narrow.
- Scan the top 5 cards. For each name, ask: is it a stock I follow or hold?
- Check the move’s quality in the table: turnover (real money?), volume multiple (unusual?), delivery % (more than intraday trading?).
- Look for traps. Is the % change a round band number like +20.00% or -5.00%? Is a huge fall really a bonus or split ex-date? Check corporate actions.
- Open the stock page for anything interesting: announcements, results date, deals and the chart.
- Switch to F&O stocks if you trade futures and options, then check the OI build-up for the same names.
- Write down a watchlist, not an order. Add names to your watchlist and compare with stocks to watch tomorrow. Any trade needs its own plan, stop loss and position size.
Does buying yesterday’s winners work? An honest test
A common idea is “buy the top gainers, the momentum will continue” or “buy the top losers, they will bounce”. We tested both on a year of NSE bhavcopy data, using the same rules as the page.
- Period: NSE sessions from 3 Nov 2025 to 13 Nov 2026 (251 days with a full 5-session follow-up).
- Rule: each day, take the 10 biggest gainers and the 10 biggest losers among stocks with a ChartMine page that traded ₹1 crore or more. Moves larger than 40% were left out, because most of them are bonus or split artefacts.
- Measure: the change from that day’s close to the close 1 session and 5 sessions later, compared with all stocks over the same days.
| Group | Next day: median | Next day: higher | 5 sessions: median | 5 sessions: higher |
|---|---|---|---|---|
| Top 10 gainers (about 2,500 cases) | -0.33% | 47% | -1.23% | 44% |
| Top 10 losers (about 2,500 cases) | -0.50% | 44% | -1.08% | 44% |
| All stocks, same period | -0.24% | 45% | -0.51% | 45% |
What it shows: neither list gave an edge. Top gainers were slightly more likely to rise the next day than the average stock (47% against 45%), but after five sessions they were a median 1.23% lower, worse than the average stock. Top losers did not bounce either: a median 1.08% lower five sessions later. The average stock also fell a little over this period, which is why every median is negative.
Limits of this test. One year, closing prices only, no costs or slippage, and the list of stocks is today’s (stocks removed from NSE during the year are missing). It tests a crude rule, not every way traders use these lists. It does not mean a gainer cannot keep rising; it means being on the list was not, by itself, a reason to expect it.
Three ways traders use the lists
Playbook A: the watchlist builder
Uses the lists only to find names worth a closer look. A stock that rises on high turnover, a large volume multiple and high delivery % goes on the watchlist; the decision comes later, from its chart, results and levels, for example with the narrow CPR scanner or pivot points.
Playbook B: the volume watcher
Reads the volume gainers tab first, because unusual volume often comes before or with news. It treats direction as unknown: on 13 Nov 2026 BF Utilities traded 210.2× its average and rose 10.72%, while the same tab can show surges on falling or flat days. The next step is the stock page and the bulk and block deals for that day.
Playbook C: the index trader
Uses the NIFTY 50 tab to see which heavyweights drove the index. On 13 Nov 2026 the best was Eicher Motors (+1.34%) and the worst Shriram Finance (-3.37%) and Tata Motors PV (-3.31%). This helps explain an index move before looking at the NIFTY 50 page or options data.
Risk first. Big movers are volatile. Size every trade from your stop loss with the position size calculator. ChartMine is not a SEBI-registered adviser; this is education, not a recommendation.
Case studies from real sessions
All prices from NSE’s bhavcopy for the dates named.
1. Pashupati Cotspin, 13 Nov 2026: a “crash” that was a bonus issue
In NSE’s raw bhavcopy Pashupati Cotspin closed at ₹35.10 against a previous close of ₹83.69, on ₹37.1 crore of turnover. Taken at face value that is a -58.06% crash. But 13 Nov 2026 was its ex-date for a 3:2 bonus issue (three new shares for every two held), listed on NSE’s corporate actions, and NSE’s previous close was not adjusted for it. A holder of 2 shares now had 5, so the fair comparison is ₹83.69 × 2 ÷ 5 = ₹33.48. Against that, ₹35.10 was 4.85% higher, and that is the change ChartMine’s movers lists show. Lesson: a bonus or split ex-date makes the raw % change look like a crash. ChartMine adjusts for it, but when a move looks extreme on another site, a chart or a data file, check corporate actions for a bonus or split that day.
2. The Anup Engineering and Mstc, 13 Nov 2026: moves capped at the band
Both closed exactly +20.00% at the day’s high: Anup at ₹1,725.00 on ₹205.7 crore of turnover and 40.9× its usual volume, Mstc at ₹783.35 on ₹486.8 crore. A close at exactly +20% and at the high usually means the stock reached its upper price band, so the move was capped, not finished. Anup’s delivery was only about 10%, so most of the day’s trading was intraday. Lesson: a circuit close tells you demand exceeded supply at the limit; it does not tell you the next day’s open.
3. Prozone Realty and Gabriel India: from gainers to losers in a day
On 12 Nov 2026 Prozone Realty topped the gainers at +19.98% (₹63.76, closing at the day’s high) and Gabriel India rose 16.53% to ₹1,641.20 on ₹1,289.7 crore. On 13 Nov 2026 Prozone opened at ₹63.76 and fell to close at ₹59.31, -6.98%, the fourth-biggest loser; Gabriel closed at ₹1,552.70, -5.39%. Lesson: this is what the test above shows in numbers: yesterday’s gainers often give some back.
4. TD Power Systems and MM Forgings, 6 Nov 2026: the opposite case
On 6 Nov 2026 MM Forgings rose 19.95% to ₹629.40 and TD Power Systems fell 13.85% to ₹576.50 on ₹1,113.3 crore. By the close on 13 Nov 2026 MM Forgings was at ₹684.90 (+8.8% more) and TD Power Systems at ₹637.55 (+10.6% from its fall). Lesson: single cases point both ways, which is why the lists are a place to start research, not a signal.
5. V2 Retail, 13 Nov 2026: a fall with real money behind it
V2 Retail fell 11.83% to ₹164.10 on ₹725.2 crore of turnover, with 32.5% delivery. Compared with a thin-trading move, a fall like this involved large amounts of money and a fair share of delivery-based selling. Lesson: turnover and delivery tell you how seriously to take a move; the stock page tells you what happened.
Common mistakes
- Chasing the top gainer the next morning. In our test, top gainers were a median 1.23% lower five sessions later.
- Buying the top loser as a “bounce”. Losers were a median 1.08% lower five sessions later.
- Missing a bonus or split in raw data. Pashupati Cotspin’s raw -58.06% on 13 Nov 2026 was a 3:2 bonus ex-date; adjusted, it was +4.85%.
- Reading a volume surge as a direction. It shows interest, not which way the price goes next.
- Ignoring turnover. A 15% move on ₹1 crore is not the same as a 5% move on ₹500 crore.
- Comparing these numbers with live prices during market hours. They are fixed at the previous close.
- Ignoring breadth. A few big gainers on a day when 990 stocks fell does not make it a strong market.
- Trading without a plan. Big movers move fast both ways; decide the stop loss and size before entering.
Checklist before acting on a big mover
- I know which session the data is for and that it is end-of-day, not live.
- I checked the day’s breadth (advances versus declines).
- The move had real turnover, and I noted the volume multiple and delivery %.
- I checked whether the close was exactly at a price band.
- I checked corporate actions for a bonus, split or dividend ex-date.
- I opened the stock page and read the announcements or results behind the move.
- I know that, in our test, being on the list gave no edge by itself.
- Any trade has its own entry reason, stop loss and position size.
Glossary
| Bhavcopy | NSE’s official end-of-day file with every stock’s open, high, low, close, previous close, volume and turnover. |
| Top gainer / loser | Biggest % rise / fall against the previous close, among stocks that traded ₹1 crore or more. |
| Volume gainer | A stock whose volume was many times its 20-session average. |
| Turnover | The value of shares traded in a day, in ₹ crore. |
| Delivery % | Share of traded quantity delivered into demat accounts. |
| Advances / declines | Number of stocks that closed higher / lower. |
| Price band / circuit | The daily limit on a stock’s move (2%, 5%, 10% or 20% for most stocks). |
| Ex-date | The first day a share trades without the right to a bonus, split or dividend; the price adjusts that day. |
| Bonus issue | Free extra shares to existing holders, e.g. 3:2 = three new shares for every two held. |
| Median | The middle value when results are sorted. |
Questions
How are NSE top gainers and losers calculated?
ChartMine takes NSE’s end-of-day bhavcopy, computes each stock’s close against NSE’s previous close, and ranks stocks that traded ₹1 crore or more. The NIFTY 50 list has no turnover filter.
What are volume gainers in the stock market?
Stocks that traded many more shares than usual: the day’s volume divided by the average of the previous 20 sessions. On 13 Nov 2026 BF Utilities traded 210.2 times its average. A volume surge does not tell you the direction.
Should I buy today’s top gainers?
ChartMine cannot advise you. In our test over a year of sessions to 13 Nov 2026, the day’s top 10 gainers were a median 1.23% lower five sessions later, and only 44% were higher. Use the list for research, with a stop loss for any trade.
Why does a stock sometimes show a huge one-day fall?
Sometimes it is a real fall, but on a bonus or split ex-date the price drops mechanically. Pashupati Cotspin looked -58.06% in NSE’s raw data on 13 Nov 2026, its 3:2 bonus ex-date; adjusted for the bonus it closed 4.85% higher. ChartMine’s movers lists show the adjusted change.
Are the top gainers and losers live prices?
No. They use NSE’s end-of-day bhavcopy and are rebuilt every trading evening, usually by 7 PM IST. For prices during market hours, use your broker’s terminal.
Why is there a ₹1 crore turnover filter on the gainers list?
Very thinly traded stocks can jump 10% or more on a handful of trades. The ₹1 crore filter keeps the gainers, losers and volume lists to moves with real trading behind them.
What does it mean when a stock is up exactly 20% or 5%?
It usually means the stock closed at its daily price band (upper circuit), the most it was allowed to move that day. The move was capped by the band, which says nothing about the next day.