
☰ All tutorials
Start here
Tool tutorialsHow to trade with ChartMineStocks
Stock monitorMy watchlistStock scores & checklistMarket & sectors
Nifty 50Bank NiftySensexFin NiftyDaily market reportMarket breadthSector rotationSector heatmapStock screenerRelative strength (RS)MCX commodity pricesFear & Greed IndexWhat happens after…Scanners
Top gainers & losersStocks to watch tomorrowNR7 stocks scannerInside bar stocks52-week high stocksGap up & gap down stocksRSI oversold stocksGolden cross stocksSuperTrend buy stocksScan builderEMA 9/21 crossoverMACD crossoverADX strong trendBollinger breakout / squeezeVolume spike stocksOpen = high / open = lowCandlestick pattern scannerNarrow CPR scannerF&O data
F&O ban listOI build-upOption chainPCR & max painExpiry calendarF&O lot sizesOI build-up heatmapPCR trendMax pain trendFutures basisStock screens
Quarterly growersProfit growth stocksLow P/E stocksMutual fund buyingNear 52-week low, growingDebt-free companiesHigh ROE & ROCEMagic Formula stocksLow price-to-bookSmart money
FII / DII dataShareholding changesBig-money footprintShort selling dataF&O positions by participantBulk & block dealsPromoter buyingDelivery percentageCalendars
Results calendarQuarterly results trackerBoard meetingsCorporate actionsIPO calendarIPO performanceResearch & planning
Strategy testerCompare stocksDividend yield stocksASM / GSM listExpiry-day movesSeasonality & stock historyNSE holidays 2026Position size calculatorOption payoff calculatorPivot point calculatorMore
Stock scanners hubStock screensHow to use the near 52-week low, growing profits screen
A plain-language tutorial on finding companies whose share price is near its one-year low while their results are improving: the exact rules, why it happens, what our own test found, a tour of the screen, playbooks and real case studies from 2026.
What this screen is, in plain words
Most of the time, a share price and a company’s results move in the same direction. Profits rise, the price rises. Profits fall, the price falls. This screen looks for the moments when the two disagree: the share price is close to its lowest level of the past year, yet the company’s latest quarterly results show sales and profit both higher than a year ago.
Two words you will see all the time:
- 52-week low: the lowest price the stock traded at in the last 52 weeks (about 250 trading days). It is the bottom of the one-year range.
- YoY (year on year): comparing a quarter with the same quarter a year earlier, for example July–September 2026 against July–September 2025. This removes seasonal effects such as festive-season sales.
The Near 52-week low, profits growing screen checks every eligible NSE stock after each close and lists those that are within 10% of their 52-week low while their latest quarter’s sales and profit are both up on a year ago. It sorts them so the stock closest to its low comes first.
One line to remember: this is a list of questions, not answers. Each name asks: “Why is the market selling a company whose numbers are improving?” Sometimes the market is wrong. Often it knows something the last quarter does not show yet.
The exact rules behind the list
Knowing the rules helps you understand why a stock is (or is not) on the list. These are the rules the page uses, taken from ChartMine’s screen code.
| Rule | What it means |
|---|---|
| Who is checked | NSE-listed companies with at least 120 trading days of price history, a median daily turnover of ₹1 crore or more over the last 60 sessions (F&O stocks always qualify), quarterly results on file, and a market value (market cap) of at least ₹500 crore. Below ₹500 crore, filing errors and tiny profits distort the numbers too much. |
| Near the low | Last close ÷ 52-week low − 1 is 10% or less. The 52-week low is the lowest intraday price of the last 250 sessions, adjusted for splits and bonus issues. |
| Sales growing | Latest quarter’s sales up on the same quarter a year earlier. For banks and finance companies, total income is used instead of sales. |
| Profit growing | Latest quarter’s profit (the part that belongs to the company’s own shareholders) up on a year earlier. The year-ago profit must be positive, so a company coming out of a loss does not qualify. |
| Data sanity | A jump of more than 500% in sales is almost always a unit error in one filing, so such a stock is left out until the data is checked. |
| Sort order | Closest to the 52-week low first. The page shows up to 150 names. |
A worked example: Supreme Industries (data of 6 Nov 2026)
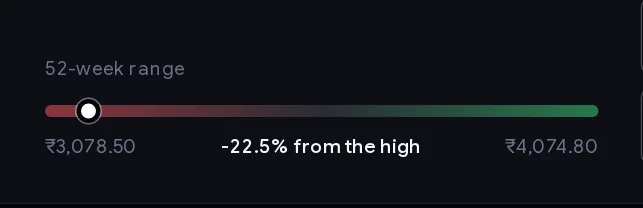
- Close on 6 Nov 2026: ₹3,156.90. 52-week low: ₹3,078.50, made that same day. 52-week high: ₹4,074.80 (26 Feb 2026).
- Distance from the low: 3,156.90 ÷ 3,078.50 − 1 = +2.5%. Inside the 10% band.
- Sales, July–Sept 2026 quarter: ₹3,361 crore against ₹2,394 crore a year earlier: +40%.
- Profit for the same quarter: ₹233 crore against ₹150 crore: +55%.
- Result: Supreme Industries appears on the list, about 20% lower than a year ago even though the latest quarter grew strongly.
That is exactly the kind of disagreement the screen is built to find. Whether the price is “wrong” is a separate question that only your own research can answer.
Why a growing company can sit near its low: the usual reasons
When you open a name from the list, try to place it in one of these groups. It turns a vague feeling (“it looks cheap”) into a specific question you can check.
| Type | What is going on | What to check |
|---|---|---|
| Overreaction | A weak quarter, a downgrade or a market-wide fall pushed the price down, but the business kept growing. | Is the growth broad (sales and profit) and repeated over more than one quarter? |
| Valuation reset | The company was priced very high (a high P/E) and the market is now paying less for each rupee of profit, even as profit grows. | The P/E column. A P/E of 50+ falling towards the sector average can take a long time. |
| Sector out of favour | The whole industry is being sold (for example a policy change or a commodity price move). | Compare with the sector rotation and sector heatmap pages. |
| Worry about the future | The last quarter is good, but the market expects the next ones to be weaker: margins, competition, a lost contract, management guidance. | News, management commentary, the trend of margins on the stock page. |
| One-off profit | Profit rose because of a one-time gain (sale of an asset, a tax write-back), not because the business improved. | Did sales grow too? Is profit growth much bigger than sales growth? |
| Low base | The year-ago quarter was unusually weak, so any normal quarter looks like strong growth. | The previous few quarters on the stock page. |
The first two types are where patient investors hope to find value. The last three are the classic value traps: stocks that look cheap and keep getting cheaper.
Advantages and limits (with an honest test)
✅ Finds disagreements fast
Checking 1,000+ companies’ price ranges and results by hand would take days. The list is ready after every close.
✅ Filters out pure falling stocks
Many stocks near their lows are there because the business is shrinking. Requiring growth removes most of them.
✅ Built on filed numbers
Sales and profit come from the results each company files with NSE, not from estimates or forecasts.
✅ A natural watchlist
Names that keep appearing week after week are worth a closer look; names that drop off because the price recovered show you what the market decided.
What we found when we tested it
We rebuilt the screen on seven dates between 15 May and 11 Aug 2026, using only the results that had already been filed on each date, and checked each stock’s price 60 trading days (about three months) later. Prices are adjusted for splits and bonuses; dividends are not included.
| Group | Cases | Median 3-month change | Average | Share that rose |
|---|---|---|---|---|
| Near the low and growing (this screen) | 386 | −1.7% | +0.3% | 44% |
| Near the low, not growing | 584 | −4.5% | −2.6% | 35% |
| All eligible stocks | 8,839 | −2.5% | +0.6% | 44% |
What this means in plain words:
- The growth filter helped against other stocks near their lows. Near-low stocks without growth did clearly worse: only 35% rose.
- But the screen did not beat the market as a whole. Its stocks rose about as often as the average stock (44% both), and the average change was similar.
- The sample is small and recent. ChartMine’s results history starts in 2025, so a year-on-year test was only possible from May 2026. One three-month window in one market phase proves very little either way.
So how should you use it? As a research shortlist. On its own, “near the low with growth” was not a reliable edge in our test. What you add matters: understanding why the price fell, waiting for the price to stop falling, and sizing small.
A tour of the screen
Open the screen. It has three parts: the header with the summary chips, the results table, and notes with links to the other screens.
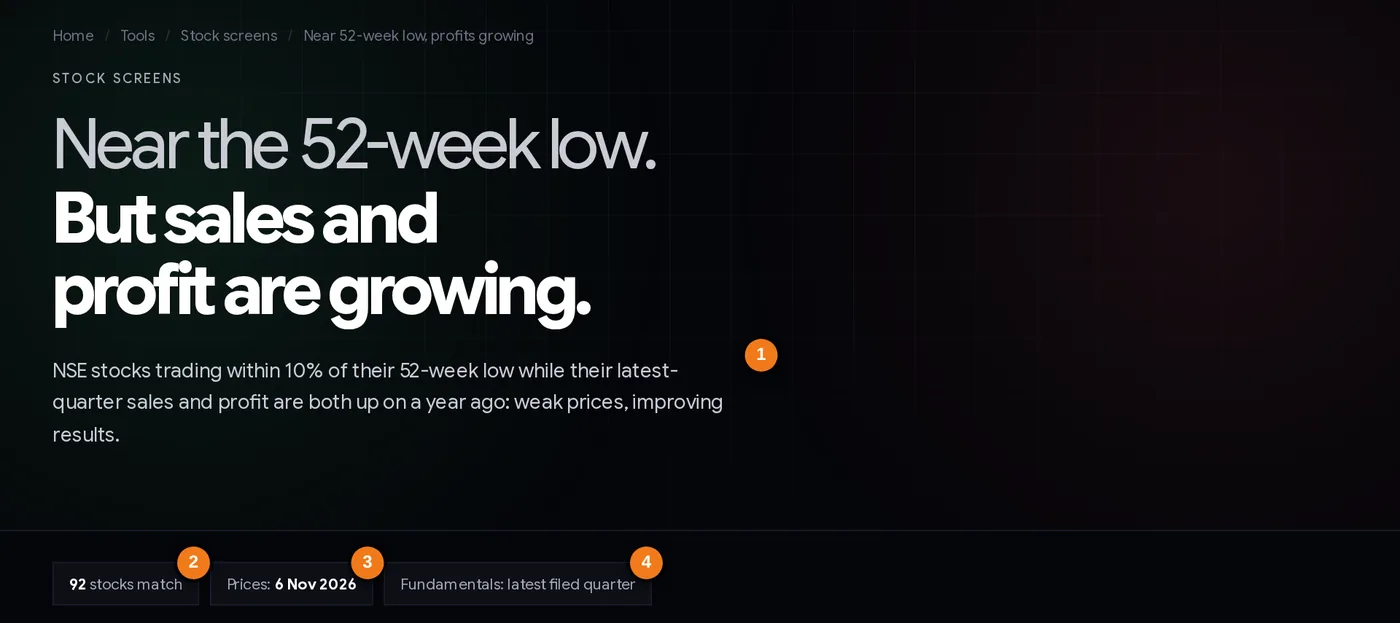
- 1The rule in one sentence: within 10% of the 52-week low, sales and profit up on a year ago.
- 2How many stocks match today.
- 3Date of the prices used.
- 4Fundamentals come from each company’s latest filed quarter.
The chips tell you how many stocks match today and how fresh the data is. Prices are from the last trading day’s close. Fundamentals are from each company’s latest filed quarter, so during results season (mid-January, April, July and October to mid-February, May, August and November) the list changes almost every day as new results arrive.
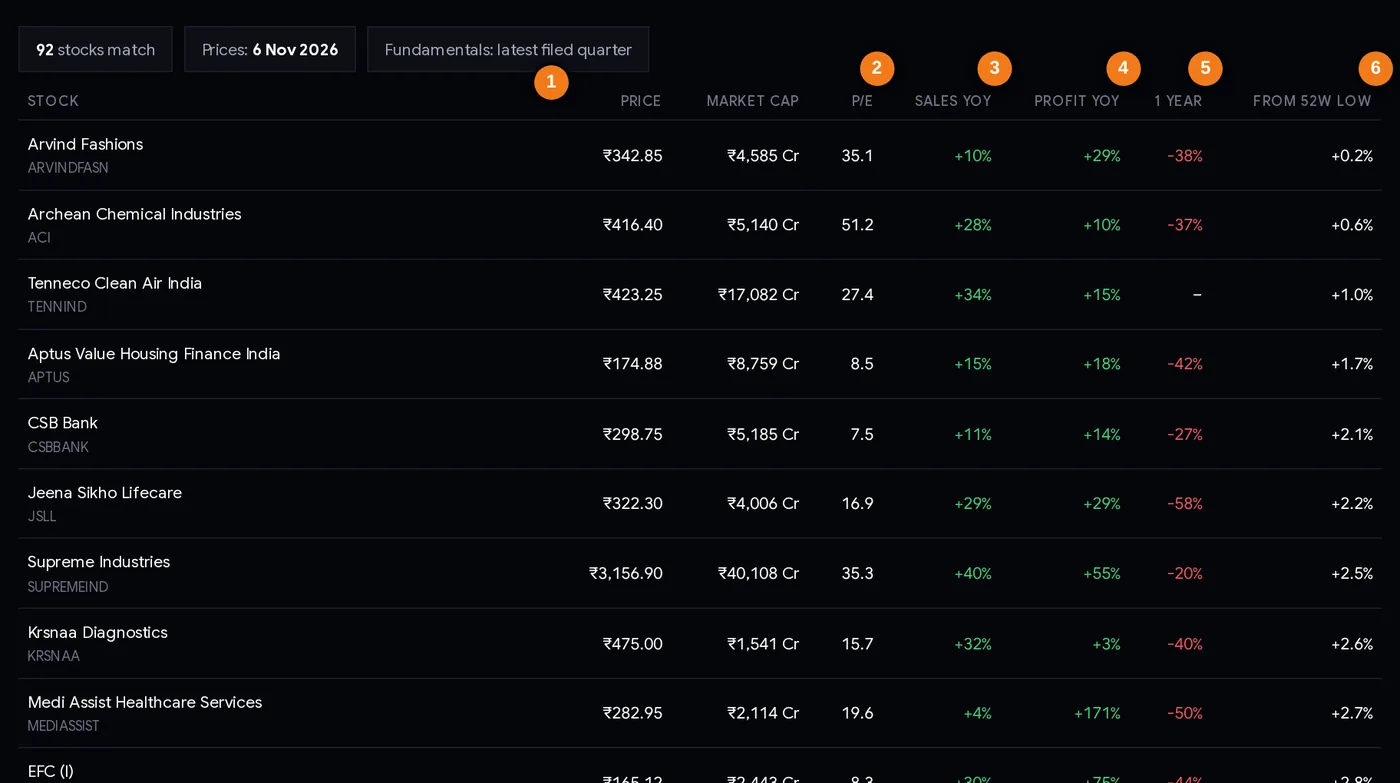
- 1Company and NSE symbol (click for the stock page)
- 2P/E on the last four quarters
- 3Sales growth on a year ago
- 4Profit growth on a year ago
- 5Price change over one year
- 6Distance above the 52-week low
Every column explained
| Column | What it tells you |
|---|---|
| Stock | Company name and NSE symbol. Click it to open the ChartMine stock page with the chart, results, shareholding and the 52-week range. |
| Price | Last closing price in ₹. |
| Market cap | Price × shares outstanding, in ₹ crore (“L Cr” means lakh crore: ₹1 L Cr = ₹1,00,000 crore). Bigger companies are usually more liquid and better researched. |
| P/E | Price ÷ earnings per share of the last four quarters. How many rupees you pay for one rupee of yearly profit. See the low P/E tutorial. |
| Sales YoY | Latest quarter’s sales (income for banks) against the same quarter last year. Always positive here, by the rules. |
| Profit YoY | Latest quarter’s profit against a year ago. Also always positive here. |
| 1 year | Price change over the last 250 sessions. A dash means the stock listed less than a year ago. |
| From 52W low | How far the close is above the 52-week low. +0.2% means it is almost exactly at the low. |
On the stock page, the 52-week range bar shows where the price sits between the low and the high:
Step by step: a weekly research routine (30 minutes)
- Open the screen after the close, ideally once a week, and more often in results season. Note the count in the first chip.
- Scan the “From 52W low” column. Names at +0% to +2% are at the low right now; the price is still falling. Names at +8% to +10% have bounced a little.
- Look at the size of the growth. Sales and profit growing together is sturdier. Profit +150% on sales +1% (Bajaj Electricals on 6 Nov 2026 showed +165% profit on +1% sales) usually means margins, a low base or a one-off, so check which.
- Check the “1 year” column. A stock down 50% in a year with growing results is a much bigger disagreement than one down 10%. It also means bigger risk: something serious may be priced in.
- Open the stock page for 3 to 5 names. Read the last 8 quarters of results: is the growth a trend or one quarter?
- Find the reason for the fall. Search the company’s announcements, check promoter buying or selling, bulk and block deals and shareholding changes. Selling by insiders or funds is a warning.
- Check the trend. Is the price still making new lows? Many investors wait for the price to stop falling, for example a few weeks without a new low or a close back above the 50-day average, before doing anything.
- Write it down. For each name: why it fell, why you think the market may be wrong, and what would prove you wrong.
Three playbooks
Playbook A: the patient investor (months, not days)
- Pick names where growth has lasted at least two quarters and the company has little debt (see the debt-free screen).
- Do not try to buy the exact bottom. Split the amount into two or three parts, spaced weeks apart or tied to the next results.
- Decide in advance what would make you exit: for example, sales growth turning negative in the next quarter, or a close well below the 52-week low (a new low after your purchase is information too).
- Keep each stock to a small share of your portfolio, so one wrong call cannot hurt you badly.
Playbook B: the swing trader waiting for a turn (weeks)
- Use the list only as a watchlist. Do nothing while the price keeps falling.
- Wait for a sign that sellers are done: a higher low on the daily chart, a close above a recent swing high, or a high-delivery day near the low.
- Enter only after that confirmation. Put the stop loss below the 52-week low: if the price breaks it, the turn has failed.
- Use the position size calculator so that hitting the stop costs no more than a small, fixed part of your capital (many traders use 0.5% to 1%).
Playbook C: the results-season filter
In results season, check the list every evening. A stock that just reported strong growth and fell to a new low the same week is a very clear disagreement. Read why: sometimes the numbers beat last year but missed what the market expected. The results calendar shows how the stock moved after past results.
Never average down blindly. Buying more because the price fell again only makes sense if your reasons are still true. Set the maximum you will put into any one stock before the first purchase.
Case studies: what happened to three names from the 1 Jun 2026 list
On 1 Jun 2026, our rebuilt screen (using only results filed before that day) listed 63 stocks. Here are three of them, chosen to show a big winner, a painful loser and a slow grind. Prices in ₹, from NSE’s daily price files.
1. Kalyan Jewellers: right, but only after one more fall
On 1 Jun the stock closed at 343.95, about 2% above its 52-week low of 337. Its January–March 2026 quarter, filed on 8 May, showed sales up 66% and profit up 118% on a year earlier.
It did not turn at once. It fell to a new low of 327.05 on 11 Jun, about 5% lower. Then it rallied to 612.60 by 25 Aug: +78% in 60 sessions, and made a 52-week high of 648.95 on 30 Jul. Lesson: even when the idea is right, a stock near its low often dips further first. A stop loss placed just a few rupees under the old low would have been hit before the rally; that is why many traders wait for the price to stop falling before entering.
2. Patanjali Foods: the results kept growing, the price did not
On 1 Jun: close 449.25, 52-week low 438. The January–March 2026 quarter showed sales up 15% and profit up 46%.
The price kept falling to a low of 328.20 on 15 Jul and was 350.90 on 25 Aug: −22%. The next quarter (April–June 2026) still showed profit of ₹336 crore against ₹180 crore a year earlier. Lesson: good results do not stop a falling price. Whatever the market was worried about, one more good quarter did not change its mind within three months. This is the “falling knife” the page warns about, and why Playbook B waits for a turn.
3. Tata Elxsi: slow and steady down
On 1 Jun: close 4,302.90, 52-week low 3,945; January–March sales +9% and profit +28%. By 25 Aug it was 3,665.90 (−15%), and it went on to a 52-week low of 2,996 on 8 Oct 2026. Its quarterly sales kept rising slowly (₹994 crore, ₹1,021 crore, ₹1,056 crore). Lesson: modest growth may not be enough when the market is re-pricing a company that used to trade at a very high P/E (the “valuation reset” type).
What the 1 Jun list did as a whole
Two out of three examples lost money, and the whole test (above) showed no clear edge over the market. Case 1 shows the upside that keeps investors interested. Cases 2 and 3 show why position size and an exit plan matter more than the list itself.
Common mistakes
- Thinking “near the low” means “cheap”. A price can halve again. The low is only the lowest price so far.
- Trusting one quarter. One good quarter can be a low base or a one-off. Look at the last 8 quarters on the stock page.
- Ignoring why the price fell. If you cannot find the reason, you cannot judge whether the market is wrong.
- Buying all at once at the first sight of the list. Kalyan Jewellers fell another 5% before its rally; Patanjali fell another 27% from its 1 Jun close.
- No exit plan. Decide before buying what result or price would prove you wrong.
- Forgetting the size of the company. A ₹600 crore company can move 10% on a few large orders. Market cap matters for liquidity.
- Treating the list as advice. It is a mechanical filter of public data. ChartMine is not a SEBI-registered adviser.
Research checklist
- Prices are from the latest trading day; I know which quarter the growth figures refer to.
- Sales and profit both grew, and the growth is not just a low base or a one-time gain.
- Growth shows up in more than one quarter.
- I have found a likely reason for the price fall (sector, valuation, news, guidance).
- No large selling by promoters, mutual funds or FIIs in the latest shareholding or deals.
- Debt is manageable (check the balance sheet on the stock page).
- I have a plan: wait for the price to stop falling, buy in parts, or skip.
- Exit rule and maximum position size written down before any purchase.
Glossary
| 52-week low / high | The lowest / highest price in the last 52 weeks (about 250 trading days). |
| From 52W low | Close ÷ 52-week low − 1, in %. 0% means the stock is at its low. |
| YoY | Year on year: a quarter compared with the same quarter one year earlier. |
| Quarter | A three-month period. Indian companies file results within 45 days of each quarter (60 days for the March quarter). |
| Market cap | Share price × number of shares. The market value of the whole company. |
| P/E | Price ÷ earnings per share of the last four quarters. |
| Value trap | A stock that looks cheap on its numbers but keeps falling because the business is getting worse. |
| Falling knife | A stock in a steep, ongoing fall. “Catching” it early often hurts. |
| Low base | An unusually weak comparison period that makes normal results look like strong growth. |
| Stop loss | A pre-decided price at which you exit to limit the loss. |
Questions
Which stocks are near their 52-week low but growing?
The ChartMine screen lists NSE stocks trading within 10% of their 52-week low whose latest quarterly sales and profit are both higher than in the same quarter last year. On 6 Nov 2026 prices, 92 stocks matched.
Is it good to buy a stock at its 52-week low?
Not by itself. A stock near its low can keep falling, and the low may reflect real problems. In ChartMine’s test (May to Aug 2026), stocks near their low with growing results did about as well as the average stock over the next three months, not better. Treat the list as a starting point for research and always use a stop loss and small position size.
How is the 52-week low calculated?
It is the lowest intraday price of the last 250 trading sessions, adjusted for splits and bonus issues. The screen measures how far the latest close is above that low.
Why is a stock with rising profits falling?
Common reasons: the market expects future quarters to be weaker, the stock was very expensive before (a high P/E), the whole sector is out of favour, or the profit growth came from a one-off gain or a weak year-ago quarter.
How often is the list updated?
Prices update with every site build after the market closes. Results update nightly, so the list changes most during results season as companies file new quarterly numbers.
What is a value trap?
A stock that looks cheap (near its low, low P/E or below book value) but keeps falling because the business is actually getting worse. Checking several quarters of results and the reason for the fall helps avoid them.
Does the screen include banks?
Yes. For banks and finance companies, total income is used in place of sales. The same 10% and growth rules apply.