
☰ All tutorials
Start here
Tool tutorialsHow to trade with ChartMineStocks
Stock monitorMy watchlistStock scores & checklistMarket & sectors
Nifty 50Bank NiftySensexFin NiftyDaily market reportMarket breadthSector rotationSector heatmapStock screenerRelative strength (RS)MCX commodity pricesFear & Greed IndexWhat happens after…Scanners
Top gainers & losersStocks to watch tomorrowNR7 stocks scannerInside bar stocks52-week high stocksGap up & gap down stocksRSI oversold stocksGolden cross stocksSuperTrend buy stocksScan builderEMA 9/21 crossoverMACD crossoverADX strong trendBollinger breakout / squeezeVolume spike stocksOpen = high / open = lowCandlestick pattern scannerNarrow CPR scannerF&O data
F&O ban listOI build-upOption chainPCR & max painExpiry calendarF&O lot sizesOI build-up heatmapPCR trendMax pain trendFutures basisStock screens
Quarterly growersProfit growth stocksLow P/E stocksMutual fund buyingNear 52-week low, growingDebt-free companiesHigh ROE & ROCEMagic Formula stocksLow price-to-bookSmart money
FII / DII dataShareholding changesBig-money footprintShort selling dataF&O positions by participantBulk & block dealsPromoter buyingDelivery percentageCalendars
Results calendarQuarterly results trackerBoard meetingsCorporate actionsIPO calendarIPO performanceResearch & planning
Strategy testerCompare stocksDividend yield stocksASM / GSM listExpiry-day movesSeasonality & stock historyNSE holidays 2026Position size calculatorOption payoff calculatorPivot point calculatorMore
Stock scanners hubStock screensHow to use the results calendar
A plain-language guide to results season: when companies report, how much each F&O stock usually moves on results day, how to read what options are pricing, and what our own data says about direction.
What the results calendar is, in plain words
Four times a year every listed company tells the public how much it sold and how much it earned in the last three months. These are its quarterly results. For a share price, results day is often the single most important day of the quarter: years of expectations get tested against one set of numbers in one evening.
The results calendar does three jobs for the F&O stocks (the roughly 200 shares that have futures and options):
- When: the date of each company’s results board meeting, taken from the company’s own filing with NSE.
- How much it usually moves: the average size of the share’s move on results day over the last 12 quarters, and how that compares with a normal day.
- What the options market expects now: the move that option prices imply for the coming results day.
Each stock also has its own page (for example HAL) with every past result since 2007 where available: when it was published, the opening gap, the day’s move and where the stock stood three days later.
One line to remember: the results calendar tells you when the risk arrives and how big it has usually been. It does not tell you the direction. In our data, F&O stocks closed higher after results 49% of the time.
Results season, quarters and the words you will see
Indian companies follow a financial year (FY) from April to March. FY27 runs from 1 April 2026 to 31 March 2027. Each quarter is named after its position in that year:
| Quarter | Months covered | Results usually come out |
|---|---|---|
| Q1 | April to June | Mid-July to mid-August |
| Q2 | July to September | Mid-October to mid-November |
| Q3 | October to December | Mid-January to mid-February |
| Q4 | January to March (with the full-year numbers) | Mid-April to end of May |
SEBI’s listing rules give companies 45 days after a quarter ends to publish results (60 days for the year-end quarter). That is why results arrive in a wave called results season: a few big IT companies and banks report in the first two weeks, and hundreds of companies crowd into the last days before the deadline. On 9 Nov 2026 the board meetings page listed 188 results meetings on Thursday 12 Nov and 213 on Friday 13 Nov.
Key terms
- Board meeting: the company’s directors meet to approve the results. The company must tell the exchange in advance. The date on the calendar is this meeting date.
- Published / broadcast time: the moment the results file reaches the exchange. It can be during market hours (9:15 AM to 3:30 PM), after the close, or on a weekend.
- Reaction day: the first trading session that ends after the results are out. Results at 11:47 AM react the same day; results at 6:30 PM react the next trading day.
- Opening gap: the reaction day’s open against the previous close. After-hours results usually show up first as a gap.
- Day’s move: close-to-close change on the reaction day. This is the number the tool calls the results-day move.
- Normal day: the stock’s median daily move (up or down) over the past year, so you can see whether results days are special for that share.
- YoY / QoQ: growth against the same quarter last year / against the previous quarter.
Why it matters: advantages and limits
✅ No surprise dates
A stock in your portfolio or your F&O position can jump 5–15% overnight on results. Knowing the date lets you decide in advance: hold, reduce, hedge or avoid.
✅ Size of risk, per stock
Bandhan Bank’s typical results move is ±5.8%; Page Industries’ is ±1.4%. The same position size carries very different risk.
✅ Options in context
The tool compares what options are pricing with what the stock has actually done, so you can see whether the market is expecting a bigger or smaller move than usual.
✅ Timing habits
Each stock page tells you whether the company usually reports during market hours or after the close, so you know whether to watch the screen or the next morning’s open.
What our own data says (please read)
We measured every results day of the F&O stocks in our daily price files, from 18 Oct 2024 to 6 Nov 2026: 1,601 results days.
| Measure | Result |
|---|---|
| Closed higher on results day | 49% |
| Median size of the move (up or down) | 1.3% (average 1.98%) |
| Median results move versus the stock’s normal day | 1.2× |
| Moved at least twice a normal day | 30% |
| Moved 5% or more | 8% (21 cases of 10% or more) |
| Results after the close: median move | 1.4% (during market hours: 1.18%) |
| Opening gap and close in the same direction | 61% |
| Same direction as the stock’s previous results day | 51% (701 of 1,387 pairs) |
- Direction is a coin toss. 49% up overall, and last quarter’s reaction told you nothing about this quarter’s (51%).
- Most results days are not dramatic. The typical one is only a little bigger than a normal day. The danger is the tail: about 1 in 12 moved 5% or more.
- The opening gap is not the final word. In 39% of cases the stock closed the other way from its gap.
- We cannot yet score the options number. The “options price” is computed live and we do not have a long enough history of it to say how accurate it has been. Treat it as the market’s current estimate, not a forecast.
So how should you use it? As a risk calendar. It answers “how much could this cost me if I am wrong?”, not “which way will it go?”. Past moves do not predict the next one.
A tour of the results calendar
Open the results calendar. The top card lists every F&O company with results in the coming days.
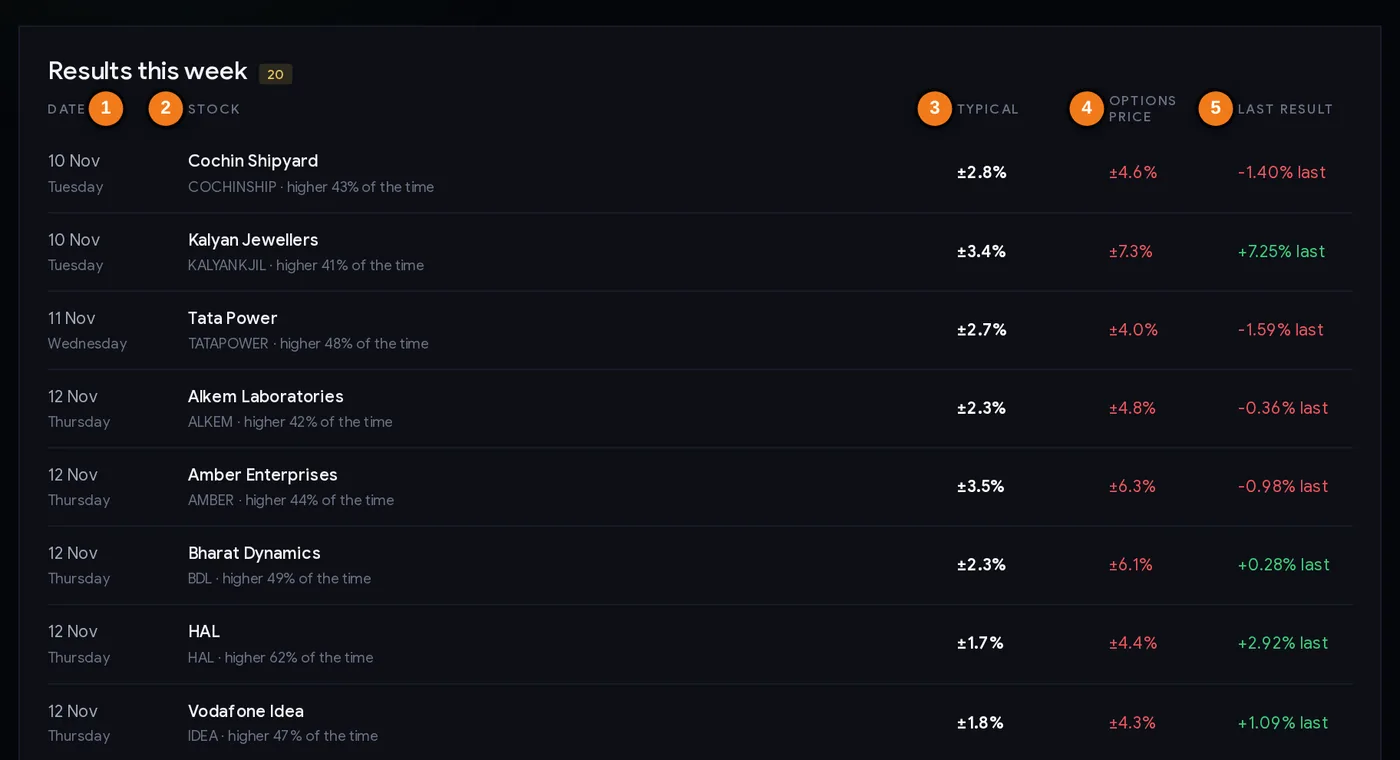
- 1Results date (the board meeting filed with NSE)
- 2Stock, and how often it closed higher after results
- 3Typical move: average size of the results-day move, last 12 quarters
- 4Options price: the move options are pricing for results day now
- 5The move after its last results
| Column | What it tells you |
|---|---|
| Date | The results board meeting date as filed with NSE. Companies can change it; the filing is the final word. |
| Stock | Name, symbol and “higher x% of the time”: the share of past results days on which the stock closed up. Close to 50% for most names. |
| Typical | The average size of the results-day move over the last 12 quarters, shown as ± because it ignores direction. |
| Options price | The move the options market is pricing for results day now (explained below). Red means bigger than the stock’s usual move (more than 1.2×), green smaller (under 0.8×). Outside market hours it shows the last computed value or a dash. |
| Last result | How the stock moved after its previous results. |
Below it, Biggest movers on results ranks stocks by their typical results move, with the multiple of a normal day. On 9 Nov 2026 the top three were Bandhan Bank (±5.8%, 4.3× a normal day), Angel One (±5.5%) and Wipro (±4.8%, 4.9×). All F&O stocks at the bottom has a search box and a link to every stock page.
One stock’s page
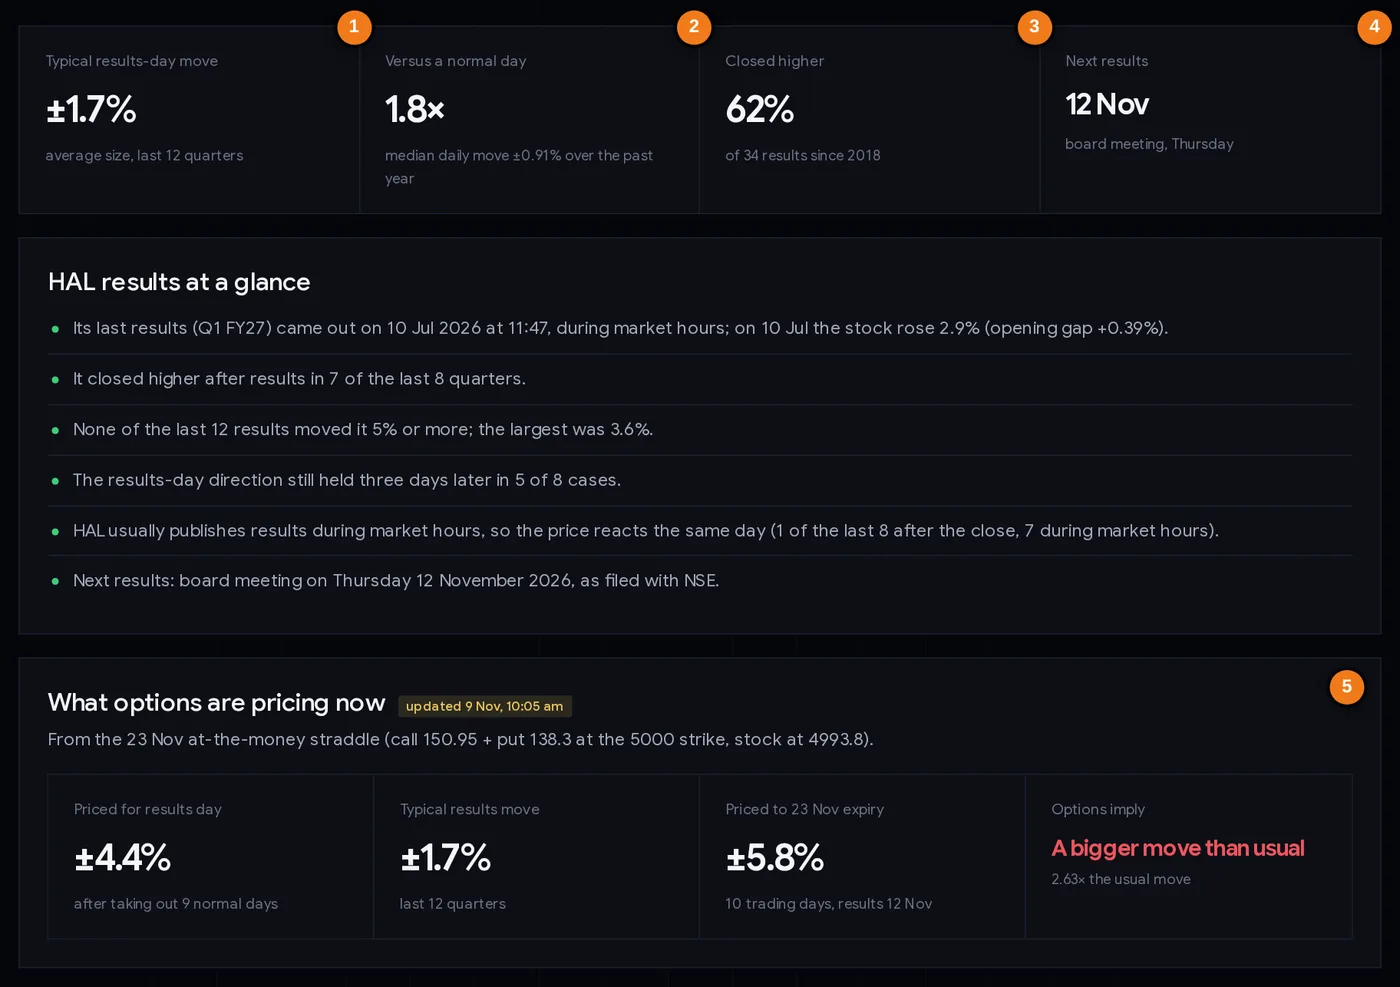
- 1Typical results-day move (last 12 quarters)
- 2How that compares with a normal day
- 3How often it closed higher after results
- 4Next results date
- 5What options are pricing for the coming results
The four boxes at the top summarise the stock. The bullet list underneath (“results at a glance”) is written from the data: when it last reported, how often it rose, its largest move, and whether it usually reports in market hours. The What options are pricing now box appears for stocks with results in the next three weeks.
How the options number is worked out
A straddle is one call plus one put at the same strike. Its price is roughly the move, up or down, that option sellers want to be paid for until expiry. On 9 Nov 2026 at 10:05 AM HAL traded at ₹4,993.80. The 23 Nov call and put at the ₹5,000 strike cost ₹150.95 and ₹138.30: together ₹289.25, about ±5.8% of the price, for 10 trading days. The tool then removes the move a normal day would contribute on the other 9 days. What is left, ±4.4%, is the move priced for results day itself. HAL’s typical results move is ±1.7%, so options were pricing 2.63× the usual move: “a bigger move than usual”.
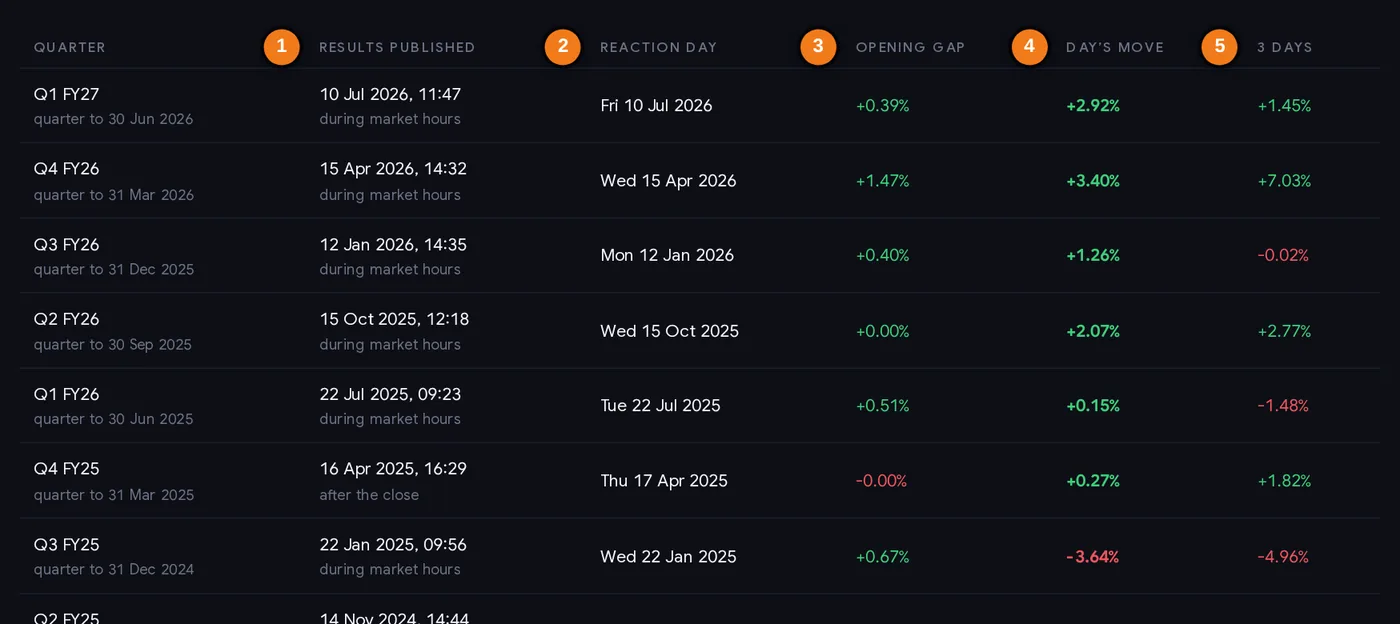
- 1When the results were published, and whether it was during market hours
- 2The day the market first reacted
- 3Opening gap against the previous close
- 4The day’s close-to-close move
- 5Where the stock was three days later
The history table lists every result, latest first. The “3 days” column shows whether the first reaction held. A move that reverses within three days tells you the first reaction was noise.
Step by step: your weekly results routine (10 minutes)
- Every weekend, open the calendar and note which stocks you own or trade have results in the coming week.
- For each one, open its stock page. Write down the typical move, the largest move in the last 12 quarters, and whether it reports during market hours or after the close.
- Turn the typical move into rupees. If you hold ₹2 lakh of a stock whose typical move is ±4%, a normal results day can swing ₹8,000. Look at the worst past move too: that is your realistic bad case.
- Decide before the date: keep the full position, reduce it, hedge it, or stay out until the numbers are out. Write the decision down.
- Check the options number on the evening before results. If options price much more than the usual move, option buyers are paying a lot; if much less, option sellers are taking a big risk for little premium.
- Confirm the date on the board meetings page or the company’s NSE filing. Dates can move.
- After results, read the actual numbers on the quarterly results tracker and see how the price reacted. Do not chase the first 15 minutes.
Three playbooks
Playbook A: the investor’s risk check
You hold shares for the long run and do not want to trade results. Use the calendar only to avoid surprises: if a stock’s worst results move in the last 12 quarters would hurt more than you can accept, trim the position before the date, or simply decide in advance that you will not react to the first day. Long-term investors often do best by not trading results at all.
Playbook B: wait for the reaction, then act
- Do nothing before results.
- On the reaction day, let the first 30–60 minutes pass. Our data shows 39% of opening gaps are reversed by the close.
- If the price holds above (or below) its first-hour range and the numbers support the move, a trader may take a position in that direction with a stop loss beyond the other side of the first-hour range.
- Size the position with the position size calculator. Results days are wider than normal days, so the same risk in rupees means fewer shares.
Playbook C: compare options with history (for F&O traders)
When the options number is far above the typical move (like HAL’s 2.63× on 9 Nov 2026), buying a straddle means paying for a move the stock has rarely made. When it is far below, selling options means accepting a big risk for a small premium. Neither is a signal on its own. Options can be priced high for good reasons (news, a changed business), and option selling has unlimited risk without a hedge. Use the option payoff calculator to see your loss if the stock moves twice its typical amount.
Always: decide your maximum loss in rupees first, use a stop loss or a defined-risk structure, and never put more on a single results day than you can afford to lose.
Case studies from the 2026 results seasons
Four real results days, taken from the stock pages on 9 Nov 2026. Moves are close-to-close on the reaction day.
1. Bandhan Bank, Q1 FY27: the tail risk
Results came out on 21 Jul 2026 at 4:14 PM, after the close. On 22 Jul the stock opened 10.00% lower (₹187.95 against ₹208.83) and closed at ₹173.50: −16.92%. Three days later it was down 20.54%. The previous quarter (28 Apr 2026) it had risen 11.00%. Two quarters, two huge moves, in opposite directions. Lesson: a high typical move (Bandhan’s is ±5.8%) means real money can change hands overnight. Position size is the only defence when results are after hours.
2. Wipro, Q2 FY27: the gap that reversed
Results on 15 Oct 2026 at 3:47 PM. Profit was down 1.4% year on year, according to the quarterly results tracker. On 16 Oct the stock opened 2.21% lower (₹170.20), then rallied to close at ₹184.40: +5.95%, and +8.69% three days later. A trader who sold the gap at the open lost about 8%. Lesson: the first price is not the verdict, and weak-looking headline numbers can still be met with buying.
3. HDFC Bank, Q1 FY27: the weekend result
The bank published on Saturday 18 Jul 2026 at 2:22 PM. Nobody could trade until Monday 20 Jul, when it opened 3.61% lower and closed −5.12%, down 8.11% after three days. Its typical results move is ±2.1%, and only 2 of its last 12 results moved it 5% or more. Lesson: even a large, steady stock can make a move two to three times its usual size. A weekend result also means no chance to exit after the numbers.
4. HAL: the calm one, and why calm is not a promise
HAL usually reports during market hours. On 10 Jul 2026 (Q1 FY27, published 11:47 AM) it rose 2.92%. It closed higher after 7 of its last 8 results and none of its last 12 moved it 5% or more. Yet on 9 Nov 2026 options were pricing ±4.4% for its 12 Nov results, 2.63× its usual move. Lesson: a good record says how the stock behaved, not how it will behave. When the market prices a bigger move than history, ask why before assuming history will repeat.
Common mistakes
- Treating “higher 62% of the time” as a buy signal. Across all F&O stocks, results days closed up 49% of the time, and last quarter’s direction predicted nothing.
- Holding a large F&O position through after-hours results. A stop loss cannot protect you from a 10% opening gap (Bandhan, 22 Jul 2026).
- Buying options without checking the price. If options already price 2–3× the usual move, the stock must move a lot just for you to break even.
- Selling options “because it never moves much”. HDFC Bank moved 5.12% on 20 Jul 2026 against a ±2.1% typical move.
- Reacting in the first minutes. 39% of gaps reversed by the close (Wipro, 16 Oct 2026).
- Forgetting weekend and holiday results. Saturday filings react on Monday; results on a holiday react the next trading day.
- Not re-checking the date. Companies sometimes postpone board meetings.
Before-results checklist
- I know the results date and whether the company reports in market hours or after the close.
- I have noted the typical move and the largest move of the last 12 quarters.
- I know what that move means in rupees for my position.
- I have decided in advance: hold, reduce, hedge or stay out.
- If trading options, I have compared the options price with the typical move.
- My maximum loss is fixed (stop loss, hedge or defined-risk structure).
- I will not trade the first 15–30 minutes of the reaction day.
- I will read the actual numbers before judging the move.
Glossary
| Quarterly results | A company’s revenue, costs and profit for a three-month period. |
| Results season | The weeks after a quarter ends when most companies report. |
| FY27, Q2 FY27 | Financial year April 2026 to March 2027; its second quarter, July to September 2026. |
| Board meeting | The directors’ meeting that approves the results; its date is announced in advance. |
| Reaction day | The first session that ends after results are published. |
| Opening gap | The open against the previous day’s close. |
| Typical move | Average size of the results-day move, last 12 quarters. |
| Normal day | The stock’s median daily move over the past year. |
| Straddle | A call and a put at the same strike; its price shows the move the market expects. |
| Implied move | The move option prices imply; here, for results day after removing normal days. |
| F&O stock | A share with futures and options trading on NSE. |
Questions
When are Q2 FY27 results announced?
Q2 FY27 covers July to September 2026. Companies have 45 days after 30 September to report, so most results come between mid-October and mid-November 2026. The results calendar lists each F&O company’s board meeting date as filed with NSE.
How much does a stock move on results day?
It depends on the stock. Across 1,601 results days of F&O stocks from October 2024 to November 2026, the median move was 1.3% up or down, about 1.2 times a normal day, but 8% of results days saw moves of 5% or more. Each stock’s page shows its own typical move.
Do stocks usually go up after good results?
Not reliably. In our data F&O stocks closed higher on results day 49% of the time, and the direction of the previous results day did not predict the next one. Price reacts to results versus expectations, not to growth alone.
What is the options implied move for results?
It is the move option prices are paying for. ChartMine takes the at-the-money call plus put for the first expiry after the results, converts it into an expected move, and removes the part that normal days would explain, leaving the move priced for results day.
What happens if results are announced after market hours?
The market reacts on the next trading day, usually first as an opening gap. Results on a Saturday or a holiday react on the next trading day too. A stop loss cannot protect you from that gap.
Where can I see the result dates of all companies, not only F&O stocks?
The board meetings page lists every upcoming board meeting announced to NSE, by date and purpose, including results meetings of smaller companies.
Is it safe to hold F&O positions through results?
It carries gap risk that you cannot control with a stop loss. Many traders reduce size, hedge or close positions before results. This is education, not advice; decide your maximum loss before the event.