
☰ All tutorials
Start here
Tool tutorialsHow to trade with ChartMineStocks
Stock monitorMy watchlistStock scores & checklistMarket & sectors
Nifty 50Bank NiftySensexFin NiftyDaily market reportMarket breadthSector rotationSector heatmapStock screenerRelative strength (RS)MCX commodity pricesFear & Greed IndexWhat happens after…Scanners
Top gainers & losersStocks to watch tomorrowNR7 stocks scannerInside bar stocks52-week high stocksGap up & gap down stocksRSI oversold stocksGolden cross stocksSuperTrend buy stocksScan builderEMA 9/21 crossoverMACD crossoverADX strong trendBollinger breakout / squeezeVolume spike stocksOpen = high / open = lowCandlestick pattern scannerNarrow CPR scannerF&O data
F&O ban listOI build-upOption chainPCR & max painExpiry calendarF&O lot sizesOI build-up heatmapPCR trendMax pain trendFutures basisStock screens
Quarterly growersProfit growth stocksLow P/E stocksMutual fund buyingNear 52-week low, growingDebt-free companiesHigh ROE & ROCEMagic Formula stocksLow price-to-bookSmart money
FII / DII dataShareholding changesBig-money footprintShort selling dataF&O positions by participantBulk & block dealsPromoter buyingDelivery percentageCalendars
Results calendarQuarterly results trackerBoard meetingsCorporate actionsIPO calendarIPO performanceResearch & planning
Strategy testerCompare stocksDividend yield stocksASM / GSM listExpiry-day movesSeasonality & stock historyNSE holidays 2026Position size calculatorOption payoff calculatorPivot point calculatorMore
Stock scanners hubStock screensHow to read the daily market report
A plain-language guide to ChartMine’s free daily market report: what each of its twelve parts means, from the “Today in 5 points” summary to tomorrow’s board meetings, the key terms, a 10-minute evening routine, three playbooks and real case studies from October and November 2026, including where the numbers misled.
What the daily market report is, in plain words
Every trading day the National Stock Exchange (NSE) publishes dozens of files: prices, delivery, F&O positions, FII and DII flows, deals, results. Reading all of them takes hours. The ChartMine market report reads them for you and writes one page per trading day that answers five questions:
- What did the market do? The indices and their distance from the record high, breadth, sectors and the Fear & Greed Index.
- Which stocks moved? Top gainers and losers, volume spikes, 52-week highs and lows.
- Who was buying and selling? FII (foreign) and DII (domestic institution) cash flows, delivery spikes, bulk and block deals.
- How are F&O traders positioned? Futures build-up, PCR, max pain, option walls, the ban list.
- What is coming next? Next-session levels, the day’s results, ex-dates and tomorrow’s board meetings.
The report opens with “Today in 5 points”: five short lines that pick out what mattered most, built only from the day’s numbers. If you have one minute, read those five lines. If you have ten, read the rest.
Each report sits at its own address, for example /market-report/2026-11-13/, so you can go back and read any past day. The index page lists the latest reports by month.
One line to remember: the report is a summary of facts from NSE’s files. It tells you what happened and what is scheduled. It does not tell you what will happen next, and nothing in it is a buy or sell call.
The twelve parts of every report
Every report follows the same order, so after a few days you know exactly where to look. Since 11 November 2026 the order puts the general market first and the options detail last. The row of buttons under the headline jumps straight to each part.
| Part (button) | What it contains | Who uses it most |
|---|---|---|
| Today in 5 points (Today) | Five lines on the index, breadth, flows, sectors and the day’s biggest movers. | Everyone |
| Indices | Nifty 50, Bank Nifty, Sensex and Fin Nifty: close, change, distance from the all-time high, 52-week range; plus the Fear & Greed Index. | Everyone |
| Market | Advances and declines, % above the 50 and 200-day averages, new highs and lows, sectors, rotation, RS leaders. | Everyone |
| Movers | Top gainers, losers and volume spikes (₹1 crore+ traded), NIFTY 50 movers, 52-week highs and lows with quality scores, high-quality fallers, candlestick counts. | Swing traders, investors |
| Smart money | FII and DII cash flows, the month so far and streaks, FII index futures, big-buyer days, bulk and block deals, short selling. | Swing traders, investors |
| F&O | Long and short build-up counts, NIFTY PCR and max pain, biggest build-ups and streaks, the ban list. | F&O traders |
| Commodities | MCX near-month futures closes for gold, silver, crude oil, natural gas and copper, with the session date. | Commodity watchers, investors |
| Intraday prep | Next session’s CPR, pivot, R1/R2, S1/S2, call and put walls, max pain, the priced move, India VIX, and F&O stocks with tight CPR, NR7, inside bars and gaps. | Intraday traders |
| Options recap | How each index’s options traded through the day: PCR, at-the-money IV (implied volatility), straddle price, gamma walls and the gamma flip. | Options traders |
| Results | The day’s quarterly results, largest profit first: growth year on year, net profit, quality score and rank in its sector. | Investors |
| Events | Coming ex-dates (dividends, splits, buybacks) and changes to NSE’s ASM/GSM surveillance lists. | Everyone holding stocks |
| Tomorrow | Board meetings on the next session, most traded companies first and how many are for results, plus stocks going ex-date. | Everyone |
Each part ends with links to the full tool behind it (for example OI build-up, FII/DII data or board meetings), so the report doubles as a daily table of contents for the whole site. Reports from before 11 November keep their original layout.
Key terms used in the report
The report uses market vocabulary. Here is what the words mean, in one line each. You will find longer explanations in each tool’s tutorial.
| Term | Plain meaning |
|---|---|
| Advances / declines | How many stocks closed higher and lower than the day before. On 13 Nov 2026 the report counted 1,448 NSE stocks. |
| Below all-time high | How far today’s close is under the index’s highest close ever. On 13 Nov NIFTY 50 was 4.7% below its record of 26,373 (5 Jan 2026). |
| Fear & Greed Index | ChartMine’s 0–100 mood gauge built from several market measures: 0 is extreme fear, 100 extreme greed. It read 69 (Greed) on 13 Nov. |
| Volume spike | Today’s volume divided by the stock’s 20-day average. “13.9× normal” means almost 14 times the usual number of shares traded. |
| Q (quality score) | ChartMine’s 0–100 score of business quality from the latest filings. The report highlights scores of 70 and above. See stock scores. |
| FII / DII net | Foreign institutional investors and domestic institutions (mutual funds, insurers). “Net buyers of ₹5,737 Cr” means they bought ₹5,737 crore more than they sold in the cash market that day. |
| Streak / month so far | How many sessions in a row FIIs or DIIs stayed on the same side, and their total net flow since the 1st of the month. |
| PCR | Put-call ratio: open interest in puts divided by open interest in calls. Above 1 means more puts are open than calls. |
| Max pain | The strike at which option buyers as a group would lose the most at expiry. Some traders watch it as a “magnet”; it is not a forecast. |
| Straddle / priced move | The cost of buying the at-the-money call and put together. It shows how big a move the options market is pricing by expiry, in points. |
| India VIX | NSE’s fear gauge, based on NIFTY option prices. Rising VIX = traders expect bigger swings. |
| Build-up | Futures price and open interest together: long build-up (both up), short build-up (price down, OI up), short covering, long unwinding. |
| Big-buyer day | A stock whose delivered shares were at least 3× its normal, with a normal or higher delivery %. It shows heavy real ownership change, in either direction. |
| MCX near-month | The commodity futures contract on the Multi Commodity Exchange that expires soonest, the most traded one. |
Why read it: advantages and limits
✅ Ten minutes instead of two hours
Index levels, breadth, flows, F&O positioning, results and tomorrow’s calendar in one scroll, from NSE’s own files.
✅ Same structure every day
Because the order never changes, you notice what is unusual: a record PCR, a breadth collapse, a sudden FII reversal.
✅ An archive you can search
Every past day keeps its own page. Before reacting to a headline, you can check how a similar day looked a week or a month ago.
✅ The one-minute version first
“Today in 5 points” and the index cards give the whole day at a glance before you scroll into detail.
The limits (please read this part)
We checked one part of the report against what actually happened: the line “the at-the-money straddle prices a move of about ±N points by expiry”. This is a range many option sellers use.
| Report date | NIFTY expiry | Priced range | NIFTY close on expiry day | Inside? |
|---|---|---|---|---|
| 19 Oct 2026 | 27 Oct | 22,548–23,230 | 22,750 | Yes |
| 23 Oct 2026 | 27 Oct | 22,325–22,875 | 22,750 | Yes |
| 27 Oct 2026 | 3 Nov | 22,362–23,138 | 23,811 | No, 673 points above |
| 30 Oct 2026 | 3 Nov | 22,822–23,284 | 23,811 | No, 527 points above |
| 2 Nov 2026 | 3 Nov | 23,261–23,620 | 23,811 | No, 191 points above |
In the quiet week to 27 October every priced range held; in the rally week to 3 November NIFTY closed outside every one. On 30 October max pain was 23,000 and NIFTY finished the expiry at 23,811. A few weeks prove nothing either way, which is the point: these numbers describe today’s positioning, not tomorrow’s price.
- It is end-of-day. A review and a plan built from NSE’s closing files, not a live feed.
- Some parts can be missing. If an NSE file arrives late, that section is thinner. The report for 28 Oct 2026, for example, has breadth and sectors but no NIFTY headline numbers. A part with no data is simply left out.
- Extreme movers need a second look. The movers lists only require ₹1 crore of trading, so a small, thinly traded stock can top them. On 13 Nov the biggest fall was Pashupati Cotspin at −58.1%, a stock that had fallen 5% a day on tiny volume on the two days before and joined NSE’s long-term ASM list that day. Open the stock page before reading anything into such a number.
- Commodity closes can be a day old. MCX’s evening session runs to 11:30 pm, after the report is built, so the Session column may show the previous day.
- It is not personalised. It cannot know your capital, your time frame or your risk. Turning facts into a trade is your job, with a stop loss and a position size.
A tour of the report page
Open the market report and click the latest day. Here is Friday 13 November 2026.
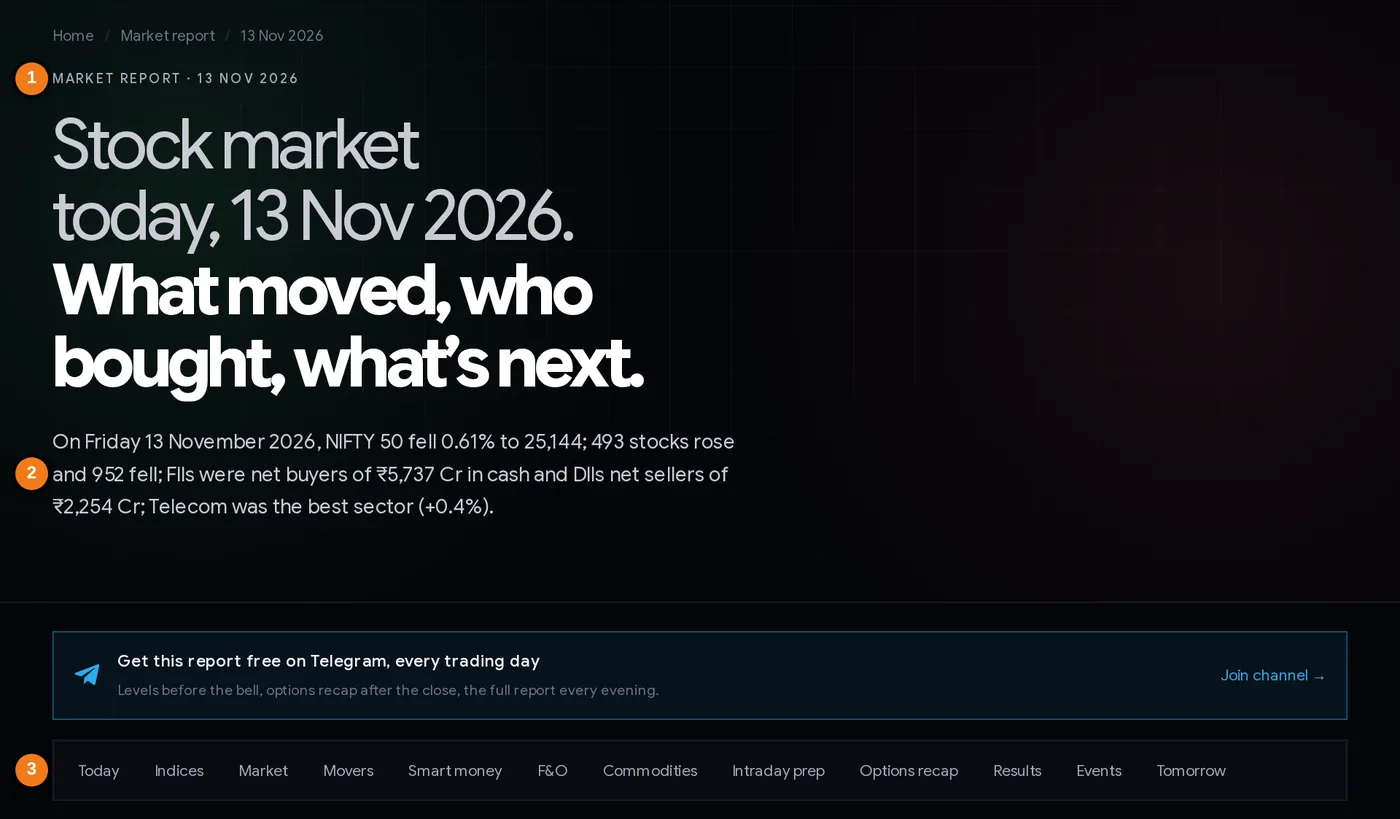
- 1The report date (every day has its own page).
- 2The headline sentence: the whole day in one line.
- 3Jump buttons to the twelve parts of the report.
The headline sentence is the day in one breath. On 13 Nov 2026 it read: NIFTY 50 fell 0.61% to 25,144; 493 stocks rose and 952 fell; FIIs were net buyers of ₹5,737 Cr and DIIs net sellers of ₹2,254 Cr; Telecom was the best sector (+0.4%). The five points underneath add the context the headline cannot: NIFTY was 4.7% below its all-time high, 42 stocks closed at a 52-week high and 9 at a low, FIIs had been net buyers 10 sessions in a row, Power was the weakest sector (−1.6%), and 5 high-quality stocks fell 3% or more, led by Jeena Sikho Lifecare (−7.0%).
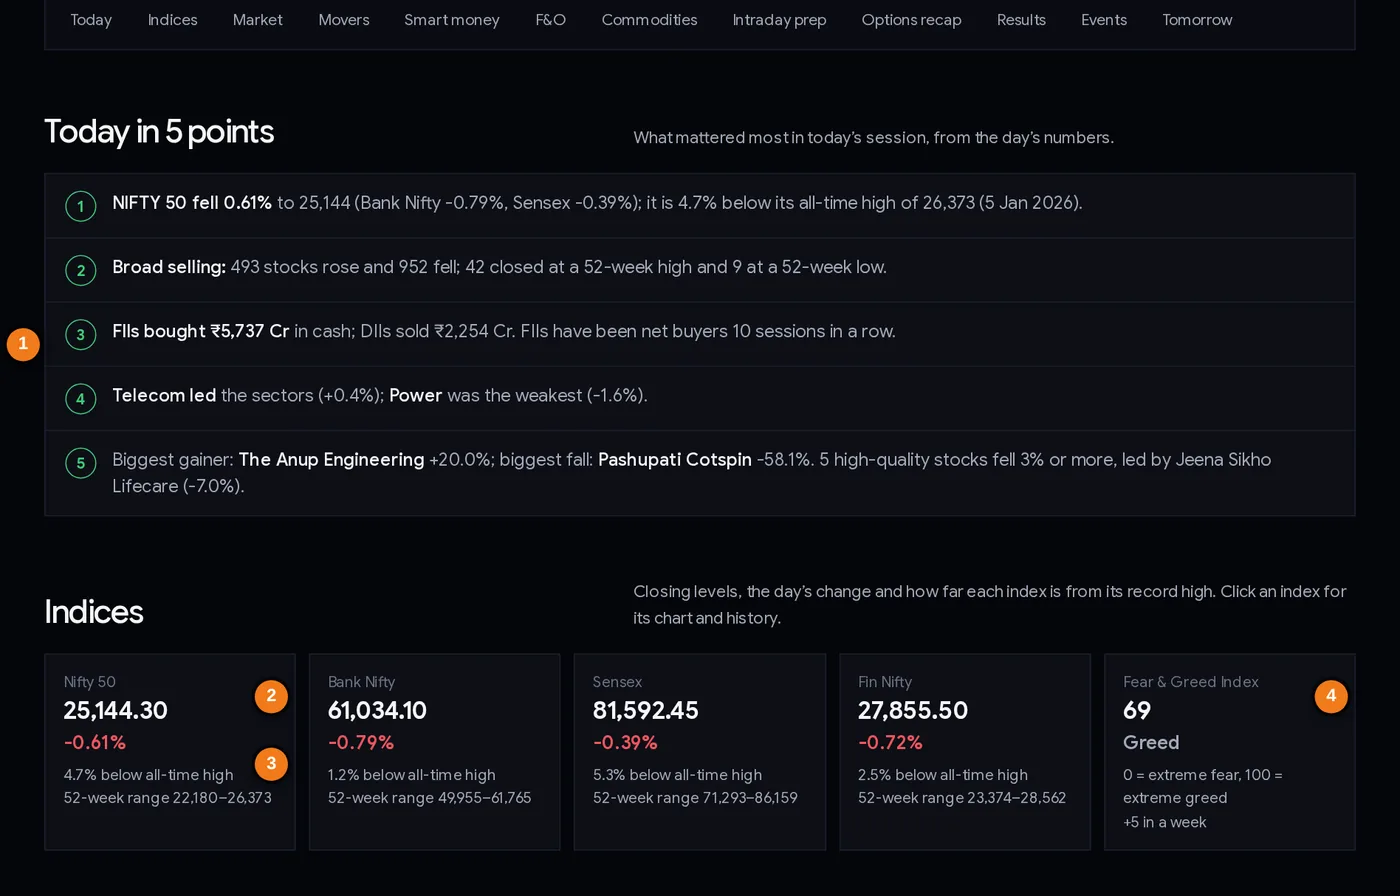
- 1Today in 5 points: what mattered most, from the day’s numbers
- 2Close and the day’s change
- 3Distance from the all-time high and the 52-week range
- 4Fear & Greed Index reading and its change in a week
How the five points are chosen
| Point | What it says and the rule behind it |
|---|---|
| 1. Index | NIFTY’s move, Bank Nifty and Sensex in brackets, and the distance from the record close (or “new all-time high”). |
| 2. Breadth | “Broad buying” or “broad selling” when one side beats the other by 1.5 times; “narrow gains” when NIFTY rose but falling stocks outnumbered rising ones by 1.2 times; otherwise “mixed”. Plus the count of 52-week highs and lows. |
| 3. Flows | FII and DII net cash flow. It adds “largest since…” for an unusually big day and the streak once it reaches 3 sessions. |
| 4. Sectors | The best and weakest sector of the day. |
| 5. Stocks | The biggest gainer and loser (₹1 Cr+ traded) and how many stocks with a quality score of 75+ fell 3% or more. |
The Indices cards answer “where are we?”. On 13 Nov Bank Nifty was only 1.2% below its record while Sensex was 5.3% below, which tells you the banks have held up better than the wider market over recent months. Click a card for that index’s chart and history. The last card is the Fear & Greed Index: 69, “Greed”, up 5 points in a week.
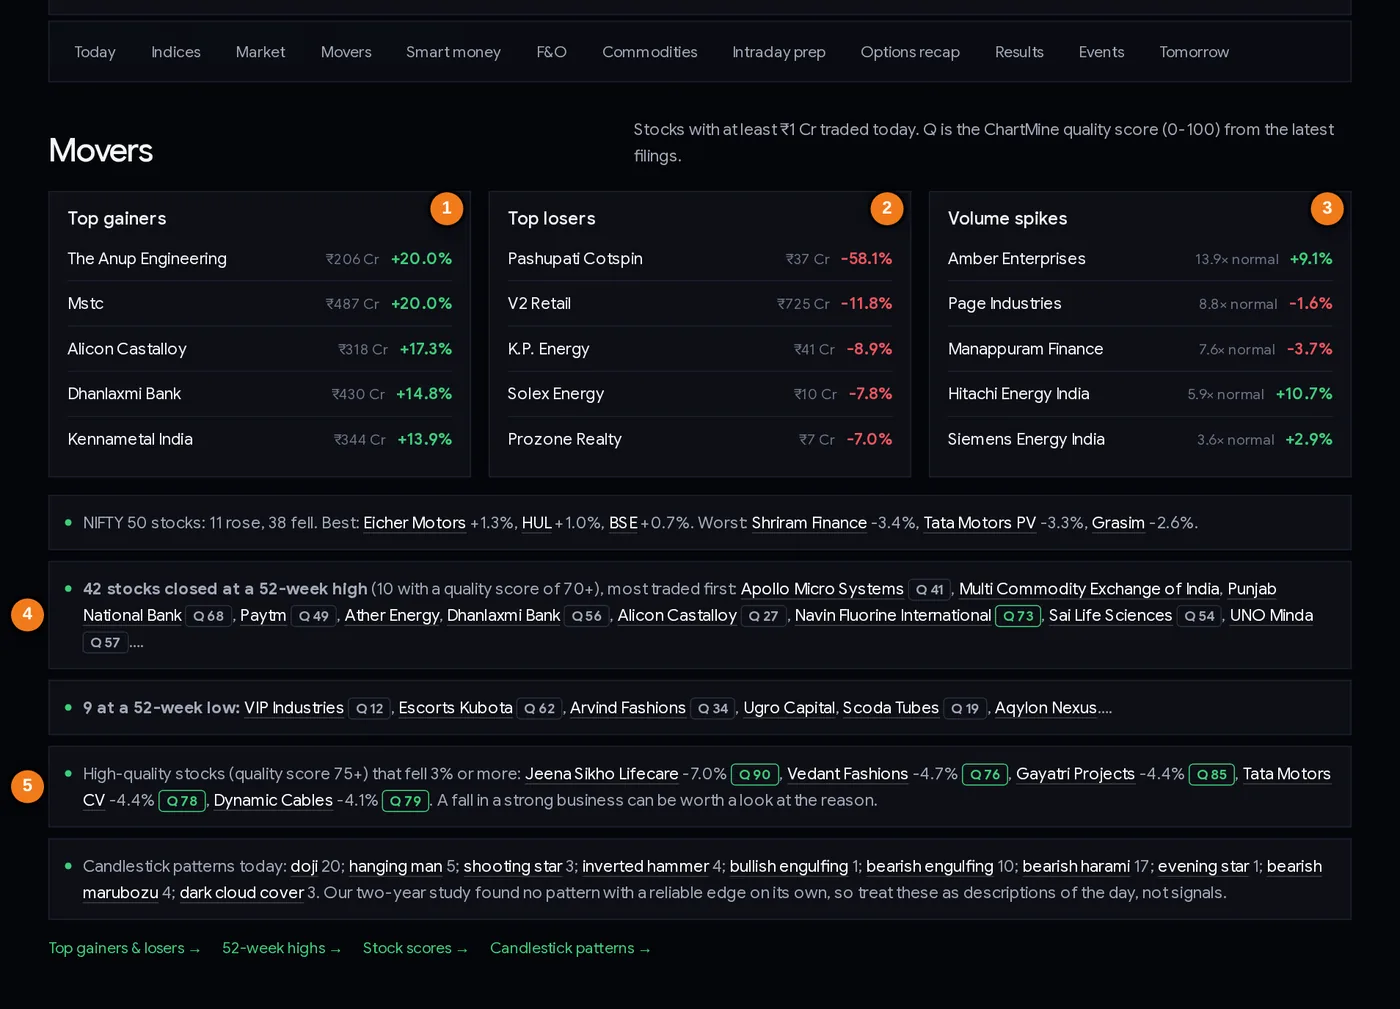
- 1Top gainers with the value traded
- 2Top losers
- 3Volume spikes: times the 20-day average
- 452-week highs, most traded first, with quality score
- 5High-quality stocks that fell 3% or more
Reading the Movers part
| Item | What it tells you (13 Nov 2026) |
|---|---|
| Top gainers / losers | The five biggest rises and falls among stocks with ₹1 Cr or more traded. The Anup Engineering and MSTC both rose 20.0%. |
| Volume spikes | Volume against the 20-day average. Amber Enterprises traded 13.9× its normal and rose 9.1%; Page Industries traded 8.8× and fell 1.6%. A spike says interest jumped, not in which direction. |
| NIFTY 50 stocks | 11 rose and 38 fell; best Eicher Motors +1.3%, worst Shriram Finance −3.4%. |
| 52-week highs / lows | Most traded first, each with its quality score. 42 highs, 10 of them with Q 70+, such as Navin Fluorine International (Q 73). |
| High-quality fallers | Stocks with Q 75+ that fell 3% or more: Jeena Sikho Lifecare −7.0% (Q 90), Vedant Fashions −4.7% (Q 76). A starting point to read the reason, not a signal. |
| Candlestick counts | How many stocks formed each pattern (10 bearish engulfing on 13 Nov). The report itself notes that a two-year study found no pattern with a reliable edge on its own. |
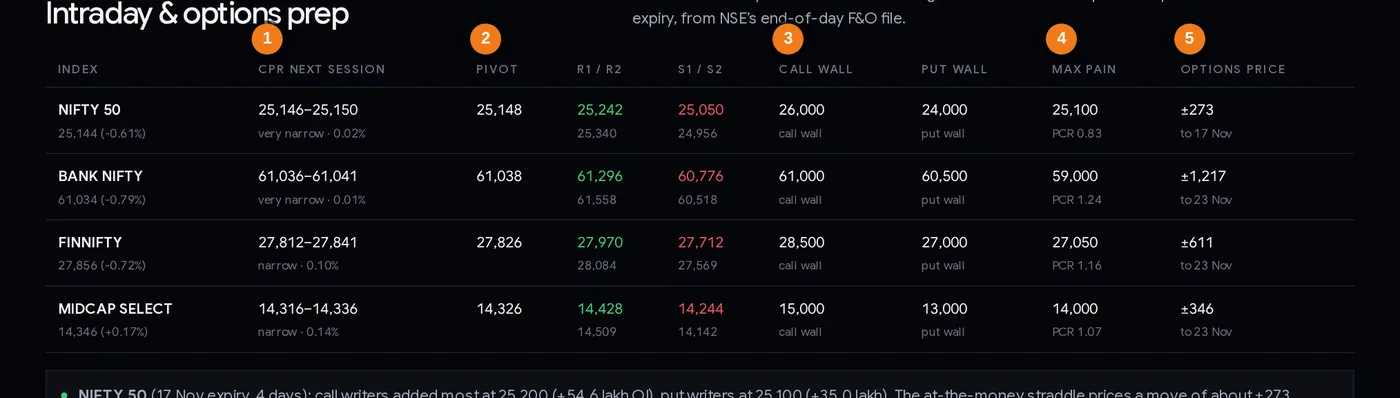
- 1Next session’s CPR and its width
- 2Pivot
- 3Call wall
- 4Max pain
- 5The move options are pricing to expiry
Reading the intraday prep table
| Column | What it tells you |
|---|---|
| Index | Close and the day’s change, e.g. NIFTY 50 25,144 (−0.61%). |
| CPR next session | The central pivot range for the next day and its width. On 13 Nov NIFTY’s CPR for Monday 16 Nov was “very narrow · 0.02%” (25,146–25,150); narrow hints at a trending day, wide at a calmer two-way one. See the narrow CPR tutorial. |
| Pivot, R1/R2, S1/S2 | Classic floor-trader levels from the day’s high, low and close. For 16 Nov: pivot 25,148, R1 25,242, S1 25,050. |
| Call wall / put wall | Strikes with the most open interest for the next expiry: 26,000 and 24,000 for NIFTY. |
| Max pain | 25,100 for the 17 Nov expiry, with NIFTY at 25,144. |
| Options price | The move priced to expiry: ±273 points for NIFTY (24,872–25,417). |
The Market, Smart money and F&O parts use small number boxes. On 13 Nov: 52% of stocks above their 200-day average, FII index futures 35% long, 66 big-buyer days, NIFTY PCR 0.98. Commodities gave MCX gold at ₹136,750 per 10 g (+0.39%).
Step by step: a 10-minute evening routine
- After about 8 PM, open the latest report. The site rebuilds in the evening after NSE’s files arrive, with a final refresh at about 10:15 PM. Check the date in the headline.
- Read “Today in 5 points”.
- Glance at the index cards. How far is each index from its record? Is Bank Nifty stronger or weaker than NIFTY? Did the Fear & Greed Index move a lot in the week?
- Check the flows. Note the FII and DII figures, the month so far and the streak.
- Scan Movers for stocks you hold or watch: a volume spike, a 52-week high or low, or a high-quality stock that fell. Click through before drawing a conclusion.
- Look at F&O positioning. Is NIFTY PCR unusually high or low (“higher than 56% of days” is ordinary)? Is anything new in the ban list?
- Scan the results table. Big profit swings often mean a gap the next morning.
- Read “Tomorrow”. Board meetings (especially results) and ex-dates. A dividend is taken out of the price on the ex-date. Banned F&O stocks cannot take fresh positions.
- Write three lines in your journal: the market mood (broad or narrow), one thing that was unusual, and the levels you will watch tomorrow (pivot, R1, S1 for NIFTY).
Three ways traders use the report
Playbook A: the intraday trader’s morning sheet
Copy the next session’s NIFTY and BANK NIFTY pivot, R1, S1 and option walls, plus the tightest-CPR and NR7 stocks, onto your chart before 9:15. During the day you act only when price reaches a level you already planned for, with a stop loss decided in advance. If India VIX rose sharply (on 6 Nov it was up 12.10% to 17.47), expect wider swings and size smaller; when it falls (on 13 Nov it eased 6.75% to 15.50) ranges may narrow.
Playbook B: the swing trader’s weekly review
On the weekend open the last five reports side by side. Write down: the FII flow each day and the month so far, breadth (advances/declines), the Fear & Greed reading, which sectors moved from improving to leading, and which stocks appeared repeatedly among long build-ups, volume spikes, 52-week highs or big-buyer days. Stocks that show up several days in a row become your watchlist for the week. Check each on its stock page before planning anything.
Playbook C: the investor’s results and events check
Long-term investors can skip the options part. Read the results table for companies you own (on 13 Nov, Eicher Motors reported net profit of ₹1,573 Cr, +14.9% year on year, with a quality score of 86, 3rd of 84 auto stocks), check the “high-quality stocks that fell” line for names on your list, look at coming ex-dates and board meetings, and check the surveillance changes. If a stock you hold enters the ASM or GSM list, find out why before doing anything else.
Whatever your style: the report gives you facts and levels. Decide your risk per trade first (for example 0.5% to 1% of capital), then use the position size calculator.
Case studies from real reports
Five situations from the October–November 2026 reports. All numbers are from the reports and NSE’s files.
1. 6 Nov 2026: index up, most stocks down
NIFTY rose 2.01% to 25,030, yet only 468 stocks rose and 948 fell. How can both be true? NIFTY is weighted by company size, so a few giants carry it. That day ICICI Bank rose 4.75% and HDFC Bank 3.72%, while the average stock fell. Lesson: always read the index next to breadth. A rally carried by a handful of heavyweights is narrower than the headline suggests.
2. The week of 2–6 Nov 2026: a flow streak
FIIs were net buyers in cash on all five days: ₹3,115 Cr, ₹6,837 Cr, ₹7,284 Cr, ₹14,975 Cr and ₹13,750 Cr, about ₹45,961 Cr in total, while DIIs were net sellers each day. NIFTY went from 23,053 (30 Oct close) to 25,030 (6 Nov), up about 8.6%. On 4 Nov breadth was very broad (1,173 up, 253 down, all 20 sectors green). Lesson: a streak across several reports says more than any single day. It describes the past week, though; it does not promise the next one.
3. 23 Oct 2026: the gloomiest report of the month
NIFTY fell 0.39% to 22,600, but under the surface it was much worse: 149 stocks rose and 1,273 fell. India VIX rose 6.96% to 16.86. Only 11% of stocks were above their 50-day average. Two weeks later NIFTY was at 25,030. A trader who only read the gloomy headline would have expected more falls. Lesson: extreme pessimism in the report is information too; washed-out breadth has often come near turning points, but timing them is hard and it does not always work.
4. 27 Oct and 3 Nov expiries: priced ranges that held, then failed
As the table in the “limits” section shows, every priced NIFTY range held for the 27 Oct expiry and every one failed for the 3 Nov expiry, by up to 673 points. Lesson: the priced move is an average expectation, not a wall. Always define your maximum loss before selling options.
5. 9–13 Nov 2026: FIIs kept buying, NIFTY barely moved
By 13 Nov the Smart money part said FIIs had been net buyers for 10 sessions in a row and DIIs net sellers for 10, with November so far (9 sessions) at FIIs +₹79,303 Cr and DIIs −₹48,388 Cr. In the first week (2–6 Nov) NIFTY rose about 8.6%. In the second week FIIs bought another ₹33,343 Cr in four sessions, yet NIFTY went only from 25,030 to 25,144, about +0.5%, and on 13 Nov it fell 0.61% with 952 stocks down. Lesson: a flow streak describes who is buying; it does not decide the next day’s direction. Domestic selling, profit taking and news all count too.
Common mistakes
- Reading only the headline. Case 1: NIFTY +2% with 2 stocks falling for every 1 rising. The second of the five points labels this for you (“narrow gains”).
- Treating one day of FII data as a signal. Flows are noisy; look for streaks across several reports.
- Using max pain or the priced range as a target. Case 4: NIFTY ended 811 points above the 30 Oct max pain.
- Reading a big-buyer day as “buying”. Thermax had 16× normal delivery on 6 Nov and fell 17.3%.
- Taking the top loser or gainer at face value. A −58.1% day in a thinly traded surveillance stock (13 Nov) is a reason to check the stock page, not a market signal.
- Treating candlestick counts or volume spikes as signals. They describe the day. The report says so itself.
- Ignoring the “Tomorrow” part. An ex-dividend date lowers the opening price by the dividend; it is not a fall in value.
- Acting on everything. The report lists dozens of stocks. Pick the two or three that fit your plan and ignore the rest.
Evening checklist
- The report date is the latest trading day.
- “Today in 5 points” read: breadth label (broad, narrow or mixed) noted.
- Index cards checked: distance from the record and the Fear & Greed reading.
- FII and DII flows, the month so far and the streak checked.
- Movers, results and big-buyer days checked for stocks you hold or watch; extreme movers opened on their stock page.
- NIFTY PCR, max pain and India VIX noted; anything unusual?
- Board meetings, ex-dates and F&O ban for tomorrow checked.
- Next session’s NIFTY pivot, R1, S1 written down.
- Any trade idea has an entry, a stop loss and a position size before the market opens.
Glossary
| Breadth | How many stocks take part in a move (advances vs declines, % above averages). |
| All-time high | The highest close an index or stock has ever made. |
| Net buying | Purchases minus sales, in ₹ crore. |
| CPR | Central pivot range: pivot, TC and BC from the previous day’s high, low and close. |
| R1 / S1 | First resistance and first support from the pivot formula. |
| IV | Implied volatility: how much movement option prices assume, as a yearly %. |
| Board meeting | A company’s directors meeting, often to approve quarterly results or a dividend. |
| Ex-date | The day a stock starts trading without its dividend or other benefit. |
| F&O ban | Stocks whose open interest crossed 95% of the market-wide limit; no fresh F&O positions allowed. |
| NR7 / inside bar | The narrowest range of the last 7 days / a day inside the previous day’s range. |
| Call wall / put wall | Strikes with the largest call / put open interest. |
| ASM / GSM | NSE surveillance lists with stricter trading rules. |
Questions
What is the stock market report today?
ChartMine publishes a free daily market report every trading day evening: five key points, the indices and Fear & Greed Index, top movers, FII and DII flows, F&O positioning, commodities, the day’s quarterly results and tomorrow’s calendar, all compiled from NSE’s own files.
What time is the daily market report published?
In the evening after NSE releases its end-of-day files. The site is rebuilt at about 8 PM IST with a final refresh around 10:15 PM, so the full report is usually ready by then.
Can I read old market reports?
Yes. Every trading day has its own page, for example /market-report/2026-11-06/, and the index page lists reports month by month.
Why did NIFTY rise when most stocks fell?
NIFTY is weighted by company size, so a few large stocks can lift it while the average stock falls. On 6 Nov 2026 NIFTY rose 2.01% while 948 stocks fell and 468 rose. The report shows both numbers side by side for this reason.
What does “Today in 5 points” mean in the report?
It is a five-line summary at the top of each report: the index move and distance from the all-time high, breadth, FII and DII flows, the best and weakest sector, and the biggest movers. It is generated from the day’s numbers only, not from opinions.
Is the market report investment advice?
No. It is a factual summary of NSE data for information and education. ChartMine is not a SEBI-registered adviser. Use it as an input to your own analysis, with a stop loss and sensible position size.
What does the straddle priced move mean in the report?
The cost of the at-the-money call plus put for the next expiry, shown as a ± range in points. It is the move the options market expects on average. In our check, NIFTY stayed inside it for the 27 Oct 2026 expiry and closed outside it for the 3 Nov 2026 expiry.
Can I get the report on Telegram?
Yes. The report page links to ChartMine’s free Telegram channel, which posts levels before the open, an options recap after the close and the full report every evening.